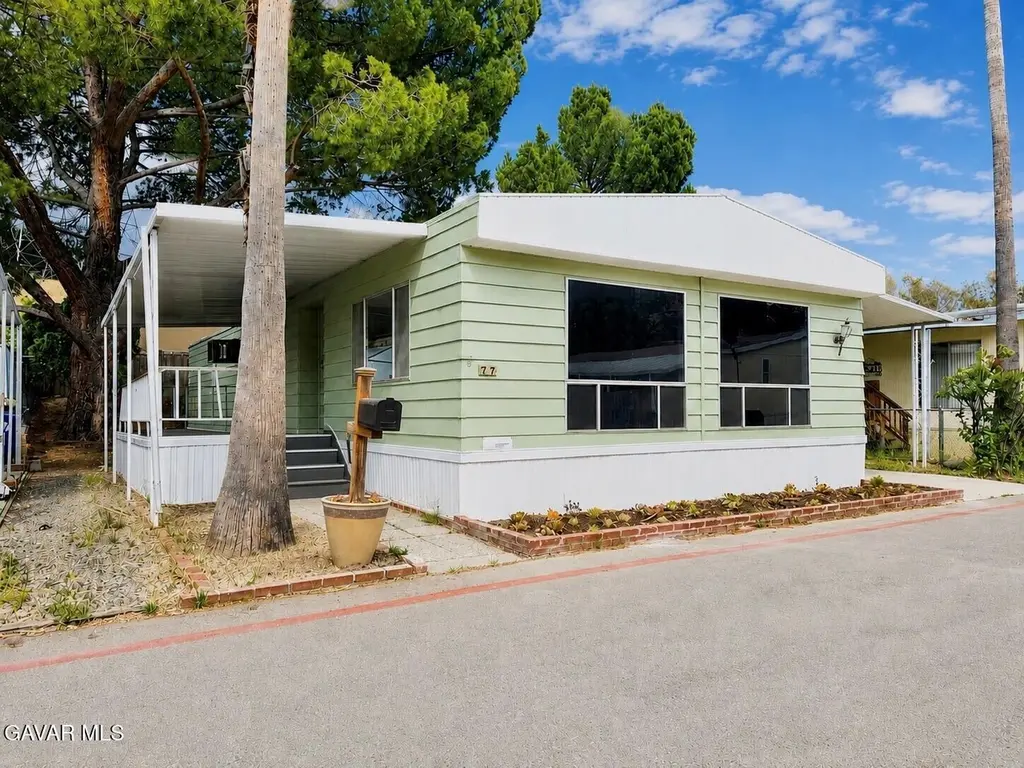
36200 Paradise Ranch Rd Spc 77 · Hasley Canyon, CA
Flood risk 9/10 · Severe
- FEMA flood zone
- D
- Chance of flooding over 30 yrs
- 0.99%
- Est. flood insurance / yr
- $544 – $1,084
Fire risk 10/10 · Severe
- Est. fire insurance / yr
- $659 – $1,223
Heat risk 5/10 · Moderate
- Hot days now (above 96°F)
- 8 days/yr
- Hot days in 30 yrs
- 22 days/yr
Wind risk 1/10 · Minimal
- Chance of severe wind over 30 yrs
- —
Air-quality risk 7/10 · Major
- Unhealthy air days now
- 15 days/yr
- Unhealthy air days in 30 yrs
- 18 days/yr
Risk factors via First Street. Map © Google.
Why this score? — see what drove the B grade
The composite is a weighted blend of 9 inputs, each scored 0–100. Each bar is that input's sub-score; the figure is the points it added to the 100-point composite (weight × sub-score).
- Cash flow +30.0/30.0
- 1% rule +10.0/10.0
- DSCR +10.0/10.0
- ARV discount +7.5/15.0
- Schools +5.9/10.0
- Condition / age +3.8/5.0
- Rent growth +2.5/5.0
- Livability +2.5/5.0
- Appreciation +0.0/10.0
$199,000
🖨 Deal sheet 📄 Offer letter ✓ Due diligence
Listing remarks MLS
Beautiful area of Castaic, CA Park amenities include Pool, Clubhouse and Play area for the kids off the 5 North Freeway Templin HWY Just 8 Mins away from the Famous Castiac Lake.
Key facts
- Clubhouse
- New flooring
- Gorgeous views
Tags
Property features AI
Finance
- Other: APN 8950-245-077; Park manager: Sonya
- HOA & community: Park amenities include barbecue area, clubhouse/rec room, pool, and recreation area; New space rent listed at $1,900 (verify with manager)
Exterior
- Utilities: 100 Amp electric service; Check with manager for utilities details
- Home design: Mobile home (manufactured 1973); Located in a park (Paradise Ranch), Space 77; All-ages park
- Construction: Composition shingle roof; Skirted; Manufactured by GRNBR; trade name GRNBR; Model: NONE; Serial number: 2173321X/U; Length 60', Width 24'
- Exterior features: Siding exterior; Awning; Porch; E.Q. braces
Interior
- Kitchen: Dishwasher; Gas Range; Gas Oven; Disposal
- Bathrooms: 2 full bathrooms
- Heating & cooling: Central electric heating; Refrigerator wall/window unit (window-style refrigeration)
- Interior features: Dishwasher; Gas Range; Gas Oven; Disposal
Neighborhood map
What this means for you Summary
Snapshot
- This is a 4-bed/2.0-bath manufactured listed at $199k. Condition is rated good.
Deal economics
- At list price, monthly cash flow is $1k ($16k/yr) — positive.
- The deal already cash-flows at list — no discount required.
- Meets the 1% rule at list price ($3k rent vs $199k).
- Recommended offer: $196k (1.5% below list) — sets the bar for market timing.
Location & tenants
- Location reads 49/100 on livability (#1,168 in CA) — a working-class tenant base; expect higher turnover. Strengths: crime A+, employment A+; Watch: housing C-, schools F, amenities F.
- William S. Hart Union High (suburban): math 52% / reading 72% proficiency, ranked #155 of 1,400 in CA (top 11%) — acceptable for families but not a draw, mixed tenant base, ~2y average lease; only 18% free/reduced lunch — higher-income household profile.
- Market conditions: 140 active listings in the ZIP; 19,697 units permitted in Los Angeles County in 2024 (9,426 in 5+ unit buildings).
Forward outlook
- Local home prices are declining (-3.0%/yr); year-one equity from $1k of loan paydown is wiped out by about $6k of value loss. Plan a longer hold.
- Los Angeles County population projected at +9% by 2050 — modest demand growth; plan on rents tracking national, not racing it.
- At projected returns (-3.0% appreciation + 3.0% rent growth), your $56k cash investment doubles in ~5 years — after that, you're playing with house money.
Negotiation context
- It's been on market 15 days — a 2% lower offer ($196k) is reasonable based on typical stale-listing flexibility.
- 2 sale attempts with the ask held roughly flat each time — persistent listings suggest the price (not the market) is what's stuck; bring a comps-based counter.
- Current owner paid $40k; list at $199k implies a 398% gain — meaningful room to come down on a strong offer.
Risks & watch-outs
- Watch-outs: flood insurance adds $68/mo.
- Climate carrying-cost: severe flood risk; severe wildfire risk; extreme-heat days projected 8→22/yr by 2055 (HVAC capex compounding) — expect insurance premiums to compound above CPI over the hold.
Questions for the listing agent
- Built in 1974 — when were the roof, HVAC, electrical panel, plumbing, and water heater last replaced?
- What's the actual annual flood-insurance premium (NFIP or private), and is the property in a SFHA with mandatory coverage?
- Is there a deadline driving the sale (1031 exchange, divorce, estate, relocation)? That informs how much negotiation room exists.
- Schools are F-rated, which usually means shorter tenancies and higher turnover. Who's the typical renter profile here, and what's been the actual vacancy rate?
- What's the average days-on-market for RENTAL listings here right now (not sales)? A rising rental-DOM trend means longer vacancies and softer asking-rent achievability than the comps imply.
- What's the recent tenant-quality profile in this submarket — average credit score on applications, eviction rate, late-payment / NSF rate, and stable-employment percentage? A property-management company in the area should have these aggregated.
- How much new for-sale + rental construction is in the pipeline within 1–3 miles? Heavy new supply typically softens prices + rents 12–24 months out; constrained supply supports both.
Investment metrics
- 1% rule
- 1.63% ✓
- Cap rate
- 14.73%
- Cash-on-cash
- 30.14%
- DSCR
- 2.34
- GRM
- 5.1
CMA / ARV
- ARV (on-the-fly)
- $99,360
- Comps found
- 4
Show comp detail 4 sales within ~0.75 mi
| Address | Dist | Beds/Ba | Sqft | Sold | Price | $/sf | Match |
|---|---|---|---|---|---|---|---|
| 36200 Paradise Ranch Rd #77 | 0.00mi | 4/2.0 | 1,440 (0%) | 3mo | $40,000 | $28 | 97 |
| 36200 Paradise Ranch Rd #44 | 0.00mi | 3/2.0 (-1) | 1,440 (0%) | 10mo | $100,000 | $69 | 87 |
| 36200 Paradise Ranch Rd #83 | 0.02mi | 3/2.0 (-1) | 1,440 (0%) | 14mo | $100,000 | $69 | 83 |
| 36200 Paradise Ranch Rd #88 | 0.00mi | 3/2.0 (-1) | 1,536 (+7%) | 6mo | $135,000 | $88 | 79 |
Match score weights: distance 35% · size 25% · config 20% · recency 20%. Top-matched comps best support the ARV.
Projected returns pro-forma
-3.0% appreciation · 3.0% rent growth · sell at horizon
- IRR
- 23.0%
- Equity multiple
- 1.94×
- Total profit
- $52,541
- Equity at exit
- $29,672
- IRR
- 30.9%
- Equity multiple
- 3.78×
- Total profit
- $154,824
- Equity at exit
- $17,206
Cash invested: $55,720 (down + closing). Projections, not guarantees.
Landlord ↔ Tenant lean methodology
- Overall (STATE)
- 18 Strongly Tenant-Friendly
- State California
- 18 Strongly Tenant-Friendly · D+13
- County
- — inherits STATE
- City
- — inherits STATE
ZIP-level market 91384
- Home prices YoY
- -28.3%
- Active inventory
- 140
- Price-to-rent
- 5.1×
Monthly cashflow live
- Estimated rent
- $3,248 medium interval (Pro) →
- Mortgage (P&I)
- −$1,044
- Tax from tax record
- −$40 /mo · $480/yr
- Insurance
- −$83
- Flood insurance flood zone
- −$68 /mo · $814/yr
- HOA
- −$0
- Vacancy / Maint / Mgmt
- −$682
- Net cashflow
- $1,332
Break-even live
UW: 25.0% down · 7.5% · 30yr · 1.5% tax · 5.0% vac · 8.0% maint · 8.0% mgmt
Financing live
Cash to close
- Down payment
- $49,750
- Closing costs
- $5,970
- Reserves months
- —
- Total cash needed
- —
Loan-product check · same deal, 3 products live
Conventional
25% down · 7.5% · 30yr
- Down + closing
- —
- Monthly P&I
- —
- Monthly cashflow
- —
- DSCR
- —
- Eligible?
- —
Personal DTI + credit; lowest rate.
DSCR
20% down · 8.5% · 30yr
- Down + closing
- —
- Monthly P&I
- —
- Monthly cashflow
- —
- DSCR
- —
- Eligible?
- —
No personal income docs; deal must DSCR.
Hard money
10% down · 12.0% · 12mo
- Down + closing
- —
- Monthly P&I
- —
- Monthly cashflow
- —
- DSCR
- —
- Eligible?
- —
Short-term bridge; refi at stabilization.
Listing history 11 events
-
2026-06-18days on market $199,000 Active 15 DOM
-
2026-06-17days on market $199,000 Active 14 DOM
-
2026-06-16days on market $199,000 Active 13 DOM
-
2026-06-15days on market $199,000 Active 12 DOM
-
2026-06-13days on market $199,000 Active 10 DOM
-
2026-06-13days on market $199,000 Active 9 DOM
-
2026-06-09days on market $199,000 Active 6 DOM
-
2026-06-08days on market $199,000 Active 5 DOM
-
2026-06-07days on market $199,000 Active 4 DOM
-
2026-06-04remarks 476-char remark
-
2026-06-04$199,000 Active 1 DOM
ⓘ Source: listings_history table (triggers on properties + properties_extension) + one-shot
backfill from property_details.listing_events for pre-trigger history.
Tax reassessment forecast CA · Resets to sale price
- Current annual tax
- $480 · $40/mo
- Projected year-2 tax
- $1,512 · $126/mo
- Expected delta
- +$1,033/yr (+$86/mo · 215.4%)
ⓘ Screening estimate from a state-policy table — verify with the county assessor before closing.
Climate risk First Street
- Flood 9/10 Extreme FEMA zone D · 99% chance over 30 yrs
- Wildfire 10/10 Extreme
- Heat 5/10 Major 8 d/yr ≥96°F today · 22 d/yr by 30 yrs out
- Wind 1/10 Low
- Air quality 7/10 Severe 15 unhealthy d/yr today · 18 by 30 yrs out
Nearby sold comps map
Loading sold comps map…
Walkable amenities ~0.75 mi
Loading nearby amenities…
Taxation est. · year 1
- Rental income
- $38,979
- − Mortgage interest
- −$11,147
- − Property taxes
- −$480
- − Insurance
- −$1,809
- − Repairs & maintenance
- −$3,118
- − Management
- −$3,118
- − Depreciation
- −$5,789
- Taxable income
- $13,518
- Est. tax owed @ 24.0%
- −$3,244
- After-tax cash flow
- $12,738/yr
For passive investors: Depreciation is non-cash, so a rental often shows a tax loss while cash-flowing — sheltering income. Rental losses are passive: they offset passive income freely, and up to $25,000/yr can offset ordinary (W-2) income if you actively participate and your MAGI is under $100k (phasing out to $0 by $150k); unused losses carry forward. On sale, claimed depreciation is recaptured at up to 25%, and gains may owe capital-gains tax (a 1031 exchange can defer both). Figures are a year-1 estimate at your 24.0% rate — not tax advice; consult a CPA.
Condition & rehab AI · 12 photos
This newly renovated home in Paradise Ranch Community is move-in ready with fresh exterior paint, new flooring, and updated bathrooms. It offers a great location with mountain views and park amenities.
Value-add opportunities
- Both landscaping — enhances curb appeal and adds value
- Both interior paint touch-ups — fresh paint enhances curb appeal and interior aesthetics
- Both exterior paint touch-ups — fresh paint enhances curb appeal and exterior aesthetics
Renovation cost estimate screening
Value-add ROI direction
- Both landscaping — enhances curb appeal and adds value ↑
- Both interior paint touch-ups — fresh paint enhances curb appeal and interior aesthetics ↑
- Both exterior paint touch-ups — fresh paint enhances curb appeal and exterior aesthetics ↑
ⓘ Cost ranges are severity-bucket heuristics (US national rule-of-thumb). Get contractor quotes + a written scope before underwriting a rehab budget.
Schools (NCES district)
- District
- William S. Hart Union High
- NCES district ID
- 0642510
- Math proficiency
- 52% ▬ 0.00%
- Reading proficiency
- 72% ▲ 1.00%
- Median HH income
- $95,844
- Composite
- 58.6/100
- National rank
- #2030
- State rank
- #155 of 1400 in CA
Livability — Hasley Canyon
- Score
- 49/100
- State rank
- #1168
- US rank
- #25897
Category grades
Schools grade is shown separately in the Schools card above.
Census & demographics
- Population (ZIP)
- 27,278
Population outlook (Los Angeles County) Hauer SSP2
- Today (2025)
- 10,940,515 people
- By 2030
- 11,256,481 · +2.9%
- By 2040
- 11,729,929 · +7.2%
- By 2050
- 11,948,407 · +9.2%
- By 2075
- 11,818,114 · +8.0%
- By 2100
- 10,842,928 · -0.9%
Race, ethnicity, and origin ACS 2023
- Neighborhood character
- Diverse neighborhood (Simpson 0.67)
- Race & ethnicity
- Hispanic / Latino 43% White 37% Two or more races 22% Asian 9% Black 5% Native American 1%
- Hispanic origin (detail)
- Mexican 31%
- Common ancestry
- Italian 3% Lithuanian 2% Portuguese 2%
- Foreign-born
- 20% · Canada, South Korea, China
- Languages at home
- 62% English-only · Spanish 29% Other Indo-European 2% Tagalog/Filipino 2%
Political lean MEDSL · Los Angeles
- 2024 margin
- Solid D (+32.9) · D 64.8% · R 31.9% · Other 3.3%
- 2008→2024 swing
- -7.4pp toward R · 2008: 40.4pp · 2024: 32.9pp
- All cycles
- 2024: D+32.9 2020: D+44.2 2016: D+48.0 2012: D+40.0 2008: D+40.4
Not yet ingested
- Civics
- —
Market trends
- HPI YoY
- ▼ -126.54%
- Current HPI
- 319.9021
- Rent YoY
- —
- Metro
- —
- State GDP YoY
- ▲ 3.21%
- F500 in state
- 116
Industry mix (Fortune 500 HQ in CA)
| Industry | F500 HQs | Revenue |
|---|---|---|
| Technology | 27 | $1,492B |
|
||
| Financial Services | 3 | $174B |
|
||
| Retail | 3 | $44B |
|
||
| Insurance | 3 | $26B |
|
||
| Media / Entertainment | 2 | $115B |
|
||
| Pharmaceuticals / Biotech | 2 | $62B |
|
||
Price history
+10.6% since first listed5 events — show timeline
- 2026-05-27 Listed $199,000 AVMLS
- 2026-03-11 Sold (MLS) $40,000 CRMLS
- 2026-02-02 Contingent — CRMLS
- 2025-08-04 Listed $180,000 CRMLS
- 2025-08-02 Coming Soon $180,000 CRMLS
Property tax history
+6.0%/yrLatest (2025): $480 · +6.0% YoY. Source: county tax records.
Cash-flow waterfall
monthlySold comps — $/sqft
last 12 mo · ≤1 miLoading sold comps…