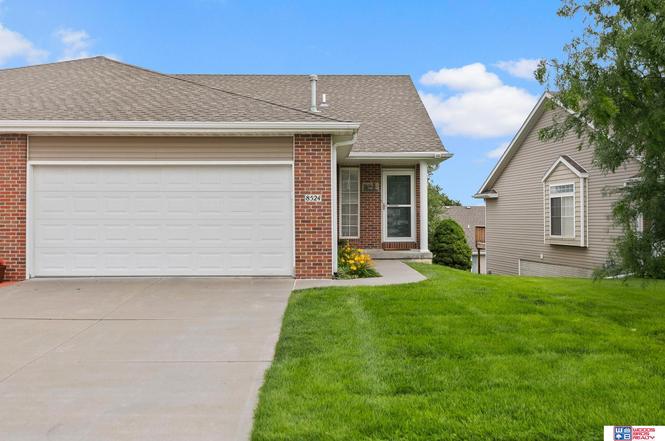
8524 Ridge Hollow Dr · Lincoln, NE
Flood risk 1/10 · Minimal
- FEMA flood zone
- X (unshaded)
- Chance of flooding over 30 yrs
- 0.0%
- Est. flood insurance / yr
- $473 – $860
Fire risk 4/10 · Minor
- Est. fire insurance / yr
- $1,161 – $2,155
Heat risk 3/10 · Minor
- Hot days now (above 105°F)
- 7 days/yr
- Hot days in 30 yrs
- 16 days/yr
Wind risk 2/10 · Minimal
- Chance of severe wind over 30 yrs
- —
Air-quality risk 1/10 · Minimal
- Unhealthy air days now
- 0 days/yr
- Unhealthy air days in 30 yrs
- 0 days/yr
Risk factors via First Street. Map © Google.
Why this score? — see what drove the D grade
The composite is a weighted blend of 9 inputs, each scored 0–100. Each bar is that input's sub-score; the figure is the points it added to the 100-point composite (weight × sub-score).
- ARV discount +11.9/15.0
- Appreciation +6.4/10.0
- Cash flow +6.2/30.0
- Schools +4.4/10.0
- Livability +4.2/5.0
- Condition / age +2.5/5.0
- 1% rule +2.2/10.0
- Rent growth +1.7/5.0
- DSCR +0.5/10.0
$290,000
🖨 Deal sheet (PDF) 📄 Offer letter ✓ Due diligence
Listing remarks MLS
Walk out Basement. 1200 sq ft 2 bedroom, 2 bath, 2 car garage BRAND NEW and with GRANITE countertops AND CLEAN STEEL APPLIANCES! Includes Refrigerator with ice and water in door, smooth top range, Spacesaver microwave, dishwasher AND includes extra large capacity stackable washer and dryer! Everything you need! Just move in!
Key facts
- Private deck
- Open floor plan
- Walkout basement
Tags
Property features AI
Finance
- HOA & community: Part of Yankee Hill Townhomes association; Monthly association fee of $175; Association covers grounds maintenance, snow removal, common area maintenance and trash
Exterior
- Parking: Attached 2-car garage; Two covered parking spaces
- Utilities: Public water; Public sewer
- Home design: Residential townhouse; Attached property; Not new / not a model; Below-grade finished area included (approximately 750 finished below grade); Above-grade finished area approximately 1,200
- Construction: Built in 2011; Composition roof; Concrete perimeter foundation
- Exterior features: Covered patio and porch; Wood fencing; City lot up to 1/4 acre (approximately 0.12 acres); Lot dimensions approximately 35 x 128 x 39 x 128
Interior
- Kitchen: Kitchen on main floor (10 x 14)
- Bedrooms: Main floor primary bedroom (13 x 13); Main floor secondary bedroom (11 x 13); Basement bedroom
- Bathrooms: Three total bathrooms: one full bath and two 3/4 baths; Two bathrooms on the main level
- Heating & cooling: Natural gas forced-air heating; Central air conditioning
- Interior features: Walk-out basement; No fireplaces
Neighborhood map
What this means for you Summary
Snapshot
- This is a 2-bed/4.0-bath townhouse listed at $290k.
Deal economics
- At list price, monthly cash flow is $-525 ($-6k/yr) — negative.
- To cash-flow at today's rent, offer at most $197k (32.0% below list).
- To meet the 1% rule (rent ≥ 1% of price), the offer needs to be $209k (28.0% below list).
- Recommended offer: $197k (32.0% below list) — sets the bar for cash-flow.
- Cap rate 4.1% vs local median 3.0% in Lincoln — top-decile yield for the area; either an underpriced asset or a hidden risk that comps aren't pricing in. Stress-test before assuming the spread holds.
Location & tenants
- Location reads 85/100 on livability (#5 in NE, #545 nationally) — a professional / high-income tenant draw. Strengths: amenities A+, cost of living A+, housing A+; Watch: crime D+.
- Lincoln Public Schools (urban): math 50% / reading 53% proficiency, ranked #59 of 111 in NE (top 53%) — acceptable for families but not a draw, mixed tenant base, ~2y average lease.
- Zoned schools: Maxey Elementary School (math 69% / reading 70%, grade A-, #39 of 502 statewide, top 11%, 688 students, 19% FRL); Moore Middle School (math 78% / reading 69%, grade A, #4 of 128 statewide, top 2%, 738 students, 10% FRL); Lincoln Southeast High School (math 51% / reading 52%, grade D+, #105 of 261 statewide, top 40%, 1,929 students, 16% FRL) — zoned schools average 15% FRL vs 37% district-wide (22 pts lower); this property's tenant base skews higher-income than the district average.
- Zoned-school proficiency averages 65% at this address vs 52% district-wide (+13 pts) — the actual schools serving this property are materially stronger than the Lincoln Public Schools average implies; a family-tenant draw the district grade alone would hide.
- Market conditions: Rents falling (-3.0%/yr); 147 active listings in the ZIP; 6 comparable units currently listed for rent nearby; rentals at typical pace (median 16d on market — plan ~3-4 weeks tenant-placement turnaround); high-income renter base; 1,940 units permitted in Lancaster County in 2024 (895 in 5+ unit buildings).
Forward outlook
- In year one you build about $10k of equity ($2k loan paydown + $8k appreciation (2.8% local appreciation)).
- Lancaster County population projected at +37% by 2050 — long-run rental-demand tailwind backs the buy-and-hold thesis.
- By year 4, paydown + projected appreciation supports a ~$34k cash-out refi (75% LTV) — recoverable capital for the next deal without selling this one.
Negotiation context
- Only 3 days on market — expect competitive offers; lowballing is unlikely to land.
- 2 sale attempts since 15y ago with the ask held roughly flat each time — persistent listings suggest the price (not the market) is what's stuck; bring a comps-based counter.
- Current owner paid $147k; list at $290k implies a 97% gain — meaningful room to come down on a strong offer.
Questions for the listing agent
- What do current leases actually rent for vs. the listed asking? Can we see a recent rent roll and the last 12 months of T-12 income?
- What does the HOA fee cover, when was the last increase, and are there any pending special assessments or reserve-fund shortfalls?
- Is there a deadline driving the sale (1031 exchange, divorce, estate, relocation)? That informs how much negotiation room exists.
- Schools are A-rated — typically a magnet for longer-tenancy family renters. What's the average tenant stay here, and is there a school-zone premium baked into asking?
- Crime grade is D in this area — have there been break-ins, vandalism, or insurance claims at this property in the last 3 years? What carrier currently insures it and at what premium?
- The area grade is low — what's the realistic commute time and amenity access for the typical tenant pool here? Any planned neighborhood developments (good or bad) we should know about?
- What's the average days-on-market for RENTAL listings here right now (not sales)? A rising rental-DOM trend means longer vacancies and softer asking-rent achievability than the comps imply.
- What's the recent tenant-quality profile in this submarket — average credit score on applications, eviction rate, late-payment / NSF rate, and stable-employment percentage? A property-management company in the area should have these aggregated.
- How much new for-sale + rental construction is in the pipeline within 1–3 miles? Heavy new supply typically softens prices + rents 12–24 months out; constrained supply supports both.
Investment metrics
- 1% rule
- 0.72% ✗
- Cap rate
- 4.12%
- Cash-on-cash
- -7.76%
- DSCR
- 0.65
- GRM
- 11.6
CMA / ARV
- ARV (on-the-fly)
- $321,750
- Comps found
- 6
Show comp detail 6 sales within ~0.75 mi
| Address | Dist | Beds/Ba | Sqft | Sold | Price | $/sf | Match |
|---|---|---|---|---|---|---|---|
| 8323 Sutherland St | 0.11mi | 3/3.0 (+1) | 2,200 (+13%) | 11mo | $349,900 | $159 | 56 |
| 8821 Ridge Hollow Dr | 0.23mi | 3/1.5 (+1) | 1,739 (-11%) | 8mo | $287,000 | $165 | 49 |
| 8305 Flintlock St | 0.16mi | 3/2.5 (+1) | 1,700 (-13%) | 13mo | $270,000 | $159 | 49 |
| 8248 S 85th St | 0.10mi | 3/2.5 (+1) | 1,739 (-11%) | 22mo | $269,900 | $155 | 48 |
| 9716 S 89th Pl | 0.53mi | 3/3.0 (+1) | 2,173 (+11%) | 14mo | $387,999 | $179 | 36 |
| 9722 S 89th Pl | 0.53mi | 3/3.0 (+1) | 2,173 (+11%) | 15mo | $369,999 | $170 | 35 |
Match score weights: distance 35% · size 25% · config 20% · recency 20%. Top-matched comps best support the ARV.
Projected returns pro-forma
2.8% appreciation · 0.0% rent growth · sell at horizon
- IRR
- -1.6%
- Equity multiple
- 0.91×
- Total profit
- $-7,525
- Equity at exit
- $127,184
- IRR
- 1.4%
- Equity multiple
- 1.21×
- Total profit
- $16,921
- Equity at exit
- $193,544
Cash invested: $81,200 (down + closing). Projections, not guarantees.
Landlord ↔ Tenant lean methodology
- Overall (STATE)
- 83 Strongly Landlord-Friendly
- State Nebraska
- 83 Strongly Landlord-Friendly · R+13
- County
- — inherits STATE
- City
- — inherits STATE
ZIP-level market 68526
- Home prices YoY
- 1.1%
- Rents YoY
- -3.0%
- Active inventory
- 147
- Price-to-rent
- 11.6×
Monthly cashflow live
- Estimated rent
- $2,088 high interval (Pro) →
- Mortgage (P&I)
- −$1,521
- Tax from tax record
- −$358 /mo · $4,300/yr
- Insurance
- −$121
- HOA
- −$175
- Vacancy / Maint / Mgmt
- −$439
- Net cashflow
- $-525
Break-even live
Sensitivity live
| Price | -10% $-361 | -5% $-443 | +0% $-525 | +5% $-607 | +10% $-689 |
|---|---|---|---|---|---|
| Rent | -10% $-690 | -5% $-608 | +0% $-525 | +5% $-443 | +10% $-360 |
| Rate | -1.0pp $-379 | -0.5pp $-452 | base $-525 | +0.5pp $-600 | +1.0pp $-677 |
UW: 25.0% down · 7.5% · 30yr · 1.5% tax · 5.0% vac · 8.0% maint · 8.0% mgmt
Financing live
Cash to close
- Down payment
- $72,500
- Closing costs
- $8,700
- Reserves months
- —
- Total cash needed
- —
Loan-product check · same deal, 3 products live
Conventional
25% down · 7.5% · 30yr
- Down + closing
- —
- Monthly P&I
- —
- Monthly cashflow
- —
- DSCR
- —
- Eligible?
- —
Personal DTI + credit; lowest rate.
DSCR
20% down · 8.5% · 30yr
- Down + closing
- —
- Monthly P&I
- —
- Monthly cashflow
- —
- DSCR
- —
- Eligible?
- —
No personal income docs; deal must DSCR.
Hard money
10% down · 12.0% · 12mo
- Down + closing
- —
- Monthly P&I
- —
- Monthly cashflow
- —
- DSCR
- —
- Eligible?
- —
Short-term bridge; refi at stabilization.
Rent comps 6 comps
| Address | Beds | Baths | Sqft | Rent | $/sqft | DOM | Units | Dist |
|---|---|---|---|---|---|---|---|---|
| 7920 Patrick Ave Lincoln, NE | 3.0 | 2.0 | 1515 | $3,150 | $2.08 | 45d | 1 | 0.43mi |
| 8300 Renatta Dr Lincoln, NE | 1.0–3.0 | 1.0–2.0 | 979 | $1,715 | $1.75 | 15d | 18 | 0.52mi |
| 7210 S 89th St Lincoln, NE | 2.0 | 1.0–2.0 | 928 | $1,815 | $1.96 | 15d | 46 | 0.88mi |
| 8812 Bristlecone Dr Lincoln, NE | 2.0 | 2.5 | 1770 | $2,195 | $1.24 | 45d | 1 | 0.91mi |
| 9746 S 89th St Lincoln, NE | 3.0 | 3.0 | 2157 | $2,550 | $1.18 | 15d | 1 | 0.94mi |
| 9100 Heritage Lakes Dr Lincoln, NE | 3.0 | 1.0–2.0 | 953 | $1,600 | $1.68 | 15d | 18 | 1.05mi |
HOA detail
- Monthly dues
- $175 · $2,100/yr
- Likely covers
- water
Listing history 4 events
-
2026-06-15status $290,000 Pending 3 DOM
-
2026-06-15days on market $290,000 New 3 DOM
-
2026-06-14remarks 562-char remark
-
2026-06-14$290,000 New 1 DOM
ⓘ Source: listings_history table (triggers on properties + properties_extension) + one-shot
backfill from property_details.listing_events for pre-trigger history.
Tax reassessment forecast NE · Resets to sale price
- Current annual tax
- $4,300 · $358/mo
- Projected year-2 tax
- $5,017 · $418/mo
- Expected delta
- +$717/yr (+$60/mo · 16.7%)
ⓘ Screening estimate from a state-policy table — verify with the county assessor before closing.
Climate risk First Street
- Flood 1/10 Low FEMA zone X (unshaded) · 0% chance over 30 yrs
- Wildfire 4/10 Moderate
- Heat 3/10 Moderate 7 d/yr ≥105°F today · 16 d/yr by 30 yrs out
- Wind 2/10 Low
- Air quality 1/10 Low 0 unhealthy d/yr today · 0 by 30 yrs out
Nearby sold comps map
Loading sold comps map…
Walkable amenities ~0.75 mi
Loading nearby amenities…
Taxation est. · year 1
- Rental income
- $25,058
- − Mortgage interest
- −$16,245
- − Property taxes
- −$4,300
- − Insurance
- −$1,450
- − Repairs & maintenance
- −$2,005
- − Management
- −$2,005
- − HOA
- −$2,100
- − Depreciation
- −$8,436
- Taxable loss
- −$11,482
- Est. tax savings @ 24.0%
- +$2,756
- After-tax cash flow
- $-3,548/yr
For passive investors: Depreciation is non-cash, so a rental often shows a tax loss while cash-flowing — sheltering income. Rental losses are passive: they offset passive income freely, and up to $25,000/yr can offset ordinary (W-2) income if you actively participate and your MAGI is under $100k (phasing out to $0 by $150k); unused losses carry forward. On sale, claimed depreciation is recaptured at up to 25%, and gains may owe capital-gains tax (a 1031 exchange can defer both). Figures are a year-1 estimate at your 24.0% rate — not tax advice; consult a CPA.
Schools (NCES district)
- District
- Lincoln Public Schools
- NCES district ID
- 3172840
- Math proficiency
- 50% ▼ -6.00%
- Reading proficiency
- 53% ▼ -3.00%
- Median HH income
- $50,273
- Composite
- 44.05/100
- National rank
- #2880
- State rank
- #59 of 111 in NE
Livability — Lincoln
- Score
- 85/100
- State rank
- #5
- US rank
- #545
Category grades
Schools grade is shown separately in the Schools card above.
Census & demographics
- Census place
- Lincoln, NE
- County
- Lancaster County · 291,509 people
- City population
- 291,509
- Metro
- Lincoln, NE
- Population (ZIP)
- 7,944
- Household income
- $113,910
- Rent vs Own
- Severe rent burden
- 209.0
Population outlook (Lancaster County) Hauer SSP2
- Today (2025)
- 352,806 people
- By 2030
- 377,899 · +7.1%
- By 2040
- 428,582 · +21.5%
- By 2050
- 483,103 · +36.9%
- By 2075
- 632,390 · +79.2%
- By 2100
- 759,513 · +115.3%
Race, ethnicity, and origin ACS 2023
- Neighborhood character
- Predominantly White (88%)
- Race & ethnicity
- White 88% Hispanic / Latino 4% Two or more races 4% Asian 4%
- Common ancestry
- Slovak 4% Italian 2% Iranian 2%
- Foreign-born
- 5% · Canada, Vietnam, South Korea
- Languages at home
- 94% English-only · Spanish 2% Vietnamese 1% Other Indo-European 1%
Political lean MEDSL · Lancaster
- 2024 margin
- Toss-up / Even · D 51.4% · R 47.1% · Other 1.5%
- 2008→2024 swing
- -0.7pp no change · 2008: 5.0pp · 2024: 4.3pp
- All cycles
- 2024: D+4.3 2020: D+7.8 2016: D+0.1 2012: R+1.0 2008: D+5.0
Not yet ingested
- Civics
- —
Market trends
- HPI YoY
- ▲ 2.80%
- Current HPI
- 263.2041
- Rent YoY
- ▼ -3.02%
- Metro
- Lincoln, NE
- State GDP YoY
- ▲ 0.68%
- F500 in state
- 2
Industry mix (Fortune 500 HQ in NE)
| Industry | F500 HQs | Revenue |
|---|---|---|
| Conglomerate | 1 | $371B |
|
||
Price history
+97.4% since first listed4 events — show timeline
- 2026-06-12 Listed $290,000 GPRMLS
- 2011-12-28 Sold (MLS) $146,900 GPRMLS
- 2011-11-17 Listing Removed — GPRMLS
- 2011-11-01 Listed $146,900 GPRMLS
Property tax history
+5.0%/yrLatest (2022): $4,300 · -0.2% YoY. Source: county tax records.
Cash-flow waterfall
monthlySold comps — $/sqft
last 12 mo · ≤1 miLoading sold comps…