110 NW 67th Ave · Highfill, AR
Flood risk No data
- FEMA flood zone
- —
- Chance of flooding over 30 yrs
- —
- Est. flood insurance / yr
- —
Fire risk No data
- Est. fire insurance / yr
- —
Heat risk No data
- Hot days now (above threshold)
- —
- Hot days in 30 yrs
- —
Wind risk No data
- Chance of severe wind over 30 yrs
- —
Air-quality risk No data
- Unhealthy air days now
- —
- Unhealthy air days in 30 yrs
- —
Risk factors via First Street. Map © Google.
Why this score? — see what drove the D grade
The composite is a weighted blend of 9 inputs, each scored 0–100. Each bar is that input's sub-score; the figure is the points it added to the 100-point composite (weight × sub-score).
- Appreciation +10.0/10.0
- Cash flow +7.7/30.0
- ARV discount +7.5/15.0
- Schools +5.2/10.0
- Livability +3.4/5.0
- Rent growth +2.6/5.0
- Condition / age +2.5/5.0
- 1% rule +2.3/10.0
- DSCR +1.8/10.0
$222,900
🖨 Deal sheet 📄 Offer letter ✓ Due diligence
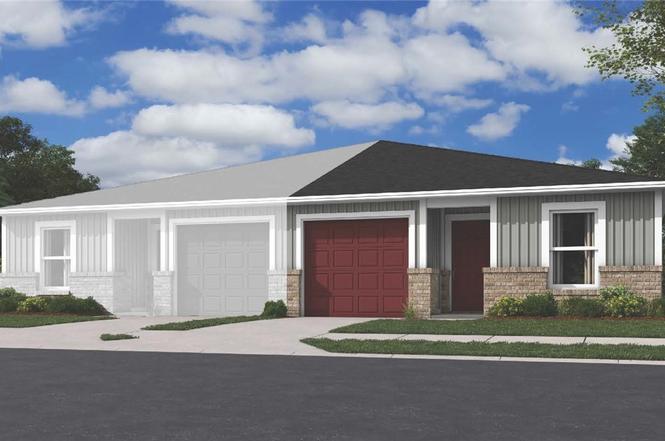
Listing remarks
Welcome to The Langford, a stunning duplex in a brand-new community! This modern 3-bedroom, 2-bath home boasts an inviting open floor plan, perfect for both relaxing and entertaining. The spacious kitchen features sleek appliances and ample counter space, seamlessly flowing into the bright living area. Retreat to the serene master suite, complete with a luxurious en-suite bathroom and a generous walk-in closet that offers plenty of storage. Two additional bedrooms provide flexibility for guests, a home office, or a growing family. Enjoy the convenience of a one-car garage and a charming backyard, ideal for outdoor gatherings. Located in a vibrant community with easy access to parks, shoppin
Key facts
- Master suite
- Open floor plan
- Bright living area
Tags
Neighborhood map
What this means for you Summary
Snapshot
- This is a 3-bed/2.0-bath land listed at $223k.
Deal economics
- At list price, monthly cash flow is $-261 ($-3k/yr) — negative.
- To cash-flow at today's rent, offer at most $185k (16.9% below list).
- To meet the 1% rule (rent ≥ 1% of price), the offer needs to be $162k (27.3% below list).
- Recommended offer: $162k (27.3% below list) — sets the bar for 1% rule.
- Cap rate 4.9% vs local median 2.9% in Highfill — top-decile yield for the area; either an underpriced asset or a hidden risk that comps aren't pricing in. Stress-test before assuming the spread holds.
Location & tenants
- Location reads 67/100 on livability (#97 in AR) — a middle-class / working-renter tenant base. Strengths: crime A+, employment A+, cost of living A+; Watch: schools F, amenities F, commute F.
- Bentonville School District (urban): math 59% / reading 59% proficiency, ranked #3 of 238 in AR (top 1%) — acceptable for families but not a draw, mixed tenant base, ~2y average lease.
- Market conditions: Rents flat; 690 active listings in the ZIP; 37 comparable units currently listed for rent nearby; rentals at typical pace (median 21d on market — plan ~3-4 weeks tenant-placement turnaround); high-income renter base; 4,359 units permitted in Benton County in 2024 (402 in 5+ unit buildings).
- This rent is only 16% of the median local income ($120k/yr) — well below the 30% rent-burden line; pricing power to push rent on renewal without tenant pushback.
Forward outlook
- In year one you build about $24k of equity ($2k loan paydown + $22k appreciation (10.0% local appreciation)).
- Benton County population projected at +56% by 2050 — long-run rental-demand tailwind backs the buy-and-hold thesis.
- By year 2, paydown + projected appreciation supports a ~$38k cash-out refi (75% LTV) — recoverable capital for the next deal without selling this one.
Negotiation context
- It's been on market 66 days — a 6% lower offer ($210k) is reasonable based on typical stale-listing flexibility.
- 2 sale attempts; this cycle's ask has dropped $16k (7%) from the opening price — seller is motivated, your offer sets the floor, not the list.
- Current owner paid $149k; 49% above their basis — modest negotiation headroom, anchor on the comps not their cost.
Questions for the listing agent
- What do current leases actually rent for vs. the listed asking? Can we see a recent rent roll and the last 12 months of T-12 income?
- It's been on market 66 days. Have you received any prior offers? Is the seller open to a 27% concession, seller financing, or rate buy-down credit?
- Why hasn't it sold? Are there any deal-killer items the seller is aware of (foundation, flood, title, zoning, code violations)?
- Is there a deadline driving the sale (1031 exchange, divorce, estate, relocation)? That informs how much negotiation room exists.
- Schools are F-rated, which usually means shorter tenancies and higher turnover. Who's the typical renter profile here, and what's been the actual vacancy rate?
- The area grade is low — what's the realistic commute time and amenity access for the typical tenant pool here? Any planned neighborhood developments (good or bad) we should know about?
- What's the average days-on-market for RENTAL listings here right now (not sales)? A rising rental-DOM trend means longer vacancies and softer asking-rent achievability than the comps imply.
- What's the recent tenant-quality profile in this submarket — average credit score on applications, eviction rate, late-payment / NSF rate, and stable-employment percentage? A property-management company in the area should have these aggregated.
- How much new for-sale + rental construction is in the pipeline within 1–3 miles? Heavy new supply typically softens prices + rents 12–24 months out; constrained supply supports both.
Investment metrics
- 1% rule
- 0.73% ✗
- Cap rate
- 4.89%
- Cash-on-cash
- -5.02%
- DSCR
- 0.78
- GRM
- 11.5
CMA / ARV
No comps found within radius.
Projected returns pro-forma
10.0% appreciation · 0.39% rent growth · sell at horizon
- IRR
- 20.0%
- Equity multiple
- 2.61×
- Total profit
- $100,661
- Equity at exit
- $200,806
- IRR
- 17.8%
- Equity multiple
- 5.84×
- Total profit
- $301,998
- Equity at exit
- $433,046
Cash invested: $62,412 (down + closing). Projections, not guarantees.
Landlord ↔ Tenant lean methodology
- Overall (STATE)
- 92 Strongly Landlord-Friendly
- State Arkansas
- 92 Strongly Landlord-Friendly · R+14
- County
- — inherits STATE
- City
- — inherits STATE
ZIP-level market 72713
- Home prices YoY
- 3.5%
- Rents YoY
- 0.4%
- Active inventory
- 690
- Price-to-rent
- 11.5×
Monthly cashflow live
- Estimated rent
- $1,620 high interval (Pro) →
- Mortgage (P&I)
- −$1,169
- Tax est. 1.5%
- −$279 /mo · $3,344/yr
- Insurance
- −$93
- HOA
- −$0
- Vacancy / Maint / Mgmt
- −$340
- Net cashflow
- $-261
Break-even live
UW: 25.0% down · 7.5% · 30yr · 1.5% tax · 5.0% vac · 8.0% maint · 8.0% mgmt
Financing live
Cash to close
- Down payment
- $55,725
- Closing costs
- $6,687
- Reserves months
- —
- Total cash needed
- —
Loan-product check · same deal, 3 products live
Conventional
25% down · 7.5% · 30yr
- Down + closing
- —
- Monthly P&I
- —
- Monthly cashflow
- —
- DSCR
- —
- Eligible?
- —
Personal DTI + credit; lowest rate.
DSCR
20% down · 8.5% · 30yr
- Down + closing
- —
- Monthly P&I
- —
- Monthly cashflow
- —
- DSCR
- —
- Eligible?
- —
No personal income docs; deal must DSCR.
Hard money
10% down · 12.0% · 12mo
- Down + closing
- —
- Monthly P&I
- —
- Monthly cashflow
- —
- DSCR
- —
- Eligible?
- —
Short-term bridge; refi at stabilization.
Rent comps 37 comps
| Address | Beds | Baths | Sqft | Rent | $/sqft | DOM | Units | Dist |
|---|---|---|---|---|---|---|---|---|
| 210 NW 67th Ave Bentonville, AR | 4.0 | 2.0 | 1454 | $1,595 | $1.10 | 14d | 1 | 0.08mi |
| 6503 NW Kathleen St Bentonville, AR | 3.0 | 2.0 | 1256 | $1,495 | $1.19 | 23d | 1 | 0.11mi |
| 6502 NW Kathleen St Bentonville, AR | 3.0 | 2.0 | 1250 | $1,495 | $1.20 | 23d | 1 | 0.12mi |
| 6500 NW Kathleen St Bentonville, AR | 3.0 | 2.0 | 1250 | $1,450 | $1.16 | 23d | 1 | 0.13mi |
| 6608 NW Vandergriff St Highfill, AR | 4.0 | 2.0 | 1454 | $1,595 | $1.10 | 14d | 1 | 0.16mi |
| 6307 NW Kathleen St Bentonville, AR | 3.0 | 2.0 | 1256 | $1,495 | $1.19 | 23d | 1 | 0.17mi |
| 6605 NW Vandergriff St Bentonville, AR | 4.0 | 2.0 | 1454 | $1,595 | $1.10 | 14d | 1 | 0.19mi |
| 111 NW 63rd Ave Bentonville, AR | 2.0–4.0 | 2.0 | 1116 | $1,610 | $1.44 | 14d | 19 | 0.21mi |
| 6600 NW Altus St Highfill, AR | 4.0 | 2.0 | 1454 | $1,595 | $1.10 | 14d | 1 | 0.22mi |
| 6619 NW Altus St Bentonville, AR | 3.0 | 2.0 | 1256 | $1,495 | $1.19 | 23d | 1 | 0.23mi |
| 6607 NW Altus St Bentonville, AR | 3.0 | 2.0 | 1256 | $1,450 | $1.15 | 23d | 1 | 0.24mi |
| 6603 NW Altus St Bentonville, AR | 3.0 | 2.0 | 1251 | $1,495 | $1.20 | 23d | 1 | 0.25mi |
| 313 NW 65th Ave Bentonville, AR | 3.0 | 2.0 | 1250 | $1,450 | $1.16 | 23d | 1 | 0.26mi |
| 500 NW 69th Ave Bentonville, AR | 3.0 | 2.0 | 1300 | $1,395 | $1.07 | 21d | 1 | 0.53mi |
| 500 NW 69th Ave Bentonville, AR | 3.0 | 2.0 | 1300 | $1,445 | $1.11 | 14d | 8 | 0.53mi |
| 6810 NW Trevy St Bentonville, AR | 3.0 | 2.0 | 1300 | $1,495 | $1.15 | 14d | 1 | 0.55mi |
| 6005 NW Hoover St Bentonville, AR | 4.0 | 2.0 | 1433 | $1,595 | $1.11 | 14d | 1 | 0.56mi |
| 521 NW 69th Ave Bentonville, AR | 3.0 | 2.0 | 1300 | $1,450 | $1.12 | 23d | 1 | 0.60mi |
| 523 NW 69th Ave Highfill, AR | 3.0 | 2.0 | 1300 | $1,495 | $1.15 | 14d | 1 | 0.61mi |
| 525 NW 69th Ave Bentonville, AR | 3.0 | 2.0 | 1300 | $1,495 | $1.15 | 14d | 1 | 0.61mi |
| 523 NW 68th Ave Bentonville, AR | 3.0 | 2.0 | 1300 | $1,495 | $1.15 | 14d | 1 | 0.61mi |
| 500 NW 69th Ave Unit 6812 Bentonville, AR | 3.0 | 2.0 | 1300 | $1,495 | $1.15 | 21d | 1 | 0.63mi |
| 500 NW 69th Ave Unit 6810 Bentonville, AR | 3.0 | 2.0 | 1300 | $1,450 | $1.12 | 23d | 1 | 0.63mi |
| 535 NW 69th Ave Bentonville, AR | 3.0 | 2.0 | 1300 | $1,495 | $1.15 | 21d | 1 | 0.64mi |
| 511 NW 68th Ave Bentonville, AR | 3.0 | 2.0 | 1300 | $1,495 | $1.15 | 21d | 1 | 0.65mi |
| 613 NW 69th Ave Bentonville, AR | 3.0 | 2.0 | 1300 | $1,495 | $1.15 | 14d | 1 | 0.69mi |
| 615 NW 69th Ave Highfill, AR | 3.0 | 2.0 | 1300 | $1,450 | $1.12 | 23d | 1 | 0.70mi |
| 617 NW 69th Ave Bentonville, AR | 3.0 | 2.0 | 1300 | $1,450 | $1.12 | 23d | 1 | 0.70mi |
| 6807 NW Toby St Bentonville, AR | 3.0 | 2.0 | 1300 | $1,495 | $1.15 | 14d | 1 | 0.74mi |
| 6813 NW Toby St Bentonville, AR | 3.0 | 2.0 | 1300 | $1,495 | $1.15 | 14d | 1 | 0.76mi |
| 632 NW 69th Ave Bentonville, AR | 3.0 | 2.0 | 1300 | $1,395 | $1.07 | 23d | 1 | 0.76mi |
| 514 NW 69th Ave Bentonville, AR | 3.0 | 2.0 | 1300 | $1,395 | $1.07 | 23d | 1 | 0.79mi |
| 6103 NW McClellen St Bentonville, AR | 4.0 | 2.0 | 1433 | $1,795 | $1.25 | 23d | 1 | 0.82mi |
| 864 NW Evans Cir Bentonville, AR | 4.0 | 2.0 | 1497 | $1,650 | $1.10 | 23d | 1 | 0.87mi |
| 817 NW 67th Ave Bentonville, AR | 3.0 | 2.0 | 1311 | $1,595 | $1.22 | 23d | 1 | 0.95mi |
| 7806 SW Blue Jay Ln Bentonville, AR | 1.0–2.0 | 1.0–2.0 | 850 | $1,215 | $1.43 | 14d | 6 | 1.40mi |
| 7806 SW Aviator Ave Bentonville, AR | 1.0–3.0 | 1.0–2.0 | 1009 | $1,550 | $1.54 | 14d | 19 | 1.42mi |
Listing history 9 events
-
2026-04-22status Pending
-
2026-04-20status Active
-
2026-04-20price $222,900
-
2026-03-04status Pending
-
2026-02-19price $232,450
-
2026-01-15price $230,450
-
2026-01-08price $228,500
-
2025-12-30$238,400 Active
-
2025-11-19soldstatus $149,378
ⓘ Source: listings_history table (triggers on properties + properties_extension) + one-shot
backfill from property_details.listing_events for pre-trigger history.
Nearby sold comps map
Loading sold comps map…
Walkable amenities ~0.75 mi
Loading nearby amenities…
Taxation est. · year 1
- Rental income
- $19,436
- − Mortgage interest
- −$12,486
- − Property taxes
- −$3,344
- − Insurance
- −$1,114
- − Repairs & maintenance
- −$1,555
- − Management
- −$1,555
- − Depreciation
- −$6,484
- Taxable loss
- −$7,102
- Est. tax savings @ 24.0%
- +$1,704
- After-tax cash flow
- $-1,426/yr
For passive investors: Depreciation is non-cash, so a rental often shows a tax loss while cash-flowing — sheltering income. Rental losses are passive: they offset passive income freely, and up to $25,000/yr can offset ordinary (W-2) income if you actively participate and your MAGI is under $100k (phasing out to $0 by $150k); unused losses carry forward. On sale, claimed depreciation is recaptured at up to 25%, and gains may owe capital-gains tax (a 1031 exchange can defer both). Figures are a year-1 estimate at your 24.0% rate — not tax advice; consult a CPA.
Schools (NCES district)
- District
- Bentonville School District
- NCES district ID
- 0503060
- Math proficiency
- 59% ▼ -8.00%
- Reading proficiency
- 59% ▼ -6.00%
- Median HH income
- $66,721
- Composite
- 51.85/100
- National rank
- #1661
- State rank
- #3 of 238 in AR
Livability — Highfill
- Score
- 67/100
- State rank
- #97
- US rank
- #10302
Category grades
Schools grade is shown separately in the Schools card above.
Census & demographics
- Census place
- Highfill, AR
- County
- Benton County · 259,241 people
- Metro
- Fayetteville-Springdale-Rogers, AR
- Population (ZIP)
- 28,999
- Household income
- $119,853
- Rent vs Own
- Severe rent burden
- 508.0
Population outlook (Benton County) Hauer SSP2
- Today (2025)
- 318,683 people
- By 2030
- 353,481 · +10.9%
- By 2040
- 425,280 · +33.4%
- By 2050
- 497,239 · +56.0%
- By 2075
- 662,114 · +107.8%
- By 2100
- 776,431 · +143.6%
Race, ethnicity, and origin ACS 2023
- Neighborhood character
- Diverse neighborhood (Simpson 0.66)
- Race & ethnicity
- White 54% Asian 20% Two or more races 16% Hispanic / Latino 11% Black 3%
- Hispanic origin (detail)
- Mexican 8%
- Common ancestry
- Italian 2% Slovak 2% Romanian 1%
- Foreign-born
- 22% · Canada, China, Vietnam
- Languages at home
- 79% English-only · Other Asian/Pacific 8% Spanish 6% Other Indo-European 5%
Political lean MEDSL · Benton
- 2024 margin
- Strong R (+27.0) · D 35.2% · R 62.1% · Other 2.7%
- 2008→2024 swing
- +9.6pp toward D · 2008: -36.5pp · 2024: -27.0pp
- All cycles
- 2024: R+27.0 2020: R+26.4 2016: R+34.9 2012: R+40.4 2008: R+36.5
Not yet ingested
- Civics
- —
Market trends
- HPI YoY
- ▲ 10.77%
- Current HPI
- 319.3081
- Rent YoY
- ▲ 0.39%
- Metro
- Fayetteville-Springdale-Rogers, AR
- State GDP YoY
- ▲ 3.80%
- F500 in state
- 10
Industry mix (Fortune 500 HQ in AR)
| Industry | F500 HQs | Revenue |
|---|---|---|
| Retail | 1 | $681B |
|
||
| Food / Agriculture | 1 | $53B |
|
||
| Retail / Energy | 1 | $22B |
|
||
| Transportation / Logistics | 1 | $12B |
|
||
| Energy | 1 | $4B |
|
||
Price history
+49.2% since first listed9 events — show timeline
- 2026-04-22 Pending — NWARMLS
- 2026-04-20 Relisted — NWARMLS
- 2026-04-20 Price Changed $222,900 NWARMLS
- 2026-03-04 Pending — NWARMLS
- 2026-02-19 Price Changed $232,450 NWARMLS
- 2026-01-15 Price Changed $230,450 NWARMLS
- 2026-01-08 Price Changed $228,500 NWARMLS
- 2025-12-30 Listed $238,400 NWARMLS
- 2025-11-19 Sold (Public Records) $149,378 Public Records
Property tax history
+1.3%/yrLatest (2025): $369 · +1.3% YoY. Source: county tax records.
Cash-flow waterfall
monthlySold comps — $/sqft
last 12 mo · ≤1 miLoading sold comps…