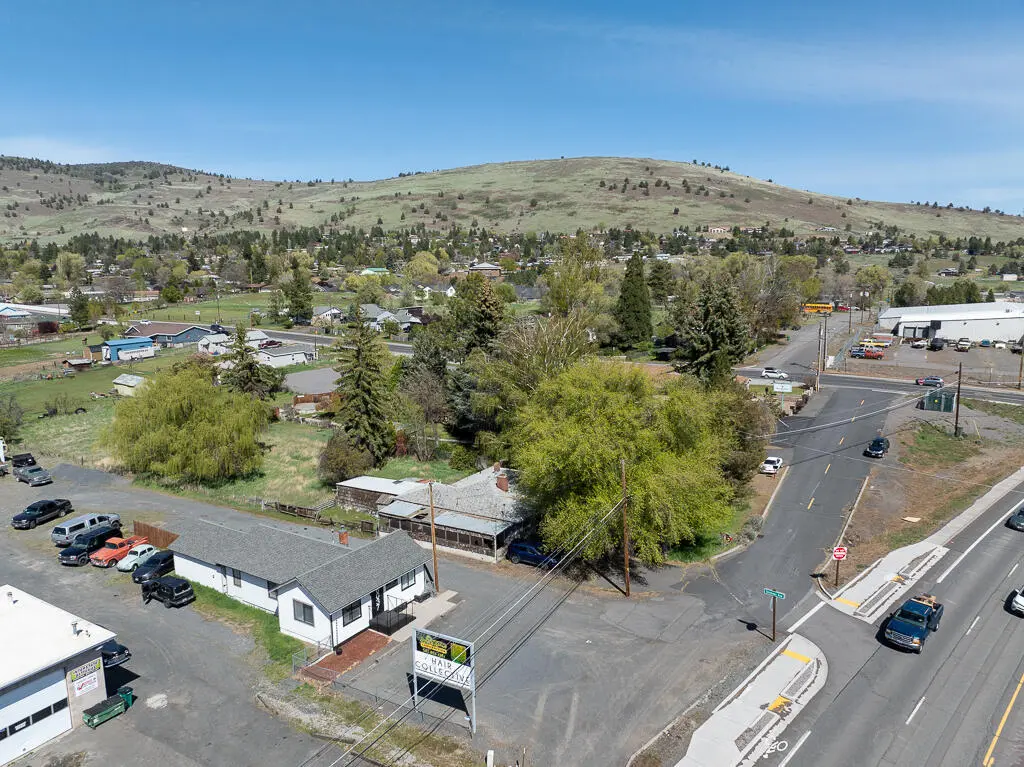
6039 S 6th St · Altamont, OR
Flood risk 1/10 · Minimal
- FEMA flood zone
- X
- Chance of flooding over 30 yrs
- 0.0%
- Est. flood insurance / yr
- $507 – $1,088
Fire risk 6/10 · Moderate
- Est. fire insurance / yr
- $498 – $926
Heat risk 3/10 · Minor
- Hot days now (above 90°F)
- 8 days/yr
- Hot days in 30 yrs
- 19 days/yr
Wind risk 1/10 · Minimal
- Chance of severe wind over 30 yrs
- —
Air-quality risk 10/10 · Severe
- Unhealthy air days now
- 38 days/yr
- Unhealthy air days in 30 yrs
- 39 days/yr
Risk factors via First Street. Map © Google.
Why this score? — see what drove the B- grade
The composite is a weighted blend of 9 inputs, each scored 0–100. Each bar is that input's sub-score; the figure is the points it added to the 100-point composite (weight × sub-score).
- Cash flow +30.0/30.0
- DSCR +10.0/10.0
- 1% rule +8.9/10.0
- ARV discount +7.5/15.0
- Rent growth +3.5/5.0
- Livability +3.2/5.0
- Schools +2.5/10.0
- Condition / age +2.5/5.0
- Appreciation +0.0/10.0
$110,000
🖨 Deal sheet 📄 Offer letter ✓ Due diligence
Listing remarks MLS
This Listing Consists Of Two Tax Parcels. The Front Parcel, R-3909-001bc-01300-000, Is 0.27 Acres Zoned Cg With A Three Bedroom One Bath House Located On The Property. The Adjoining Back Parcel, R-3909-001bc-01200-000, Is Also 0.27 Acres And Is Zoned Rs. Exposure To South 6th Street, Which Is A Main Thoroughfare Through Town. Lots Of Possibilities For This Property. Buyer To Do Due Diligence On Uses Allowed For The Property.
Key facts
- Zoned cg
- Zoned residential
- 0.28 acre lot
Tags
Neighborhood map
What this means for you Summary
Snapshot
- This is a 3-bed/1.0-bath single-family listed at $110k.
Deal economics
- At list price, monthly cash flow is $450 ($5k/yr) — positive.
- The deal already cash-flows at list — no discount required.
- Meets the 1% rule at list price ($2k rent vs $110k).
- Cap rate 11.2% vs local median 3.7% in Altamont — top-decile yield for the area; either an underpriced asset or a hidden risk that comps aren't pricing in. Stress-test before assuming the spread holds.
Location & tenants
- Location reads 65/100 on livability (#195 in OR) — a middle-class / working-renter tenant base. Strengths: cost of living A+, housing A+; Watch: health & safety C-, employment D, crime F.
- Klamath County SD (rural): math 21% / reading 37% proficiency, ranked #46 of 58 in OR (top 79%) — low school quality limits family demand, transient renter base, plan for 1-2y turnover.
- Zoned schools: Shasta Elementary School (math 17% / reading 32%, grade F, #320 of 412 statewide, top 82%, 518 students, 73% FRL); Henley Middle School (math 22% / reading 47%, grade F, #61 of 128 statewide, top 54%, 419 students, 72% FRL); Henley High School (693 students, 73% FRL).
- Market conditions: Rents rising (+3.8%/yr); 263 active listings in the ZIP; 3 comparable units currently listed for rent nearby; rentals lingering (median 44d on market — plan ~5-8 weeks vacancy on turnover, expect pricing pressure); 100% of comp listings sitting > 30 days — soft ceiling on asking rent; 232 units permitted in Klamath County in 2024 (72 in 5+ unit buildings).
Forward outlook
- Local home prices are declining (-3.0%/yr); year-one equity from $761 of loan paydown is wiped out by about $3k of value loss. Plan a longer hold.
- Klamath County population projected at -12% by 2050 — secular population decline; favor cash flow + early exit over multi-decade hold.
- At projected returns (-3.0% appreciation + 3.8% rent growth), your $31k cash investment doubles in ~7 years — after that, you're playing with house money.
Negotiation context
- Only 3 days on market — expect competitive offers; lowballing is unlikely to land.
- 2 sale attempts since 11y ago with the ask held roughly flat each time — persistent listings suggest the price (not the market) is what's stuck; bring a comps-based counter.
- Current owner paid $55k; list at $110k implies a 100% gain — meaningful room to come down on a strong offer.
Risks & watch-outs
- Watch-outs: built in 1956 — expect roof / HVAC / electrical / plumbing capex.
- Climate carrying-cost: major wildfire risk — expect insurance premiums to compound above CPI over the hold.
Questions for the listing agent
- Built in 1956 — when were the roof, HVAC, electrical panel, plumbing, and water heater last replaced?
- Is there a deadline driving the sale (1031 exchange, divorce, estate, relocation)? That informs how much negotiation room exists.
- Crime grade is F in this area — have there been break-ins, vandalism, or insurance claims at this property in the last 3 years? What carrier currently insures it and at what premium?
- What's the average days-on-market for RENTAL listings here right now (not sales)? A rising rental-DOM trend means longer vacancies and softer asking-rent achievability than the comps imply.
- What's the recent tenant-quality profile in this submarket — average credit score on applications, eviction rate, late-payment / NSF rate, and stable-employment percentage? A property-management company in the area should have these aggregated.
- How much new for-sale + rental construction is in the pipeline within 1–3 miles? Heavy new supply typically softens prices + rents 12–24 months out; constrained supply supports both.
Investment metrics
- 1% rule
- 1.39% ✓
- Cap rate
- 11.20%
- Cash-on-cash
- 17.52%
- DSCR
- 1.78
- GRM
- 6.0
CMA / ARV
- ARV (on-the-fly)
- $353,625
- Comps found
- 12
Show comp detail 12 sales within ~0.75 mi
| Address | Dist | Beds/Ba | Sqft | Sold | Price | $/sf | Match |
|---|---|---|---|---|---|---|---|
| 6214 Bryant Ave | 0.31mi | 4/2.0 (+1) | 1,737 (+1%) | 7mo | $325,000 | $187 | 70 |
| 2774 Eastmount St | 0.37mi | 3/2.5 | 1,786 (+4%) | 10mo | $281,000 | $157 | 62 |
| 6316 Winema Way | 0.43mi | 3/2.0 | 1,758 (+2%) | 12mo | $380,000 | $216 | 62 |
| 5714 Schiesel Ave | 0.40mi | 3/1.5 | 1,522 (-12%) | 3mo | $312,000 | $205 | 58 |
| 6245 Climax Ave | 0.29mi | 3/2.0 | 1,484 (-14%) | 5mo | $349,900 | $236 | 55 |
| 2106 Dawn Dr | 0.52mi | 3/2.0 | 1,534 (-11%) | 6mo | $315,000 | $205 | 48 |
| 6515 Jesse Ct | 0.61mi | 3/2.5 | 1,842 (+7%) | 13mo | $455,000 | $247 | 43 |
| 5420 Maryland Ave | 0.63mi | 4/3.0 (+1) | 1,805 (+5%) | 8mo | $320,000 | $177 | 43 |
| 3219 Naoma St | 0.68mi | 3/2.0 | 1,536 (-11%) | 9mo | $310,000 | $202 | 39 |
| 3216 Raymond St | 0.67mi | 3/2.0 | 1,505 (-13%) | 12mo | $360,000 | $239 | 34 |
| 6216 Sage Way | 0.60mi | 3/3.0 | 1,978 (+15%) | 10mo | $382,500 | $193 | 32 |
| 6506 Sarah Cir | 0.68mi | 4/2.5 (+1) | 1,942 (+13%) | 6mo | $490,000 | $252 | 31 |
Match score weights: distance 35% · size 25% · config 20% · recency 20%. Top-matched comps best support the ARV.
Projected returns pro-forma
-3.0% appreciation · 3.8% rent growth · sell at horizon
- IRR
- 9.9%
- Equity multiple
- 1.39×
- Total profit
- $12,086
- Equity at exit
- $16,401
- IRR
- 19.6%
- Equity multiple
- 2.71×
- Total profit
- $52,686
- Equity at exit
- $9,511
Cash invested: $30,800 (down + closing). Projections, not guarantees.
Landlord ↔ Tenant lean methodology
- Overall (STATE)
- 28 Tenant-Leaning
- State Oregon
- 28 Tenant-Leaning · D+6
- County
- — inherits STATE
- City
- — inherits STATE
ZIP-level market 97603
- Rents YoY
- 3.8%
- Active inventory
- 263
- Price-to-rent
- 6.0×
Monthly cashflow live
- Estimated rent
- $1,532 medium interval (Pro) →
- Mortgage (P&I)
- −$577
- Tax est. 1.5%
- −$138 /mo · $1,650/yr
- Insurance
- −$46
- HOA
- −$0
- Vacancy / Maint / Mgmt
- −$322
- Net cashflow
- $450
Break-even live
UW: 25.0% down · 7.5% · 30yr · 1.5% tax · 5.0% vac · 8.0% maint · 8.0% mgmt
Financing live
Cash to close
- Down payment
- $27,500
- Closing costs
- $3,300
- Reserves months
- —
- Total cash needed
- —
Loan-product check · same deal, 3 products live
Conventional
25% down · 7.5% · 30yr
- Down + closing
- —
- Monthly P&I
- —
- Monthly cashflow
- —
- DSCR
- —
- Eligible?
- —
Personal DTI + credit; lowest rate.
DSCR
20% down · 8.5% · 30yr
- Down + closing
- —
- Monthly P&I
- —
- Monthly cashflow
- —
- DSCR
- —
- Eligible?
- —
No personal income docs; deal must DSCR.
Hard money
10% down · 12.0% · 12mo
- Down + closing
- —
- Monthly P&I
- —
- Monthly cashflow
- —
- DSCR
- —
- Eligible?
- —
Short-term bridge; refi at stabilization.
Rent comps 3 comps
| Address | Beds | Baths | Sqft | Rent | $/sqft | DOM | Units | Dist |
|---|---|---|---|---|---|---|---|---|
| 2439 Homedale Rd Klamath Falls, OR | 3.0 | 1.0 | 1320 | $1,400 | $1.06 | 43d | 1 | 0.46mi |
| 4170 Adelaide Ave Klamath Falls, OR | 2.0 | 1.5 | 1268 | $1,500 | $1.18 | 43d | 1 | 1.48mi |
| 4162 Marian Ct Unit 3 Klamath Falls, OR | 2.0 | 1.0 | 1150 | $1,250 | $1.09 | 43d | 1 | 1.49mi |
Listing history 4 events
-
2026-04-27status Pending
-
2026-04-24$110,000 Active
-
2016-01-29soldstatus $55,000 428-char remark
Show marketing remark (428 chars)
This Listing Consists Of Two Tax Parcels. The Front Parcel, R-3909-001bc-01300-000, Is 0.27 Acres Zoned Cg With A Three Bedroom One Bath House Located On The Property. The Adjoining Back Parcel, R-3909-001bc-01200-000, Is Also 0.27 Acres And Is Zoned Rs. Exposure To South 6th Street, Which Is A Main Thoroughfare Through Town. Lots Of Possibilities For This Property. Buyer To Do Due Diligence On Uses Allowed For The Property.
-
2015-12-31$55,000 428-char remark
Show marketing remark (428 chars)
This Listing Consists Of Two Tax Parcels. The Front Parcel, R-3909-001bc-01300-000, Is 0.27 Acres Zoned Cg With A Three Bedroom One Bath House Located On The Property. The Adjoining Back Parcel, R-3909-001bc-01200-000, Is Also 0.27 Acres And Is Zoned Rs. Exposure To South 6th Street, Which Is A Main Thoroughfare Through Town. Lots Of Possibilities For This Property. Buyer To Do Due Diligence On Uses Allowed For The Property.
ⓘ Source: listings_history table (triggers on properties + properties_extension) + one-shot
backfill from property_details.listing_events for pre-trigger history.
Climate risk First Street
- Flood 1/10 Low FEMA zone X · 0% chance over 30 yrs
- Wildfire 6/10 Major
- Heat 3/10 Moderate 8 d/yr ≥90°F today · 19 d/yr by 30 yrs out
- Wind 1/10 Low
- Air quality 10/10 Extreme 38 unhealthy d/yr today · 39 by 30 yrs out
Nearby sold comps map
Loading sold comps map…
Walkable amenities ~0.75 mi
Loading nearby amenities…
Taxation est. · year 1
- Rental income
- $18,379
- − Mortgage interest
- −$6,162
- − Property taxes
- −$1,650
- − Insurance
- −$550
- − Repairs & maintenance
- −$1,470
- − Management
- −$1,470
- − Depreciation
- −$3,200
- Taxable income
- $3,877
- Est. tax owed @ 24.0%
- −$930
- After-tax cash flow
- $4,467/yr
For passive investors: Depreciation is non-cash, so a rental often shows a tax loss while cash-flowing — sheltering income. Rental losses are passive: they offset passive income freely, and up to $25,000/yr can offset ordinary (W-2) income if you actively participate and your MAGI is under $100k (phasing out to $0 by $150k); unused losses carry forward. On sale, claimed depreciation is recaptured at up to 25%, and gains may owe capital-gains tax (a 1031 exchange can defer both). Figures are a year-1 estimate at your 24.0% rate — not tax advice; consult a CPA.
Schools (NCES district)
- District
- Klamath County SD
- NCES district ID
- 4107020
- Math proficiency
- 21% ▼ -17.00%
- Reading proficiency
- 37% ▼ -16.00%
- Median HH income
- $44,906
- Composite
- 24.83/100
- National rank
- #7593
- State rank
- #46 of 58 in OR
Livability — Altamont
- Score
- 65/100
- State rank
- #195
- US rank
- #12638
Category grades
Schools grade is shown separately in the Schools card above.
Census & demographics
- Census place
- Altamont, OR
- County
- Klamath County · 56,186 people
- Metro
- Klamath Falls, OR
- Population (ZIP)
- 33,222
- Household income
- $66,937
- Rent vs Own
- Severe rent burden
- 1147.0
Population outlook (Klamath County) Hauer SSP2
- Today (2025)
- 63,870 people
- By 2030
- 62,279 · -2.5%
- By 2040
- 58,891 · -7.8%
- By 2050
- 56,207 · -12.0%
- By 2075
- 51,239 · -19.8%
- By 2100
- 46,526 · -27.2%
Race, ethnicity, and origin ACS 2023
- Neighborhood character
- Predominantly White (73%)
- Race & ethnicity
- White 73% Hispanic / Latino 15% Two or more races 13% Native American 2%
- Hispanic origin (detail)
- Mexican 13%
- Common ancestry
- Portuguese 5% Italian 4% Lithuanian 3%
- Foreign-born
- 4% · Canada, China
- Languages at home
- 91% English-only · Spanish 7%
Political lean MEDSL · Klamath
- 2024 margin
- Solid R (+41.9) · D 27.9% · R 69.8% · Other 2.4%
- 2008→2024 swing
- -8.8pp toward R · 2008: -33.1pp · 2024: -41.9pp
- All cycles
- 2024: R+41.9 2020: R+40.6 2016: R+44.8 2012: R+38.2 2008: R+33.1
Not yet ingested
- Civics
- —
Market trends
- HPI YoY
- ▼ -122.75%
- Current HPI
- 198.1814
- Rent YoY
- ▲ 3.80%
- Metro
- Klamath Falls, OR
- State GDP YoY
- ▲ 2.05%
- F500 in state
- 2
Industry mix (Fortune 500 HQ in OR)
| Industry | F500 HQs | Revenue |
|---|---|---|
| Consumer Goods | 1 | $51B |
|
||
Price history
+100.0% since first listed4 events — show timeline
- 2026-04-27 Pending — MLSCO
- 2026-04-24 Listed $110,000 MLSCO
- 2016-01-29 Sold (MLS) $55,000 MLSCO
- 2015-12-31 Listed $55,000 MLSCO
Cash-flow waterfall
monthlySold comps — $/sqft
last 12 mo · ≤1 miLoading sold comps…