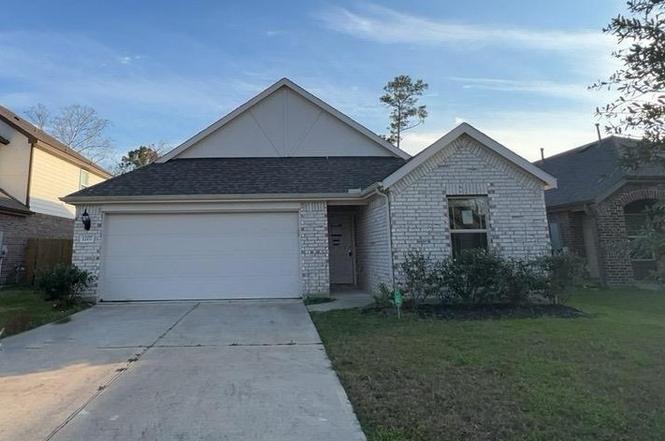
1207 Vilamoura Ct · Crosby, TX
Flood risk 1/10 · Minimal
- FEMA flood zone
- X (unshaded)
- Chance of flooding over 30 yrs
- 0.0%
- Est. flood insurance / yr
- $507 – $1,088
Fire risk 3/10 · Minor
- Est. fire insurance / yr
- $1,222 – $2,270
Heat risk 9/10 · Severe
- Hot days now (above 110°F)
- 7 days/yr
- Hot days in 30 yrs
- 24 days/yr
Wind risk 9/10 · Severe
- Chance of severe wind over 30 yrs
- 99.0%
Air-quality risk 2/10 · Minimal
- Unhealthy air days now
- 2 days/yr
- Unhealthy air days in 30 yrs
- 2 days/yr
Risk factors via First Street. Map © Google.
Why this score? — see what drove the F grade
The composite is a weighted blend of 9 inputs, each scored 0–100. Each bar is that input's sub-score; the figure is the points it added to the 100-point composite (weight × sub-score).
- ARV discount +8.9/15.0
- Cash flow +7.3/30.0
- 1% rule +3.9/10.0
- Schools +3.5/10.0
- Livability +3.0/5.0
- Rent growth +2.9/5.0
- Condition / age +2.5/5.0
- DSCR +1.5/10.0
- Appreciation +0.0/10.0
$203,700
🖨 Deal sheet (PDF) 📄 Offer letter ✓ Due diligence
Listing remarks
An inviting layout and generous outdoor setting define this 3-bedroom, 2-bath home with a 2-car attached garage. Interior spaces are arranged with defined living and dining areas supported by natural light throughout. The property sits on a well-sized lot with a large backyard, offering flexibility for general outdoor use and future enhancements. Conveniently located near Crosby Community Park, Newport Golf Club, and Lake Houston, with shopping and dining along FM 2100 and access to major routes serving the northeast Houston area.
Key facts
- Large backyard
- Lake houston
- Newport golf club
Tags
Neighborhood map
What this means for you Summary
Snapshot
- This is a 3-bed/2.5-bath single-family listed at $204k.
Deal economics
- At list price, monthly cash flow is $-271 ($-3k/yr) — negative.
- To cash-flow at today's rent, offer at most $156k (23.5% below list).
- To meet the 1% rule (rent ≥ 1% of price), the offer needs to be $182k (10.7% below list).
- Recommended offer: $156k (23.5% below list) — sets the bar for cash-flow.
Location & tenants
- Location reads 59/100 on livability (#1,121 in TX) — a working-class tenant base; expect higher turnover. Strengths: cost of living A+, crime A, housing A; Watch: amenities F, commute F, employment F.
- Crosby ISD (rural): math 39% / reading 40% proficiency, ranked #369 of 826 in TX (top 45%) — families likely to look elsewhere, expect single-tenant / working-renter base with shorter leases.
- Zoned schools: Crosby Middle (math 36% / reading 37%, grade F, #786 of 1,662 statewide, top 48%, 1,549 students, 60% FRL); Crosby H S (math 44% / reading 45%, grade F, #652 of 1,632 statewide, top 43%, 1,937 students, 54% FRL).
- Market conditions: Rents rising (+1.5%/yr); 1189 active listings in the ZIP; 4 comparable units currently listed for rent nearby; rentals leasing fast (median 4d on market — plan ~1-2 weeks tenant-placement turnaround); solid renter incomes; 29,883 units permitted in Harris County in 2024 (8,621 in 5+ unit buildings).
Forward outlook
- Local home prices are declining (-3.0%/yr); year-one equity from $1k of loan paydown is wiped out by about $6k of value loss. Plan a longer hold.
- Harris County population projected at +47% by 2050 — long-run rental-demand tailwind backs the buy-and-hold thesis.
Negotiation context
- It's been on market 84 days — a 6% lower offer ($191k) is reasonable based on typical stale-listing flexibility.
- 3 sale attempts since 3y ago; this cycle's ask has dropped $39k (16%) from the opening price — seller is motivated, your offer sets the floor, not the list.
Risks & watch-outs
- Watch-outs: property tax is 2.9% of price.
- Climate carrying-cost: severe wind risk, 99% chance of damaging wind over 30y; extreme-heat days projected 7→24/yr by 2055 (HVAC capex compounding) — expect insurance premiums to compound above CPI over the hold.
Questions for the listing agent
- What do current leases actually rent for vs. the listed asking? Can we see a recent rent roll and the last 12 months of T-12 income?
- It's been on market 84 days. Have you received any prior offers? Is the seller open to a 23% concession, seller financing, or rate buy-down credit?
- Property tax is high relative to price — has the assessment been appealed recently, and will the sale trigger a re-assessment?
- What does the HOA fee cover, when was the last increase, and are there any pending special assessments or reserve-fund shortfalls?
- Why hasn't it sold? Are there any deal-killer items the seller is aware of (foundation, flood, title, zoning, code violations)?
- Is there a deadline driving the sale (1031 exchange, divorce, estate, relocation)? That informs how much negotiation room exists.
- Schools are D-rated, which usually means shorter tenancies and higher turnover. Who's the typical renter profile here, and what's been the actual vacancy rate?
- The area grade is low — what's the realistic commute time and amenity access for the typical tenant pool here? Any planned neighborhood developments (good or bad) we should know about?
- What's the average days-on-market for RENTAL listings here right now (not sales)? A rising rental-DOM trend means longer vacancies and softer asking-rent achievability than the comps imply.
- What's the recent tenant-quality profile in this submarket — average credit score on applications, eviction rate, late-payment / NSF rate, and stable-employment percentage? A property-management company in the area should have these aggregated.
- How much new for-sale + rental construction is in the pipeline within 1–3 miles? Heavy new supply typically softens prices + rents 12–24 months out; constrained supply supports both.
Investment metrics
- 1% rule
- 0.89% ✗
- Cap rate
- 4.70%
- Cash-on-cash
- -5.70%
- DSCR
- 0.75
- GRM
- 9.3
CMA / ARV
- ARV (on-the-fly)
- $210,364
- Comps found
- 12
Show comp detail 12 sales within ~0.75 mi
| Address | Dist | Beds/Ba | Sqft | Sold | Price | $/sf | Match |
|---|---|---|---|---|---|---|---|
| 16711 Jib Ct | 0.23mi | 3/2.0 | 1,460 (+7%) | 2mo | $222,500 | $152 | 74 |
| 17115 Forelock Way | 0.40mi | 3/2.0 | 1,395 (+2%) | 6mo | $217,000 | $156 | 71 |
| 342 Harbor Mist Dr | 0.64mi | 3/2.0 | 1,336 (-2%) | 3mo | $194,000 | $145 | 62 |
| 17030 Morning Star Ave | 0.49mi | 2/2.0 (-1) | 1,311 (-4%) | 3mo | $149,000 | $114 | 61 |
| 17434 Jolly Boat Dr | 0.51mi | 3/2.0 | 1,395 (+2%) | 11mo | $214,900 | $154 | 61 |
| 454 Fishhawk Way | 0.51mi | 3/2.0 | 1,420 (+4%) | 7mo | $222,800 | $157 | 61 |
| 710 Equinox St | 0.57mi | 3/2.0 | 1,428 (+4%) | 4mo | $175,000 | $123 | 60 |
| 1115 Channels Ct | 0.42mi | 3/2.0 | 1,523 (+12%) | 9mo | $209,900 | $138 | 52 |
| 17114 Jetty Ct | 0.56mi | 3/2.0 | 1,528 (+12%) | 2mo | $249,900 | $164 | 50 |
| 17247 Yeoman Way | 0.66mi | 3/2.0 | 1,513 (+11%) | 1mo | $265,000 | $175 | 49 |
| 16215 Spinnaker Dr | 0.54mi | 3/2.0 | 1,567 (+15%) | 1mo | $235,000 | $150 | 48 |
| 16611 Port O Call St | 0.59mi | 3/2.0 | 1,520 (+11%) | 8mo | $259,900 | $171 | 45 |
Match score weights: distance 35% · size 25% · config 20% · recency 20%. Top-matched comps best support the ARV.
Projected returns pro-forma
-3.0% appreciation · 1.48% rent growth · sell at horizon
- IRR
- -28.0%
- Equity multiple
- 0.07×
- Total profit
- $-52,779
- Equity at exit
- $30,372
- IRR
- -35.3%
- Equity multiple
- -0.37×
- Total profit
- $-78,210
- Equity at exit
- $17,612
Cash invested: $57,036 (down + closing). Projections, not guarantees.
Landlord ↔ Tenant lean methodology
- Overall (STATE)
- 87 Strongly Landlord-Friendly
- State Texas
- 87 Strongly Landlord-Friendly · R+5
- County
- — inherits STATE
- City
- — inherits STATE
ZIP-level market 77532
- Home prices YoY
- -28.6%
- Rents YoY
- 1.5%
- Active inventory
- 1189
- Price-to-rent
- 9.3×
Monthly cashflow live
- Estimated rent
- $1,820 medium interval (Pro) →
- Mortgage (P&I)
- −$1,068
- Tax from tax record
- −$490 /mo · $5,883/yr
- Insurance
- −$85
- HOA
- −$65
- Vacancy / Maint / Mgmt
- −$382
- Net cashflow
- $-271
Break-even live
Sensitivity live
| Price | -10% $-155 | -5% $-213 | +0% $-271 | +5% $-328 | +10% $-386 |
|---|---|---|---|---|---|
| Rent | -10% $-414 | -5% $-343 | +0% $-271 | +5% $-199 | +10% $-127 |
| Rate | -1.0pp $-168 | -0.5pp $-219 | base $-271 | +0.5pp $-323 | +1.0pp $-377 |
UW: 25.0% down · 7.5% · 30yr · 1.5% tax · 5.0% vac · 8.0% maint · 8.0% mgmt
Financing live
Cash to close
- Down payment
- $50,925
- Closing costs
- $6,111
- Reserves months
- —
- Total cash needed
- —
Loan-product check · same deal, 3 products live
Conventional
25% down · 7.5% · 30yr
- Down + closing
- —
- Monthly P&I
- —
- Monthly cashflow
- —
- DSCR
- —
- Eligible?
- —
Personal DTI + credit; lowest rate.
DSCR
20% down · 8.5% · 30yr
- Down + closing
- —
- Monthly P&I
- —
- Monthly cashflow
- —
- DSCR
- —
- Eligible?
- —
No personal income docs; deal must DSCR.
Hard money
10% down · 12.0% · 12mo
- Down + closing
- —
- Monthly P&I
- —
- Monthly cashflow
- —
- DSCR
- —
- Eligible?
- —
Short-term bridge; refi at stabilization.
Rent comps 4 comps
| Address | Beds | Baths | Sqft | Rent | $/sqft | DOM | Units | Dist |
|---|---|---|---|---|---|---|---|---|
| 16700 Golf Club Dr Crosby, TX | 1.0–2.0 | 1.0–2.0 | 780 | $1,275 | $1.63 | 0d | 12 | 0.08mi |
| 16318 River Wood Ct Crosby, TX | 3.0 | 2.5 | 1681 | $1,946 | $1.16 | 4d | 1 | 0.56mi |
| 711 Equinox St Crosby, TX | 3.0 | 2.0 | 1802 | $1,881 | $1.04 | 45d | 1 | 0.63mi |
| 430 Fishhawk Way Crosby, TX | 3.0 | 2.0 | 1369 | $1,783 | $1.30 | 1d | 1 | 0.63mi |
HOA detail
- Monthly dues
- $65 · $780/yr
Listing history 14 events
-
2026-04-16status Pending
-
2026-04-16price $203,700
-
2026-03-10price $223,100
-
2026-01-22$242,500 Active
-
2025-03-29status Pending
-
2025-03-22status Option Pending
-
2025-03-22historical
-
2025-03-13price $237,500
-
2025-03-07price $259,990
-
2025-02-15$265,000 Active
-
2023-07-09historical
-
2023-07-03status Pending
-
2023-07-03historical
-
2023-06-15$250,000 Active
ⓘ Source: listings_history table (triggers on properties + properties_extension) + one-shot
backfill from property_details.listing_events for pre-trigger history.
Tax reassessment forecast TX · Resets to sale price
- Current annual tax
- $5,883 · $490/mo
- Projected year-2 tax
- $5,883 · $490/mo
- Expected delta
- $0/yr ($0/mo · 0.0%)
ⓘ Screening estimate from a state-policy table — verify with the county assessor before closing.
Climate risk First Street
- Flood 1/10 Low FEMA zone X (unshaded) · 0% chance over 30 yrs
- Wildfire 3/10 Moderate
- Heat 9/10 Extreme 7 d/yr ≥110°F today · 24 d/yr by 30 yrs out
- Wind 9/10 Extreme 99% chance of damaging wind over 30 yrs
- Air quality 2/10 Low 2 unhealthy d/yr today · 2 by 30 yrs out
Nearby sold comps map
Loading sold comps map…
Walkable amenities ~0.75 mi
Loading nearby amenities…
Taxation est. · year 1
- Rental income
- $21,837
- − Mortgage interest
- −$11,410
- − Property taxes
- −$5,883
- − Insurance
- −$1,018
- − Repairs & maintenance
- −$1,747
- − Management
- −$1,747
- − HOA
- −$780
- − Depreciation
- −$5,926
- Taxable loss
- −$6,674
- Est. tax savings @ 24.0%
- +$1,602
- After-tax cash flow
- $-1,647/yr
For passive investors: Depreciation is non-cash, so a rental often shows a tax loss while cash-flowing — sheltering income. Rental losses are passive: they offset passive income freely, and up to $25,000/yr can offset ordinary (W-2) income if you actively participate and your MAGI is under $100k (phasing out to $0 by $150k); unused losses carry forward. On sale, claimed depreciation is recaptured at up to 25%, and gains may owe capital-gains tax (a 1031 exchange can defer both). Figures are a year-1 estimate at your 24.0% rate — not tax advice; consult a CPA.
Schools (NCES district)
- District
- Crosby ISD
- NCES district ID
- 4815750
- Math proficiency
- 39% ▼ -13.00%
- Reading proficiency
- 40% ▼ -5.00%
- Median HH income
- $61,079
- Composite
- 35.14/100
- National rank
- #5012
- State rank
- #369 of 826 in TX
Livability — Crosby
- Score
- 59/100
- State rank
- #1121
- US rank
- #19783
Category grades
Schools grade is shown separately in the Schools card above.
Census & demographics
- County
- Harris County · 4,702,590 people
- City population
- 33,780
- Metro
- Houston-The Woodlands-Sugar Land, TX
- Population (ZIP)
- 33,780
- Household income
- $92,201
- Rent vs Own
- Severe rent burden
- 382.0
Population outlook (Harris County) Hauer SSP2
- Today (2025)
- 5,571,493 people
- By 2030
- 6,089,821 · +9.3%
- By 2040
- 7,142,806 · +28.2%
- By 2050
- 8,185,864 · +46.9%
- By 2075
- 10,574,329 · +89.8%
- By 2100
- 12,109,958 · +117.4%
Race, ethnicity, and origin ACS 2023
- Neighborhood character
- Diverse neighborhood (Simpson 0.60)
- Race & ethnicity
- White 54% Hispanic / Latino 31% Two or more races 16% Black 9%
- Hispanic origin (detail)
- Mexican 24%
- Common ancestry
- Lithuanian 4% Romanian 3% Italian 2%
- Foreign-born
- 10% · Canada
- Languages at home
- 78% English-only · Spanish 21%
Political lean MEDSL · Harris
- 2024 margin
- Lean D (+5.5) · D 52.0% · R 46.4% · Other 1.6%
- 2008→2024 swing
- +3.9pp toward D · 2008: 1.6pp · 2024: 5.5pp
- All cycles
- 2024: D+5.5 2020: D+13.3 2016: D+12.4 2012: D+0.1 2008: D+1.6
Not yet ingested
- Civics
- —
Market trends
- HPI YoY
- ▼ -105.63%
- Current HPI
- 264.0126
- Rent YoY
- ▲ 1.48%
- Metro
- Houston-The Woodlands-Sugar Land, TX
- State GDP YoY
- ▲ 3.95%
- F500 in state
- 110
Industry mix (Fortune 500 HQ in TX)
| Industry | F500 HQs | Revenue |
|---|---|---|
| Energy | 16 | $1,198B |
|
||
| Technology | 5 | $198B |
|
||
| Engineering / Construction | 4 | $72B |
|
||
| Energy Services | 3 | $60B |
|
||
| Utilities | 3 | $41B |
|
||
| Healthcare | 2 | $330B |
|
||
Price history
-18.5% since first listed14 events — show timeline
- 2026-04-16 Pending — HARMLS
- 2026-04-16 Price Changed $203,700 HARMLS
- 2026-03-10 Price Changed $223,100 HARMLS
- 2026-01-22 Listed $242,500 HARMLS
- 2025-03-29 Pending — HARMLS
- 2025-03-22 Pending — HARMLS
- 2025-03-22 Listing Removed — HARMLS
- 2025-03-13 Price Changed $237,500 HARMLS
- 2025-03-07 Price Changed $259,990 HARMLS
- 2025-02-15 Listed $265,000 HARMLS
- 2023-07-09 Rental Removed — APPFOLIO
- 2023-07-03 Pending — HARMLS
- 2023-07-03 Listing Removed — HARMLS
- 2023-06-15 Listed $250,000 HARMLS
Property tax history
+73.0%/yrLatest (2025): $5,883 · +1.4% YoY. Source: county tax records.
Cash-flow waterfall
monthlySold comps — $/sqft
last 12 mo · ≤1 miLoading sold comps…