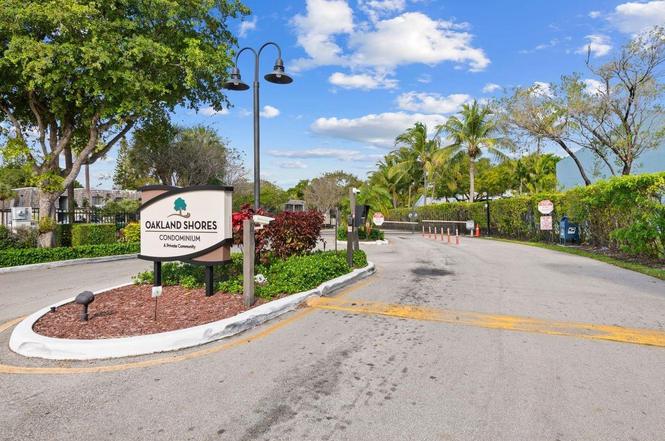
3101 Oakland Shores Dr Unit H108 · Oakland Park, FL
Flood risk No data
- FEMA flood zone
- —
- Chance of flooding over 30 yrs
- —
- Est. flood insurance / yr
- —
Fire risk No data
- Est. fire insurance / yr
- —
Heat risk No data
- Hot days now (above threshold)
- —
- Hot days in 30 yrs
- —
Wind risk No data
- Chance of severe wind over 30 yrs
- —
Air-quality risk No data
- Unhealthy air days now
- —
- Unhealthy air days in 30 yrs
- —
Risk factors via First Street. Map © Google.
Why this score? — see what drove the D grade
The composite is a weighted blend of 9 inputs, each scored 0–100. Each bar is that input's sub-score; the figure is the points it added to the 100-point composite (weight × sub-score).
- Cash flow +12.3/30.0
- 1% rule +8.0/10.0
- ARV discount +7.5/15.0
- Schools +4.1/10.0
- Livability +3.9/5.0
- DSCR +3.7/10.0
- Condition / age +2.5/5.0
- Rent growth +2.4/5.0
- Appreciation +0.0/10.0
$135,000
🖨 Deal sheet (PDF) 📄 Offer letter ✓ Due diligence
Listing remarks
1/1 on the first floor, No stairs - Quite in a gated community. Just installed new flooring, new paint, unit is vacant and ready for new owner. All assessments have been paid and maintenance is up to date. One assigned parking space with plenty of guest parking. Lease upon purchase. Condo is also available for lease !
Key facts
- Gated community
- Guest parking
- New flooring
Tags
Property features AI
Finance
- Other: Resale property; Not waterfront; Living area reported as 760 (square footage omitted per instructions)
- HOA & community: Association with monthly HOA dues; Community amenities: clubhouse, pool, community room, car wash area, parking, trash chute; Association covers insurance, grounds maintenance, sewer, trash, water, hot water, pool service
Exterior
- Parking: Assigned parking; Attached garage
- Security: Closed-circuit camera(s); Security fence; Entry with phone/intercom
- Utilities: Cable available
- Home design: Condominium; 2-story building; North-facing
- Construction: CBS construction
- Exterior features: Screened porch; Porch; Fenced
Interior
- Kitchen: Dishwasher; Electric range; Refrigerator
- Bedrooms: No main-level bedrooms noted
- Flooring: Laminate; Wood
- Bathrooms: 1 full bathroom
- Heating & cooling: Central heating; Central air; Ceiling fan(s)
- Interior features: Walk-in closet(s); Blinds on windows
Neighborhood map
What this means for you Summary
Snapshot
- This is a 1-bed/1.0-bath condo listed at $135k.
Deal economics
- At list price, monthly cash flow is $-25 ($-295/yr) — negative.
- To cash-flow at today's rent, offer at most $131k (3.2% below list).
- Meets the 1% rule at list price ($2k rent vs $135k).
- Recommended offer: $123k (9.0% below list) — sets the bar for market timing.
- Cap rate 6.1% vs local median 3.8% in Oakland Park — top-decile yield for the area; either an underpriced asset or a hidden risk that comps aren't pricing in. Stress-test before assuming the spread holds.
Location & tenants
- Location reads 77/100 on livability (#193 in FL, #3,082 nationally) — a middle-class / working-renter tenant base. Strengths: commute A+, housing A+, health & safety A+; Watch: amenities F.
- Broward (suburban): math 42% / reading 53% proficiency, ranked #46 of 73 in FL (top 63%) — families likely to look elsewhere, expect single-tenant / working-renter base with shorter leases.
- Zoned schools: Nova Blanche Forman Elementary (math 35% / reading 55%, grade D-, #1,271 of 2,144 statewide, top 60%, 769 students, 72% FRL); Lauderdale Lakes Middle School (math 21% / reading 26%, grade F, #536 of 571 statewide, top 95%, 816 students, 79% FRL); Boyd H. Anderson High School (math 10% / reading 14%, grade F, #622 of 667 statewide, top 93%, 2,038 students, 72% FRL) — zoned schools average 74% FRL vs 51% district-wide (23 pts higher); higher-poverty schools than district average — tighter screening recommended.
- Zoned-school proficiency averages 27% at this address vs 48% district-wide (-21 pts) — the specific schools serving this property underperform the Broward average; the district grade overstates school quality for this exact location.
- Market conditions: Rents soft (-0.5%/yr); 341 active listings in the ZIP; 40 comparable units currently listed for rent nearby; rentals leasing fast (median 14d on market — plan ~1-2 weeks tenant-placement turnaround); solid renter incomes; 2,111 units permitted in Broward County in 2024 (1,265 in 5+ unit buildings).
Forward outlook
- Local home prices are declining (-3.0%/yr); year-one equity from $933 of loan paydown is wiped out by about $4k of value loss. Plan a longer hold.
- Broward County population projected at +34% by 2050 — long-run rental-demand tailwind backs the buy-and-hold thesis.
Negotiation context
- It's been on market 102 days — a 9% lower offer ($123k) is reasonable based on typical stale-listing flexibility.
- 2 sale attempts; this cycle's ask is 8610% above the opening price — seller raised mid-cycle; expect resistance to lowballs.
- Current owner paid $26k; list at $135k implies a 429% gain — meaningful room to come down on a strong offer.
Risks & watch-outs
- Watch-outs: HOA is 24% of rent.
Questions for the listing agent
- What do current leases actually rent for vs. the listed asking? Can we see a recent rent roll and the last 12 months of T-12 income?
- It's been on market 102 days. Have you received any prior offers? Is the seller open to a 9% concession, seller financing, or rate buy-down credit?
- Built in 1974 — when were the roof, HVAC, electrical panel, plumbing, and water heater last replaced?
- What does the HOA fee cover, when was the last increase, and are there any pending special assessments or reserve-fund shortfalls?
- Any open or pending special assessments — roof, HVAC, plumbing, elevator, façade? What's the per-unit balance and payoff schedule, and is the seller paying it off at close or rolling it to the buyer?
- Why hasn't it sold? Are there any deal-killer items the seller is aware of (foundation, flood, title, zoning, code violations)?
- Is there a deadline driving the sale (1031 exchange, divorce, estate, relocation)? That informs how much negotiation room exists.
- Schools are D-rated, which usually means shorter tenancies and higher turnover. Who's the typical renter profile here, and what's been the actual vacancy rate?
- The area grade is low — what's the realistic commute time and amenity access for the typical tenant pool here? Any planned neighborhood developments (good or bad) we should know about?
- What's the average days-on-market for RENTAL listings here right now (not sales)? A rising rental-DOM trend means longer vacancies and softer asking-rent achievability than the comps imply.
- What's the recent tenant-quality profile in this submarket — average credit score on applications, eviction rate, late-payment / NSF rate, and stable-employment percentage? A property-management company in the area should have these aggregated.
- How much new apartment / multifamily construction is in the pipeline within 1–3 miles? Heavy new supply (>2% of stock underway) typically softens rents 12–24 months out; light construction supports rent growth.
Investment metrics
- 1% rule
- 1.30% ✓
- Cap rate
- 6.07%
- Cash-on-cash
- -0.78%
- DSCR
- 0.97
- GRM
- 6.4
CMA / ARV
No comps found within radius.
Projected returns pro-forma
-3.0% appreciation · 0.0% rent growth · sell at horizon
- IRR
- -22.6%
- Equity multiple
- 0.25×
- Total profit
- $-28,273
- Equity at exit
- $20,129
- IRR
- -37.2%
- Equity multiple
- -0.20×
- Total profit
- $-45,248
- Equity at exit
- $11,672
Cash invested: $37,800 (down + closing). Projections, not guarantees.
Landlord ↔ Tenant lean methodology
- Overall (STATE)
- 87 Strongly Landlord-Friendly
- State Florida
- 87 Strongly Landlord-Friendly · R+3
- County
- — inherits STATE
- City
- — inherits STATE
ZIP-level market 33309
- Home prices YoY
- -26.6%
- Rents YoY
- -0.5%
- Active inventory
- 341
- Price-to-rent
- 6.4×
Monthly cashflow live
- Estimated rent
- $1,759 high interval (Pro) →
- Mortgage (P&I)
- −$708
- Tax from tax record
- −$228 /mo · $2,738/yr
- Insurance
- −$56
- HOA
- −$422
- Vacancy / Maint / Mgmt
- −$369
- Net cashflow
- $-25
Break-even live
Sensitivity live
| Price | -10% $52 | -5% $14 | +0% $-25 | +5% $-63 | +10% $-101 |
|---|---|---|---|---|---|
| Rent | -10% $-164 | -5% $-94 | +0% $-25 | +5% $45 | +10% $114 |
| Rate | -1.0pp $43 | -0.5pp $10 | base $-25 | +0.5pp $-60 | +1.0pp $-95 |
UW: 25.0% down · 7.5% · 30yr · 1.5% tax · 5.0% vac · 8.0% maint · 8.0% mgmt
Financing live
Cash to close
- Down payment
- $33,750
- Closing costs
- $4,050
- Reserves months
- —
- Total cash needed
- —
Loan-product check · same deal, 3 products live
Conventional
25% down · 7.5% · 30yr
- Down + closing
- —
- Monthly P&I
- —
- Monthly cashflow
- —
- DSCR
- —
- Eligible?
- —
Personal DTI + credit; lowest rate.
DSCR
20% down · 8.5% · 30yr
- Down + closing
- —
- Monthly P&I
- —
- Monthly cashflow
- —
- DSCR
- —
- Eligible?
- —
No personal income docs; deal must DSCR.
Hard money
10% down · 12.0% · 12mo
- Down + closing
- —
- Monthly P&I
- —
- Monthly cashflow
- —
- DSCR
- —
- Eligible?
- —
Short-term bridge; refi at stabilization.
Rent comps 40 comps
| Address | Beds | Baths | Sqft | Rent | $/sqft | DOM | Units | Dist |
|---|---|---|---|---|---|---|---|---|
| 3123 Oakland Shores Dr Unit D112 Oakland Park, FL | 1.0 | 1.0 | 760 | $1,450 | $1.91 | 12d | 1 | 0.07mi |
| 3123 Oakland Shores Dr Unit D112 Oakland Park, FL | 1.0 | 1.0 | 760 | $1,450 | $1.91 | 22d | 1 | 0.07mi |
| 3115 Oakland Shores Dr Oakland Park, FL | 1.0 | 1.0 | 760 | $1,625 | $2.14 | 0d | 2 | 0.09mi |
| 3115 Oakland Shores Dr Unit E208 Oakland Park, FL | 1.0 | 1.0 | 760 | $1,700 | $2.24 | 26d | 1 | 0.09mi |
| 3119 Oakland Shores Dr Unit C212 Oakland Park, FL | 1.0 | 1.0 | 760 | $1,380 | $1.82 | 26d | 1 | 0.10mi |
| 3119 Oakland Shores Dr Unit C110 Oakland Park, FL | 2.0 | 2.0 | 1050 | $1,800 | $1.71 | 9d | 1 | 0.10mi |
| 3082 S Oakland Forest Dr #1301 Oakland Park, FL | 2.0 | 2.5 | 1098 | $1,975 | $1.80 | 22d | 1 | 0.18mi |
| 2720 S Oakland Forest Dr Oakland Park, FL | 2.0 | 2.0 | 1100 | $2,050 | $1.86 | 26d | 1 | 0.26mi |
| 2733 S Oakland Forest Dr Oakland Park, FL | 2.0 | 2.0 | 1050 | $2,200 | $2.10 | 26d | 1 | 0.29mi |
| 2850 N Oakland Forest Dr Oakland Park, FL | 1.0–2.0 | 1.0–2.0 | 918 | $1,600 | $1.74 | 4d | 4 | 0.30mi |
| 2850 N Oakland Forest Dr Oakland Park, FL | 1.0 | 1.0 | 786 | $1,675 | $2.13 | 21d | 2 | 0.30mi |
| 2890 N Oakland Forest Dr #204 Oakland Park, FL | 2.0 | 2.0 | 992 | $2,000 | $2.02 | 21d | 1 | 0.31mi |
| 2890 N Oakland Forest Dr #111 Oakland Park, FL | 2.0 | 2.0 | 1038 | $2,000 | $1.93 | 9d | 1 | 0.31mi |
| 2820 N Oakland Forest Dr Oakland Park, FL | 1.0 | 1.0 | 824 | $1,735 | $2.11 | 9d | 2 | 0.32mi |
| 2810 N Oakland Forest Dr #104 Oakland Park, FL | 2.0 | 2.0 | 1050 | $2,295 | $2.19 | 4d | 1 | 0.34mi |
| 2810 N Oakland Forest Dr #108 Oakland Park, FL | 1.0 | 1.0 | 862 | $1,550 | $1.80 | 26d | 1 | 0.34mi |
| 2880 N Oakland Forest Dr Oakland Park, FL | 1.0–2.0 | 1.0–2.0 | 921 | $1,799 | $1.95 | 26d | 2 | 0.35mi |
| 2880 N Oakland Forest Dr Oakland Park, FL | 1.0–2.0 | 1.0–2.0 | 921 | $1,799 | $1.95 | 7d | 2 | 0.35mi |
| 2880 N Oakland Forest Dr Oakland Park, FL | 1.0–2.0 | 1.0–2.0 | 912 | $1,654 | $1.81 | 5d | 3 | 0.35mi |
| 2881 N Oakland Forest Dr Oakland Park, FL | 2.0 | 2.0 | 1119 | $2,220 | $1.98 | 16d | 3 | 0.40mi |
| 2881 N Oakland Forest Dr Oakland Park, FL | 1.0–2.0 | 1.0–2.0 | 1002 | $1,690 | $1.69 | 13d | 5 | 0.40mi |
| 2811 N Oakland Forest Dr Oakland Park, FL | 2.0 | 2.0 | 1015 | $2,248 | $2.21 | 7d | 2 | 0.40mi |
| 2811 N Oakland Forest Dr Oakland Park, FL | 1.0–2.0 | 1.0–2.0 | 941 | $1,750 | $1.86 | 0d | 3 | 0.40mi |
| 2811 N Oakland Forest Dr Oakland Park, FL | 2.0 | 2.0 | 1015 | $2,100 | $2.07 | 26d | 2 | 0.40mi |
| 2811 N Oakland Forest Dr #306 Oakland Park, FL | 2.0 | 2.0 | 992 | $2,200 | $2.22 | 17d | 1 | 0.40mi |
| 2871 N Oakland Forest Dr Oakland Park, FL | 1.0–2.0 | 1.0–2.0 | 926 | $1,945 | $2.10 | 0d | 2 | 0.41mi |
| 2871 N Oakland Forest Dr Oakland Park, FL | 1.0–2.0 | 1.0–2.0 | 926 | $1,950 | $2.11 | 13d | 1 | 0.41mi |
| 2871 N Oakland Forest Dr Oakland Park, FL | 1.0–2.0 | 1.0–2.0 | 926 | $1,945 | $2.10 | 3d | 2 | 0.41mi |
| 2861 N Oakland Forest Dr #301 Oakland Park, FL | 1.0 | 1.0 | 804 | $1,694 | $2.11 | 19d | 1 | 0.43mi |
| 2831 N Oakland Forest Dr Oakland Park, FL | 1.0–2.0 | 1.0–2.0 | 927 | $1,750 | $1.89 | 7d | 2 | 0.44mi |
| 2831 N Oakland Forest Dr #101 Oakland Park, FL | 2.0 | 2.0 | 1100 | $2,295 | $2.09 | 23d | 1 | 0.44mi |
| 2831 N Oakland Forest Dr #101 Oakland Park, FL | 2.0 | 2.0 | 1050 | $2,295 | $2.19 | 15d | 1 | 0.44mi |
| 2851 N Oakland Forest Dr #111 Oakland Park, FL | 1.0 | 1.0 | 860 | $1,995 | $2.32 | 12d | 1 | 0.45mi |
| 2851 N Oakland Forest Dr Oakland Park, FL | 1.0 | 1.0 | 823 | $1,872 | $2.28 | 21d | 1 | 0.45mi |
| 2841 N Oakland Forest Dr #107 Oakland Park, FL | 1.0 | 1.0 | 862 | $1,750 | $2.03 | 3d | 1 | 0.48mi |
| 2830 Somerset Dr Lauderdale Lakes, FL | 2.0 | 2.0 | 1010 | $1,925 | $1.91 | 12d | 2 | 0.51mi |
| 2607 NW 33rd St Oakland Park, FL | 1.0 | 1.0 | 834 | $1,622 | $1.95 | 9d | 2 | 0.52mi |
| 2607 NW 33rd St Oakland Park, FL | 1.0 | 1.0 | 834 | $1,648 | $1.98 | 26d | 2 | 0.52mi |
| 118 Lake Emerald Dr Oakland Park, FL | 2.0 | 2.0 | 920 | $2,275 | $2.47 | 20d | 3 | 0.53mi |
| 118 Lake Emerald Dr Oakland Park, FL | 2.0 | 2.0 | 920 | $2,475 | $2.69 | 0d | 2 | 0.53mi |
HOA detail condo
- Monthly dues
- $422 · $5,064/yr
- Likely covers
- securityparking
- Assessments
- None detected in remarks — confirm with the listing agent.
Listing history 17 events
-
2026-06-21days on market $135,000 Active 102 DOM
-
2026-06-18days on market $135,000 Active 99 DOM
-
2026-06-17days on market $135,000 Active 98 DOM
-
2026-06-16days on market $135,000 Active 97 DOM
-
2026-06-15days on market $135,000 Active 96 DOM
-
2026-06-13days on market $135,000 Active 94 DOM
-
2026-06-09days on market $135,000 Active 90 DOM
-
2026-06-07days on market $135,000 Active 88 DOM
-
2026-06-04days on market $135,000 Active 85 DOM
-
2026-06-03days on market $135,000 Active 84 DOM
-
2026-06-02days on market $135,000 Active 83 DOM
-
2026-06-01days on market $135,000 Active 82 DOM
-
2026-05-31days on market $135,000 Active 81 DOM
-
2026-05-22$1,550
-
2025-12-19$142,500 Active
-
1992-07-08soldstatus $25,500
-
1979-01-01soldstatus $27,800
ⓘ Source: listings_history table (triggers on properties + properties_extension) + one-shot
backfill from property_details.listing_events for pre-trigger history.
Tax reassessment forecast FL · Resets to sale price
- Current annual tax
- $2,738 · $228/mo
- Projected year-2 tax
- $2,738 · $228/mo
- Expected delta
- $0/yr ($0/mo · 0.0%)
ⓘ Screening estimate from a state-policy table — verify with the county assessor before closing.
Nearby sold comps map
Loading sold comps map…
Walkable amenities ~0.75 mi
Loading nearby amenities…
Taxation est. · year 1
- Rental income
- $21,111
- − Mortgage interest
- −$7,562
- − Property taxes
- −$2,738
- − Insurance
- −$675
- − Repairs & maintenance
- −$1,689
- − Management
- −$1,689
- − HOA
- −$5,064
- − Depreciation
- −$3,927
- Taxable loss
- −$2,233
- Est. tax savings @ 24.0%
- +$536
- After-tax cash flow
- $241/yr
For passive investors: Depreciation is non-cash, so a rental often shows a tax loss while cash-flowing — sheltering income. Rental losses are passive: they offset passive income freely, and up to $25,000/yr can offset ordinary (W-2) income if you actively participate and your MAGI is under $100k (phasing out to $0 by $150k); unused losses carry forward. On sale, claimed depreciation is recaptured at up to 25%, and gains may owe capital-gains tax (a 1031 exchange can defer both). Figures are a year-1 estimate at your 24.0% rate — not tax advice; consult a CPA.
Schools (NCES district)
- District
- Broward
- NCES district ID
- 1200180
- Math proficiency
- 42% ▼ -18.00%
- Reading proficiency
- 53% ▼ -5.00%
- Median HH income
- $52,139
- Composite
- 40.88/100
- National rank
- #3621
- State rank
- #46 of 73 in FL
Livability — Oakland Park
- Score
- 77/100
- State rank
- #193
- US rank
- #3082
Category grades
Schools grade is shown separately in the Schools card above.
Census & demographics
- Census place
- Oakland Park, FL
- County
- Broward County · 1,963,430 people
- City population
- 68,410
- Metro
- Miami-Fort Lauderdale-Pompano Beach, FL
- Population (ZIP)
- 37,475
- Household income
- $77,321
- Rent vs Own
- Severe rent burden
- 1596.0
Population outlook (Broward County) Hauer SSP2
- Today (2025)
- 2,207,033 people
- By 2030
- 2,360,704 · +7.0%
- By 2040
- 2,661,208 · +20.6%
- By 2050
- 2,946,698 · +33.5%
- By 2075
- 3,602,273 · +63.2%
- By 2100
- 3,970,984 · +79.9%
Race, ethnicity, and origin ACS 2023
- Neighborhood character
- Diverse neighborhood (Simpson 0.68)
- Race & ethnicity
- Black 43% Hispanic / Latino 28% White 22% Two or more races 20% Asian 2%
- Hispanic origin (detail)
- Mexican 4% Puerto Rican 4% Cuban 3% Dominican 1%
- Common ancestry
- Hispanic 15% Lithuanian 1% Romanian 1%
- Foreign-born
- 38% · Canada, Jamaica, Dominican Republic
- Languages at home
- 55% English-only · Spanish 25% French/Haitian/Cajun 17% Other Indo-European 2%
Political lean MEDSL · Broward
- 2024 margin
- D (+17.0) · D 58.0% · R 41.0%
- 2008→2024 swing
- -17.8pp toward R · 2008: 34.7pp · 2024: 17.0pp
- All cycles
- 2024: D+17.0 2020: D+29.8 2016: D+35.0 2012: D+34.9 2008: D+34.7
Not yet ingested
- Civics
- —
Market trends
- HPI YoY
- ▼ -158.71%
- Current HPI
- 439.091
- Rent YoY
- ▼ -0.50%
- Metro
- Miami-Fort Lauderdale-Pompano Beach, FL
- State GDP YoY
- ▲ 3.28%
- F500 in state
- 36
Industry mix (Fortune 500 HQ in FL)
| Industry | F500 HQs | Revenue |
|---|---|---|
| Industrial Technology | 2 | $29B |
|
||
| Insurance | 2 | $17B |
|
||
| Retail | 1 | $60B |
|
||
| Technology Distribution | 1 | $58B |
|
||
| Homebuilding | 1 | $35B |
|
||
| Technology Manufacturing | 1 | $35B |
|
||
Price history
-94.4% since first listed4 events — show timeline
- 2026-05-22 Listed for Rent $1,550 GFLMLS
- 2025-12-19 Listed $142,500 Beaches MLS
- 1992-07-08 Sold (Public Records) $25,500 Public Records
- 1979-01-01 Sold (Public Records) $27,800 Public Records
Property tax history
+9.0%/yrLatest (2025): $2,738 · +3.0% YoY. Source: county tax records.
Cash-flow waterfall
monthlySold comps — $/sqft
last 12 mo · ≤1 miLoading sold comps…