 🏷️ Likely Rental
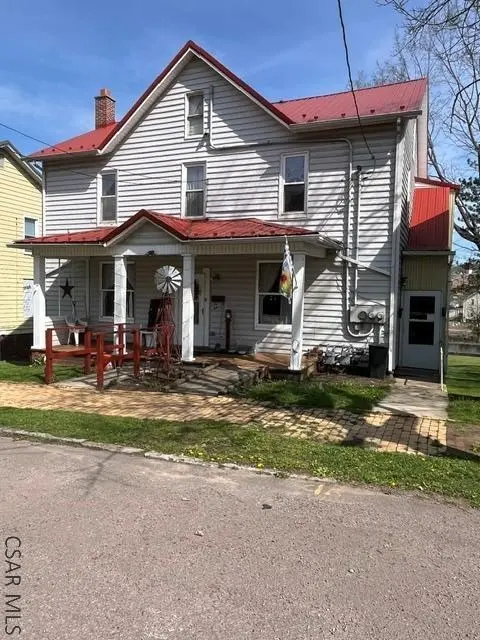
307 Front St · Meyersdale, PA
Flood risk 4/10 · Minor
- FEMA flood zone
- X (unshaded)
- Chance of flooding over 30 yrs
- 0.23%
- Est. flood insurance / yr
- $473 – $860
Fire risk 3/10 · Minor
- Est. fire insurance / yr
- $511 – $949
Heat risk 3/10 · Minor
- Hot days now (above 87°F)
- 7 days/yr
- Hot days in 30 yrs
- 19 days/yr
Wind risk 2/10 · Minimal
- Chance of severe wind over 30 yrs
- —
Air-quality risk 2/10 · Minimal
- Unhealthy air days now
- 1 days/yr
- Unhealthy air days in 30 yrs
- 1 days/yr
Risk factors via First Street. Map © Google.
Why this score? — see what drove the A- grade
The composite is a weighted blend of 9 inputs, each scored 0–100. Each bar is that input's sub-score; the figure is the points it added to the 100-point composite (weight × sub-score).
- Cash flow +30.0/30.0
- ARV discount +15.0/15.0
- DSCR +10.0/10.0
- 1% rule +9.6/10.0
- Appreciation +7.1/10.0
- Schools +4.3/10.0
- Livability +3.4/5.0
- Rent growth +2.5/5.0
- Condition / age +2.5/5.0
$89,000
🖨 Deal sheet (PDF) 📄 Offer letter ✓ Due diligence
Listing remarks
Well kept Duplex in Meyersdale. It has long time tenants ( 27 years and 7 years) Tenants pay all utilities. There are 2 gas meters, 2 electric meters and 2 water meters. The property has a nice back yard off the lower porch. Tenant on lower level also has a back porch to sit and relax.
Key facts
- Back yard
- Back porch
- Duplex
Tags
Property features AI
Finance
- Other: Zoned residential
- Financial info: Actual rent: $400 per unit (two units)
Exterior
- Parking: On-street parking
- Utilities: Public sewer
- Home design: Multi-family residential income property; 2 stories
- Construction: Vinyl siding; Metal roof
- Exterior features: Covered porch
Interior
- Bedrooms: Two 2-bedroom units
- Flooring: Carpet; Vinyl
- Bathrooms: Each unit has 1 bathroom
- Heating & cooling: Natural gas hot water heating
- Interior features: Carpet and vinyl flooring
Neighborhood map
What this means for you Summary
Snapshot
- This is a 4-bed/2.0-bath single-family listed at $89k.
Deal economics
- At list price, monthly cash flow is $411 ($5k/yr) — positive.
- The deal already cash-flows at list — no discount required.
- Meets the 1% rule at list price ($1k rent vs $89k).
- Recommended offer: $86k (3.0% below list) — sets the bar for market timing.
Location & tenants
- Location reads 68/100 on livability (#880 in PA) — a middle-class / working-renter tenant base. Strengths: crime A+, cost of living A+, housing A+; Watch: employment D+, amenities F, commute F.
- Meyersdale Area SD (rural): math 38% / reading 64% proficiency, ranked #177 of 539 in PA (top 33%) — acceptable for families but not a draw, mixed tenant base, ~2y average lease.
- Zoned schools: Meyersdale Area El Sch (math 42% / reading 62%, grade C-, #586 of 1,518 statewide, top 42%, 320 students, 60% FRL); Meyersdale Area Ms (math 27% / reading 62%, grade D, #194 of 512 statewide, top 39%, 186 students, 57% FRL); Meyersdale Area Hs (math 64% / reading 74%, grade B, #49 of 437 statewide, top 12%, 271 students, 36% FRL).
- Market conditions: 26 active listings in the ZIP; 78 units permitted in Somerset County in 2024 (0 in 5+ unit buildings).
Forward outlook
- In year one you build about $4k of equity ($615 loan paydown + $4k appreciation (4.1% local appreciation)).
- Somerset County population projected at -21% by 2050 — secular population decline; favor cash flow + early exit over multi-decade hold.
- At projected returns (4.1% appreciation + 3.0% rent growth), your $25k cash investment doubles in ~3 years — after that, you're playing with house money.
- By year 8, paydown + projected appreciation supports a ~$32k cash-out refi (75% LTV) — recoverable capital for the next deal without selling this one.
Negotiation context
- It's been on market 39 days — a 3% lower offer ($86k) is reasonable based on typical stale-listing flexibility.
- Current owner paid $40k; list at $89k implies a 123% gain — meaningful room to come down on a strong offer.
Risks & watch-outs
- Watch-outs: built in 1870 — expect roof / HVAC / electrical / plumbing capex.
Questions for the listing agent
- It's been on market 39 days. Have you received any prior offers? Is the seller open to a 3% concession, seller financing, or rate buy-down credit?
- Built in 1870 — when were the roof, HVAC, electrical panel, plumbing, and water heater last replaced?
- Is there a deadline driving the sale (1031 exchange, divorce, estate, relocation)? That informs how much negotiation room exists.
- What's the average days-on-market for RENTAL listings here right now (not sales)? A rising rental-DOM trend means longer vacancies and softer asking-rent achievability than the comps imply.
- What's the recent tenant-quality profile in this submarket — average credit score on applications, eviction rate, late-payment / NSF rate, and stable-employment percentage? A property-management company in the area should have these aggregated.
- How much new for-sale + rental construction is in the pipeline within 1–3 miles? Heavy new supply typically softens prices + rents 12–24 months out; constrained supply supports both.
Investment metrics
- 1% rule
- 1.46% ✓
- Cap rate
- 11.83%
- Cash-on-cash
- 19.79%
- DSCR
- 1.88
- GRM
- 5.7
CMA / ARV
- ARV (on-the-fly)
- $146,880
- Comps found
- 12
Show comp detail 12 sales within ~0.75 mi
| Address | Dist | Beds/Ba | Sqft | Sold | Price | $/sf | Match |
|---|---|---|---|---|---|---|---|
| 122 Market St | 0.11mi | 4/1.0 | 1,727 (-0%) | 22mo | $48,000 | $28 | 72 |
| 725 Grant Street Ext | 0.56mi | 4/2.0 | 1,684 (-2%) | 7mo | $130,000 | $77 | 64 |
| 227 Broadway St | 0.33mi | 3/2.0 (-1) | 1,792 (+4%) | 14mo | $160,000 | $89 | 61 |
| 203 Hill St | 0.50mi | 3/2.0 (-1) | 1,845 (+7%) | 3mo | $150,000 | $81 | 58 |
| 414 High St | 0.48mi | 4/2.0 | 1,792 (+4%) | 17mo | $117,000 | $65 | 57 |
| 314 Broadway St | 0.36mi | 4/2.0 | 1,578 (-9%) | 15mo | $115,000 | $73 | 56 |
| 237 Lincoln Ave | 0.32mi | 3/1.5 (-1) | 1,680 (-3%) | 22mo | $63,600 | $38 | 56 |
| 118 Olinger St | 0.42mi | 3/2.0 (-1) | 1,536 (-11%) | 3mo | $170,500 | $111 | 54 |
| 223 Olinger St | 0.45mi | 3/1.5 (-1) | 1,652 (-4%) | 20mo | $140,000 | $85 | 48 |
| 521 Thomas St | 0.46mi | 3/2.0 (-1) | 1,482 (-14%) | 8mo | $225,000 | $152 | 43 |
| 314 Olinger St | 0.45mi | 3/1.5 (-1) | 1,496 (-13%) | 12mo | $130,000 | $87 | 40 |
| 613 North St | 0.51mi | 4/1.0 | 1,882 (+9%) | 22mo | $187,000 | $99 | 39 |
Match score weights: distance 35% · size 25% · config 20% · recency 20%. Top-matched comps best support the ARV.
Projected returns pro-forma
4.11% appreciation · 3.0% rent growth · sell at horizon
- IRR
- 28.4%
- Equity multiple
- 2.70×
- Total profit
- $42,282
- Equity at exit
- $45,722
- IRR
- 27.9%
- Equity multiple
- 5.32×
- Total profit
- $107,562
- Equity at exit
- $75,264
Cash invested: $24,920 (down + closing). Projections, not guarantees.
Landlord ↔ Tenant lean methodology
- Overall (STATE)
- 62 Landlord-Friendly
- State Pennsylvania
- 62 Landlord-Friendly · EVEN
- County
- — inherits STATE
- City
- — inherits STATE
ZIP-level market 15552
- Home prices YoY
- 2.8%
- Active inventory
- 26
- Price-to-rent
- 5.7×
Monthly cashflow live
- Estimated rent
- $1,300 medium interval (Pro) →
- Mortgage (P&I)
- −$467
- Tax from tax record
- −$113 /mo · $1,350/yr
- Insurance
- −$37
- HOA
- −$0
- Vacancy / Maint / Mgmt
- −$273
- Net cashflow
- $411
Break-even live
Sensitivity live
| Price | -10% $461 | -5% $436 | +0% $411 | +5% $386 | +10% $361 |
|---|---|---|---|---|---|
| Rent | -10% $308 | -5% $360 | +0% $411 | +5% $462 | +10% $514 |
| Rate | -1.0pp $456 | -0.5pp $434 | base $411 | +0.5pp $388 | +1.0pp $365 |
UW: 25.0% down · 7.5% · 30yr · 1.5% tax · 5.0% vac · 8.0% maint · 8.0% mgmt
Financing live
Cash to close
- Down payment
- $22,250
- Closing costs
- $2,670
- Reserves months
- —
- Total cash needed
- —
Loan-product check · same deal, 3 products live
Conventional
25% down · 7.5% · 30yr
- Down + closing
- —
- Monthly P&I
- —
- Monthly cashflow
- —
- DSCR
- —
- Eligible?
- —
Personal DTI + credit; lowest rate.
DSCR
20% down · 8.5% · 30yr
- Down + closing
- —
- Monthly P&I
- —
- Monthly cashflow
- —
- DSCR
- —
- Eligible?
- —
No personal income docs; deal must DSCR.
Hard money
10% down · 12.0% · 12mo
- Down + closing
- —
- Monthly P&I
- —
- Monthly cashflow
- —
- DSCR
- —
- Eligible?
- —
Short-term bridge; refi at stabilization.
Listing history 4 events
-
2026-05-22status Pending
-
2026-04-23historical Active Under Contract
-
2026-04-13$89,000 Active
-
1989-07-01soldstatus $40,000
ⓘ Source: listings_history table (triggers on properties + properties_extension) + one-shot
backfill from property_details.listing_events for pre-trigger history.
Tax reassessment forecast PA · Partial reset (capped growth)
- Current annual tax
- $1,350 · $113/mo
- Projected year-2 tax
- $1,378 · $115/mo
- Expected delta
- +$28/yr (+$2/mo · 2.1%)
ⓘ Screening estimate from a state-policy table — verify with the county assessor before closing.
Climate risk First Street
- Flood 4/10 Moderate FEMA zone X (unshaded) · 23% chance over 30 yrs
- Wildfire 3/10 Moderate
- Heat 3/10 Moderate 7 d/yr ≥87°F today · 19 d/yr by 30 yrs out
- Wind 2/10 Low
- Air quality 2/10 Low 1 unhealthy d/yr today · 1 by 30 yrs out
Nearby sold comps map
Loading sold comps map…
Walkable amenities ~0.75 mi
Loading nearby amenities…
Taxation est. · year 1
- Rental income
- $15,606
- − Mortgage interest
- −$4,985
- − Property taxes
- −$1,350
- − Insurance
- −$445
- − Repairs & maintenance
- −$1,248
- − Management
- −$1,248
- − Depreciation
- −$2,589
- Taxable income
- $3,739
- Est. tax owed @ 24.0%
- −$897
- After-tax cash flow
- $4,035/yr
For passive investors: Depreciation is non-cash, so a rental often shows a tax loss while cash-flowing — sheltering income. Rental losses are passive: they offset passive income freely, and up to $25,000/yr can offset ordinary (W-2) income if you actively participate and your MAGI is under $100k (phasing out to $0 by $150k); unused losses carry forward. On sale, claimed depreciation is recaptured at up to 25%, and gains may owe capital-gains tax (a 1031 exchange can defer both). Figures are a year-1 estimate at your 24.0% rate — not tax advice; consult a CPA.
Schools (NCES district)
- District
- Meyersdale Area SD
- NCES district ID
- 4215150
- Math proficiency
- 38% ▼ -12.00%
- Reading proficiency
- 64% ▼ -6.00%
- Median HH income
- $42,823
- Composite
- 42.83/100
- National rank
- #3137
- State rank
- #177 of 539 in PA
Livability — Meyersdale
- Score
- 68/100
- State rank
- #880
- US rank
- #9398
Category grades
Schools grade is shown separately in the Schools card above.
Census & demographics
- Census place
- Meyersdale, PA
- Population (ZIP)
- 5,551
Population outlook (Somerset County) Hauer SSP2
- Today (2025)
- 71,318 people
- By 2030
- 68,555 · -3.9%
- By 2040
- 62,447 · -12.4%
- By 2050
- 56,437 · -20.9%
- By 2075
- 44,453 · -37.7%
- By 2100
- 32,408 · -54.6%
Race, ethnicity, and origin ACS 2023
- Neighborhood character
- Predominantly White (97%)
- Race & ethnicity
- White 97% Two or more races 2%
- Common ancestry
- Iranian 2% Polish 2% Lithuanian 2%
- Languages at home
- 88% English-only · German/W. Germanic 12% Spanish 1%
Political lean MEDSL · Somerset
- 2024 margin
- Solid R (+57.2) · D 21.0% · R 78.3%
- 2008→2024 swing
- -32.2pp toward R · 2008: -25.0pp · 2024: -57.2pp
- All cycles
- 2024: R+57.2 2020: R+56.3 2016: R+55.9 2012: R+42.9 2008: R+25.0
Not yet ingested
- Civics
- —
Market trends
- HPI YoY
- ▲ 4.11%
- Current HPI
- 153.4081
- Rent YoY
- —
- Metro
- —
- State GDP YoY
- ▲ 1.68%
- F500 in state
- 34
Industry mix (Fortune 500 HQ in PA)
| Industry | F500 HQs | Revenue |
|---|---|---|
| Healthcare | 2 | $309B |
|
||
| Insurance | 2 | $27B |
|
||
| Telecommunications / Media | 1 | $124B |
|
||
| Industrial Distribution | 1 | $22B |
|
||
| Financial Services | 1 | $20B |
|
||
| Chemicals / Materials | 1 | $18B |
|
||
Price history
+122.5% since first listed4 events — show timeline
- 2026-05-22 Pending — CSMLS
- 2026-04-23 Contingent — CSMLS
- 2026-04-13 Listed $89,000 CSMLS
- 1989-07-01 Sold (Public Records) $40,000 Public Records
Property tax history
+1.0%/yrLatest (2026): $1,350 · +0.0% YoY. Source: county tax records.
Cash-flow waterfall
monthlySold comps — $/sqft
last 12 mo · ≤1 miLoading sold comps…