 Multi-family
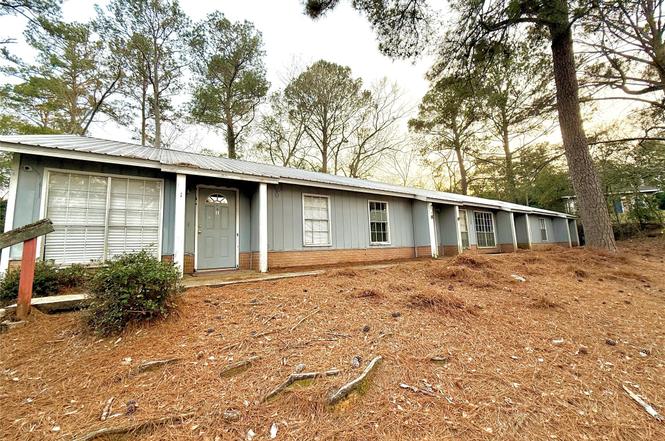
118 Weeks Dr Unit 1-4 · Enterprise, AL
Flood risk 1/10 · Minimal
- FEMA flood zone
- X (unshaded)
- Chance of flooding over 30 yrs
- 0.0%
- Est. flood insurance / yr
- $507 – $1,088
Fire risk 3/10 · Minor
- Est. fire insurance / yr
- $916 – $1,700
Heat risk 8/10 · Major
- Hot days now (above 106°F)
- 7 days/yr
- Hot days in 30 yrs
- 19 days/yr
Wind risk 8/10 · Major
- Chance of severe wind over 30 yrs
- 99.0%
Air-quality risk 1/10 · Minimal
- Unhealthy air days now
- 0 days/yr
- Unhealthy air days in 30 yrs
- 0 days/yr
Risk factors via First Street. Map © Google.
Why this score? — see what drove the B grade
The composite is a weighted blend of 9 inputs, each scored 0–100. Each bar is that input's sub-score; the figure is the points it added to the 100-point composite (weight × sub-score).
- Cash flow +30.0/30.0
- 1% rule +10.0/10.0
- DSCR +10.0/10.0
- ARV discount +7.5/15.0
- Schools +4.3/10.0
- Rent growth +3.5/5.0
- Livability +3.2/5.0
- Condition / age +2.5/5.0
- Appreciation +0.0/10.0
$199,000
🖨 Deal sheet 📄 Offer letter ✓ Due diligence
Multi-family units
County records classify this as Multi-Family (2-4 Unit). Listing-text estimate: 1 unit. estimate disagrees with records
Listing remarks
Four-unit multifamily investment opportunity located in Enterprise, Alabama. This income-producing property features 4 well-designed units, each offering approximately 900 square feet with a functional 2-bedroom, 1-bathroom layout. The interiors provide comfortable living areas, practical kitchen configurations, and appropriately sized bedrooms suited for everyday living. Conveniently positioned just 6.6 miles from the Enterprise gate of Fort Rucker, the location supports strong and consistent rental demand. Residents benefit from easy access to shopping, dining, medical facilities, schools, and major traffic routes throughout Enterprise. With multiple income streams under one roof, this pr
Key facts
- Strong rental demand
- Built 1979
- Listed 95 days
Tags
Property features AI
Finance
- Financial info: Unit rents reported: $525, $525, $550, and one unit listed without rent
Exterior
- Parking: Driveway parking
- Utilities: Public water; Public sewer; Cable available; Electricity available
- Home design: Residential income property; One-level (single-story)
- Construction: HardiPlank siding; Slab foundation
- Exterior features: City lot; Asphalt driveway
Interior
- Kitchen: Eat-in kitchen
- Bedrooms: Four 2-bedroom units (each unit listed as 2 bedrooms)
- Flooring: Carpet; Vinyl
- Bathrooms: Four 1-bath units (each unit listed as 1 bathroom)
- Heating & cooling: Central heating; Hot water heating; Electric heating; Central air conditioning; Electric cooling; Multiple cooling units
- Interior features: Eat-in kitchen
- Laundry & utility: Electric water heater
Neighborhood map
What this means for you Summary
Snapshot
- This is a 8-bed/4.0-bath multifamily listed at $199k.
Deal economics
- At list price, monthly cash flow is $2k ($27k/yr) — positive.
- The deal already cash-flows at list — no discount required.
- Meets the 1% rule at list price ($5k rent vs $199k).
- Recommended offer: $181k (9.0% below list) — sets the bar for market timing.
- Cap rate 19.8% vs local median 4.2% in Enterprise — top-decile yield for the area; either an underpriced asset or a hidden risk that comps aren't pricing in. Stress-test before assuming the spread holds.
Location & tenants
- Location reads 65/100 on livability (#127 in AL) — a middle-class / working-renter tenant base. Strengths: cost of living A+, housing A+; Watch: health & safety D, crime F, amenities F.
- Enterprise City (town): math 40% / reading 60% proficiency, ranked #12 of 129 in AL (top 9%) — acceptable for families but not a draw, mixed tenant base, ~2y average lease.
- Market conditions: Rents rising (+3.9%/yr); 441 active listings in the ZIP; solid renter incomes; 137 units permitted in Coffee County in 2024 (0 in 5+ unit buildings).
- At $4,585/mo this rent would consume 73% of the median local household income ($76k/yr) (locally 1126% of renters already pay >50% of income on rent) — very limited rent-growth headroom before tenants either downsize or default.
Forward outlook
- Local home prices are declining (-3.0%/yr); year-one equity from $1k of loan paydown is wiped out by about $6k of value loss. Plan a longer hold.
- At projected returns (-3.0% appreciation + 3.9% rent growth), your $56k cash investment doubles in ~3 years — after that, you're playing with house money.
Negotiation context
- It's been on market 95 days — a 9% lower offer ($181k) is reasonable based on typical stale-listing flexibility.
Risks & watch-outs
- Climate carrying-cost: severe wind risk, 99% chance of damaging wind over 30y; extreme-heat days projected 7→19/yr by 2055 (HVAC capex compounding) — expect insurance premiums to compound above CPI over the hold.
Questions for the listing agent
- It's been on market 95 days. Have you received any prior offers? Is the seller open to a 9% concession, seller financing, or rate buy-down credit?
- Built in 1979 — when were the roof, HVAC, electrical panel, plumbing, and water heater last replaced?
- Why hasn't it sold? Are there any deal-killer items the seller is aware of (foundation, flood, title, zoning, code violations)?
- Is there a deadline driving the sale (1031 exchange, divorce, estate, relocation)? That informs how much negotiation room exists.
- Crime grade is F in this area — have there been break-ins, vandalism, or insurance claims at this property in the last 3 years? What carrier currently insures it and at what premium?
- What's the average days-on-market for RENTAL listings here right now (not sales)? A rising rental-DOM trend means longer vacancies and softer asking-rent achievability than the comps imply.
- What's the recent tenant-quality profile in this submarket — average credit score on applications, eviction rate, late-payment / NSF rate, and stable-employment percentage? A property-management company in the area should have these aggregated.
- How much new apartment / multifamily construction is in the pipeline within 1–3 miles? Heavy new supply (>2% of stock underway) typically softens rents 12–24 months out; light construction supports rent growth.
Investment metrics
- 1% rule
- 2.30% ✓
- Cap rate
- 19.84%
- Cash-on-cash
- 48.39%
- DSCR
- 3.15
- GRM
- 3.6
CMA / ARV
No comps found within radius.
Show comp detail 2 sales within ~0.75 mi
| Address | Dist | Beds/Ba | Sqft | Sold | Price | $/sf | Match |
|---|---|---|---|---|---|---|---|
| 118 Weeks Dr | 0.00mi | 8/4.0 | 3,600 | 1mo | $205,000 | $57 | 87 |
| 118 Weeks Dr Unit 1-4 | 0.00mi | 8/4.0 | — | 1mo | $205,000 | — | 87 |
Match score weights: distance 35% · size 25% · config 20% · recency 20%. Top-matched comps best support the ARV.
Projected returns pro-forma
-3.0% appreciation · 3.92% rent growth · sell at horizon
- IRR
- 47.0%
- Equity multiple
- 3.07×
- Total profit
- $115,212
- Equity at exit
- $29,672
- IRR
- 53.1%
- Equity multiple
- 6.43×
- Total profit
- $302,785
- Equity at exit
- $17,206
Cash invested: $55,720 (down + closing). Projections, not guarantees.
Landlord ↔ Tenant lean methodology
- Overall (STATE)
- 90 Strongly Landlord-Friendly
- State Alabama
- 90 Strongly Landlord-Friendly · R+15
- County
- — inherits STATE
- City
- — inherits STATE
ZIP-level market 36330
- Home prices YoY
- -19.4%
- Rents YoY
- 3.9%
- Active inventory
- 441
- Price-to-rent
- 14.5×
Monthly cashflow live
- Estimated rent
- $4,585 high interval (Pro) →
- Mortgage (P&I)
- −$1,044
- Tax est. 1.5%
- −$249 /mo · $2,985/yr
- Insurance
- −$83
- HOA
- −$0
- Vacancy / Maint / Mgmt
- −$963
- Net cashflow
- $2,247
Break-even live
4-unit breakdown (identical units grouped — click to expand)
| Units | Beds | Baths | Est. rent |
|---|---|---|---|
| 4× units | 2 | 1 | $4,584 |
| #1 | 2 | 1 | $1,146 |
| #2 | 2 | 1 | $1,146 |
| #3 | 2 | 1 | $1,146 |
| #4 | 2 | 1 | $1,146 |
| Total (4 units) | $4,585 | ||
UW: 25.0% down · 7.5% · 30yr · 1.5% tax · 5.0% vac · 8.0% maint · 8.0% mgmt
Financing live
Cash to close
- Down payment
- $49,750
- Closing costs
- $5,970
- Reserves months
- —
- Total cash needed
- —
Loan-product check · same deal, 3 products live
Conventional
25% down · 7.5% · 30yr
- Down + closing
- —
- Monthly P&I
- —
- Monthly cashflow
- —
- DSCR
- —
- Eligible?
- —
Personal DTI + credit; lowest rate.
DSCR
20% down · 8.5% · 30yr
- Down + closing
- —
- Monthly P&I
- —
- Monthly cashflow
- —
- DSCR
- —
- Eligible?
- —
No personal income docs; deal must DSCR.
Hard money
10% down · 12.0% · 12mo
- Down + closing
- —
- Monthly P&I
- —
- Monthly cashflow
- —
- DSCR
- —
- Eligible?
- —
Short-term bridge; refi at stabilization.
Listing history 7 events
-
2026-06-03status $199,000 Pending 95 DOM
-
2026-06-02days on market $199,000 Active Under Contract 95 DOM
-
2026-06-01days on market $199,000 Active Under Contract 94 DOM
-
2026-05-31days on market $199,000 Active Under Contract 93 DOM
-
2026-05-30days on market $199,000 Active Under Contract 92 DOM
-
2026-03-03historical Active Under Contract
-
2026-02-26$199,000 Active
ⓘ Source: listings_history table (triggers on properties + properties_extension) + one-shot
backfill from property_details.listing_events for pre-trigger history.
Climate risk First Street
- Flood 1/10 Low FEMA zone X (unshaded) · 0% chance over 30 yrs
- Wildfire 3/10 Moderate
- Heat 8/10 Severe 7 d/yr ≥106°F today · 19 d/yr by 30 yrs out
- Wind 8/10 Severe 99% chance of damaging wind over 30 yrs
- Air quality 1/10 Low 0 unhealthy d/yr today · 0 by 30 yrs out
Nearby sold comps map
Loading sold comps map…
Walkable amenities ~0.75 mi
Loading nearby amenities…
Taxation est. · year 1
- Rental income
- $55,020
- − Mortgage interest
- −$11,147
- − Property taxes
- −$2,985
- − Insurance
- −$995
- − Repairs & maintenance
- −$4,402
- − Management
- −$4,402
- − Depreciation
- −$5,789
- Taxable income
- $25,301
- Est. tax owed @ 24.0%
- −$6,072
- After-tax cash flow
- $20,891/yr
For passive investors: Depreciation is non-cash, so a rental often shows a tax loss while cash-flowing — sheltering income. Rental losses are passive: they offset passive income freely, and up to $25,000/yr can offset ordinary (W-2) income if you actively participate and your MAGI is under $100k (phasing out to $0 by $150k); unused losses carry forward. On sale, claimed depreciation is recaptured at up to 25%, and gains may owe capital-gains tax (a 1031 exchange can defer both). Figures are a year-1 estimate at your 24.0% rate — not tax advice; consult a CPA.
Schools (NCES district)
- District
- Enterprise City
- NCES district ID
- 0101320
- Math proficiency
- 40% ▼ -20.00%
- Reading proficiency
- 60% ▲ 4.00%
- Median HH income
- $51,311
- Composite
- 42.83/100
- National rank
- #3136
- State rank
- #12 of 129 in AL
Livability — Enterprise
- Score
- 65/100
- State rank
- #127
- US rank
- #12953
Category grades
Schools grade is shown separately in the Schools card above.
Census & demographics
- Census place
- Enterprise, AL
- County
- Coffee County · 39,557 people
- City population
- 39,557
- Metro
- Enterprise, AL
- Population (ZIP)
- 39,557
- Household income
- $75,765
- Rent vs Own
- Severe rent burden
- 1126.0
Population outlook (Coffee County) Hauer SSP2
- Today (2025)
- 53,133 people
- By 2030
- 53,832 · +1.3%
- By 2040
- 54,504 · +2.6%
- By 2050
- 54,289 · +2.2%
- By 2075
- 51,175 · -3.7%
- By 2100
- 46,793 · -11.9%
Race, ethnicity, and origin ACS 2023
- Neighborhood character
- Diverse neighborhood (Simpson 0.56)
- Race & ethnicity
- White 63% Black 17% Hispanic / Latino 13% Two or more races 9% Asian 1%
- Hispanic origin (detail)
- Mexican 6% Puerto Rican 3%
- Common ancestry
- Italian 3% Lithuanian 2% Serbian 2%
- Foreign-born
- 6% · Canada, Vietnam, South Korea
- Languages at home
- 89% English-only · Spanish 8% German/W. Germanic 2%
Political lean MEDSL · Coffee
- 2024 margin
- Solid R (+57.9) · D 20.7% · R 78.6%
- 2008→2024 swing
- -9.0pp toward R · 2008: -48.9pp · 2024: -57.9pp
- All cycles
- 2024: R+57.9 2020: R+53.1 2016: R+56.7 2012: R+49.4 2008: R+48.9
Not yet ingested
- Civics
- —
Market trends
- HPI YoY
- ▼ -44.44%
- Current HPI
- 184.0163
- Rent YoY
- ▲ 3.92%
- Metro
- Enterprise, AL
- State GDP YoY
- ▲ 2.94%
- F500 in state
- 4
Industry mix (Fortune 500 HQ in AL)
| Industry | F500 HQs | Revenue |
|---|---|---|
| Financial Services | 1 | $8B |
|
||
| Healthcare | 1 | $5B |
|
||
Price history
2 events — show timeline
- 2026-03-03 Contingent — WBR
- 2026-02-26 Listed $199,000 WBR
Cash-flow waterfall
monthlySold comps — $/sqft
last 12 mo · ≤1 miLoading sold comps…