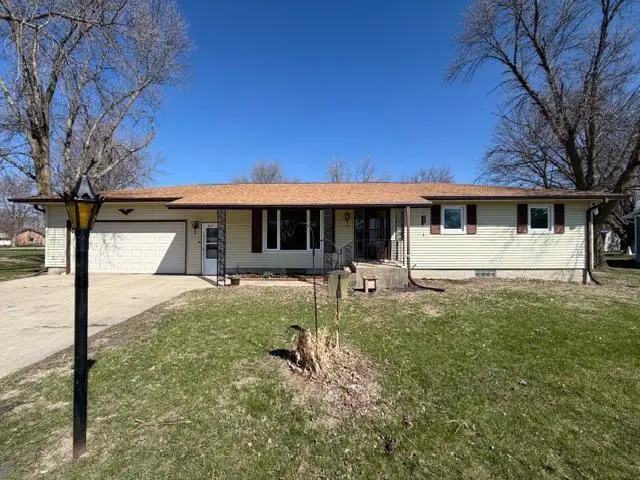
447 2nd Ave SW · Winnebago, MN
Flood risk 1/10 · Minimal
- FEMA flood zone
- —
- Chance of flooding over 30 yrs
- 0.0%
- Est. flood insurance / yr
- —
Fire risk 1/10 · Minimal
- Est. fire insurance / yr
- $888 – $1,650
Heat risk 2/10 · Minimal
- Hot days now (above 99°F)
- 7 days/yr
- Hot days in 30 yrs
- 15 days/yr
Wind risk 2/10 · Minimal
- Chance of severe wind over 30 yrs
- —
Air-quality risk 2/10 · Minimal
- Unhealthy air days now
- 1 days/yr
- Unhealthy air days in 30 yrs
- 1 days/yr
Risk factors via First Street. Map © Google.
Why this score? — see what drove the B- grade
The composite is a weighted blend of 9 inputs, each scored 0–100. Each bar is that input's sub-score; the figure is the points it added to the 100-point composite (weight × sub-score).
- Cash flow +23.1/30.0
- Appreciation +9.7/10.0
- ARV discount +7.5/15.0
- DSCR +7.4/10.0
- 1% rule +5.7/10.0
- Livability +3.8/5.0
- Schools +3.1/10.0
- Rent growth +2.5/5.0
- Condition / age +2.5/5.0
$149,900
🖨 Deal sheet (PDF) 📄 Offer letter ✓ Due diligence
Listing remarks
Affordably priced home in a quiet Winnebago location featuring spacious living areas, good natural light, and a functional layout. Situated on an almost half-acre lot with plenty of outdoor space. Great opportunity for homeowners or investors!
Key facts
- 0.49 acre lot
- 2 garage spots
- Built 1977
Property features AI
Exterior
- Parking: Attached 2-car garage (26 x 24)
- Utilities: City water connected; City sewer connected; Natural gas
- Home design: Residential property; One story (single level)
- Construction: Block foundation
- Exterior features: Vinyl exterior; Patio
Interior
- Kitchen: Range; Refrigerator; Kitchen window
- Bedrooms: 3 bedrooms
- Bathrooms: 1 full bathroom; 1 half bathroom (half bath on main floor; full bath in basement)
- Heating & cooling: Forced air heating; Central air conditioning
- Interior features: Kitchen window; Patio
- Laundry & utility: Washer; Dryer
Neighborhood map
What this means for you Summary
Snapshot
- This is a 3-bed/1.5-bath single-family listed at $150k.
Deal economics
- At list price, monthly cash flow is $268 ($3k/yr) — positive.
- The deal already cash-flows at list — no discount required.
- Meets the 1% rule at list price ($2k rent vs $150k).
- Recommended offer: $145k (3.0% below list) — sets the bar for market timing.
Location & tenants
- Location reads 76/100 on livability (#162 in MN, #3,494 nationally) — a middle-class / working-renter tenant base. Strengths: crime A+, cost of living A+, housing A+; Watch: employment C-, amenities F, commute F.
- Blue Earth Area Public School (town): math 29% / reading 44% proficiency, ranked #245 of 301 in MN (top 81%) — families likely to look elsewhere, expect single-tenant / working-renter base with shorter leases.
- Market conditions: 11 active listings in the ZIP; 1 comparable units currently listed for rent nearby; 4 units permitted in Faribault County in 2024 (0 in 5+ unit buildings).
Forward outlook
- In year one you build about $15k of equity ($1k loan paydown + $14k appreciation (9.4% local appreciation)).
- Faribault County population projected at -11% by 2050 — secular population decline; favor cash flow + early exit over multi-decade hold.
- At projected returns (9.4% appreciation + 3.0% rent growth), your $42k cash investment doubles in ~3 years — after that, you're playing with house money.
- By year 3, paydown + projected appreciation supports a ~$38k cash-out refi (75% LTV) — recoverable capital for the next deal without selling this one.
Negotiation context
- It's been on market 58 days — a 3% lower offer ($145k) is reasonable based on typical stale-listing flexibility.
- 2 sale attempts; this cycle's ask has dropped $20k (12%) from the opening price — seller is motivated, your offer sets the floor, not the list.
- Current owner paid $101k; 48% above their basis — modest negotiation headroom, anchor on the comps not their cost.
Questions for the listing agent
- It's been on market 58 days. Have you received any prior offers? Is the seller open to a 3% concession, seller financing, or rate buy-down credit?
- Built in 1977 — when were the roof, HVAC, electrical panel, plumbing, and water heater last replaced?
- Is there a deadline driving the sale (1031 exchange, divorce, estate, relocation)? That informs how much negotiation room exists.
- Schools are B-rated — typically a magnet for longer-tenancy family renters. What's the average tenant stay here, and is there a school-zone premium baked into asking?
- What's the average days-on-market for RENTAL listings here right now (not sales)? A rising rental-DOM trend means longer vacancies and softer asking-rent achievability than the comps imply.
- What's the recent tenant-quality profile in this submarket — average credit score on applications, eviction rate, late-payment / NSF rate, and stable-employment percentage? A property-management company in the area should have these aggregated.
- How much new for-sale + rental construction is in the pipeline within 1–3 miles? Heavy new supply typically softens prices + rents 12–24 months out; constrained supply supports both.
Investment metrics
- 1% rule
- 1.07% ✓
- Cap rate
- 8.44%
- Cash-on-cash
- 7.65%
- DSCR
- 1.34
- GRM
- 7.8
CMA / ARV
- ARV (on-the-fly)
- $88,504
- Comps found
- 3
Show comp detail 3 sales within ~0.75 mi
| Address | Dist | Beds/Ba | Sqft | Sold | Price | $/sf | Match |
|---|---|---|---|---|---|---|---|
| 205 4th Street St NW | 0.32mi | 2/1.0 (-1) | 1,168 (-2%) | 10mo | $130,000 | $111 | 66 |
| 151 SW 1st Ave Ave | 0.29mi | 2/1.0 (-1) | 1,145 (-4%) | 11mo | $70,000 | $61 | 63 |
| 54 SE 6th Ave | 0.66mi | 2/1.0 (-1) | 1,256 (+5%) | 13mo | $93,000 | $74 | 43 |
Match score weights: distance 35% · size 25% · config 20% · recency 20%. Top-matched comps best support the ARV.
Projected returns pro-forma
9.36% appreciation · 3.0% rent growth · sell at horizon
- IRR
- 28.6%
- Equity multiple
- 3.19×
- Total profit
- $92,126
- Equity at exit
- $128,066
- IRR
- 25.1%
- Equity multiple
- 7.11×
- Total profit
- $256,387
- Equity at exit
- $269,077
Cash invested: $41,972 (down + closing). Projections, not guarantees.
Landlord ↔ Tenant lean methodology
- Overall (STATE)
- 46 Balanced
- State Minnesota
- 46 Balanced · D+2
- County
- — inherits STATE
- City
- — inherits STATE
ZIP-level market 56098
- Home prices YoY
- 3.4%
- Active inventory
- 11
- Price-to-rent
- 7.8×
Monthly cashflow live
- Estimated rent
- $1,600 medium interval (Pro) →
- Mortgage (P&I)
- −$786
- Tax from tax record
- −$148 /mo · $1,774/yr
- Insurance
- −$62
- HOA
- −$0
- Vacancy / Maint / Mgmt
- −$336
- Net cashflow
- $268
Break-even live
Sensitivity live
| Price | -10% $352 | -5% $310 | +0% $268 | +5% $225 | +10% $183 |
|---|---|---|---|---|---|
| Rent | -10% $141 | -5% $204 | +0% $268 | +5% $331 | +10% $394 |
| Rate | -1.0pp $343 | -0.5pp $306 | base $268 | +0.5pp $229 | +1.0pp $189 |
UW: 25.0% down · 7.5% · 30yr · 1.5% tax · 5.0% vac · 8.0% maint · 8.0% mgmt
Financing live
Cash to close
- Down payment
- $37,475
- Closing costs
- $4,497
- Reserves months
- —
- Total cash needed
- —
Loan-product check · same deal, 3 products live
Conventional
25% down · 7.5% · 30yr
- Down + closing
- —
- Monthly P&I
- —
- Monthly cashflow
- —
- DSCR
- —
- Eligible?
- —
Personal DTI + credit; lowest rate.
DSCR
20% down · 8.5% · 30yr
- Down + closing
- —
- Monthly P&I
- —
- Monthly cashflow
- —
- DSCR
- —
- Eligible?
- —
No personal income docs; deal must DSCR.
Hard money
10% down · 12.0% · 12mo
- Down + closing
- —
- Monthly P&I
- —
- Monthly cashflow
- —
- DSCR
- —
- Eligible?
- —
Short-term bridge; refi at stabilization.
Rent comps 1 comps
| Address | Beds | Baths | Sqft | Rent | $/sqft | DOM | Units | Dist |
|---|---|---|---|---|---|---|---|---|
| 233 4th St NW Winnebago, MN | 4.0 | 2.0 | 1500 | $1,600 | $1.07 | 44d | 1 | 0.34mi |
Listing history 14 events
-
2026-06-05statusdays on market $149,900 Pending 58 DOM
-
2026-06-04days on market $149,900 Active 57 DOM
-
2026-06-02days on market $149,900 Active 56 DOM
-
2026-06-01days on market $149,900 Active 55 DOM
-
2026-05-31days on market $149,900 Active 54 DOM
-
2026-05-31days on market $149,900 Active 53 DOM
-
2026-05-06price $149,900
-
2026-04-22price $159,900
-
2026-04-07$169,900 Active
-
2026-01-14historical $1,425
-
2025-12-30soldstatus $101,100
-
2025-12-16$1,425
-
2012-06-04soldstatus $41,000
-
2004-01-30soldstatus $48,000
ⓘ Source: listings_history table (triggers on properties + properties_extension) + one-shot
backfill from property_details.listing_events for pre-trigger history.
Tax reassessment forecast MN · Partial reset (capped growth)
- Current annual tax
- $1,774 · $148/mo
- Projected year-2 tax
- $1,774 · $148/mo
- Expected delta
- $0/yr ($0/mo · 0.0%)
ⓘ Screening estimate from a state-policy table — verify with the county assessor before closing.
Climate risk First Street
- Flood 1/10 Low 0% chance over 30 yrs
- Wildfire 1/10 Low
- Heat 2/10 Low 7 d/yr ≥99°F today · 15 d/yr by 30 yrs out
- Wind 2/10 Low
- Air quality 2/10 Low 1 unhealthy d/yr today · 1 by 30 yrs out
Nearby sold comps map
Loading sold comps map…
Walkable amenities ~0.75 mi
Loading nearby amenities…
Taxation est. · year 1
- Rental income
- $19,200
- − Mortgage interest
- −$8,397
- − Property taxes
- −$1,774
- − Insurance
- −$750
- − Repairs & maintenance
- −$1,536
- − Management
- −$1,536
- − Depreciation
- −$4,361
- Taxable income
- $847
- Est. tax owed @ 24.0%
- −$203
- After-tax cash flow
- $3,008/yr
For passive investors: Depreciation is non-cash, so a rental often shows a tax loss while cash-flowing — sheltering income. Rental losses are passive: they offset passive income freely, and up to $25,000/yr can offset ordinary (W-2) income if you actively participate and your MAGI is under $100k (phasing out to $0 by $150k); unused losses carry forward. On sale, claimed depreciation is recaptured at up to 25%, and gains may owe capital-gains tax (a 1031 exchange can defer both). Figures are a year-1 estimate at your 24.0% rate — not tax advice; consult a CPA.
Schools (NCES district)
- District
- Blue Earth Area Public School
- NCES district ID
- 2700130
- Math proficiency
- 29% ▼ -19.00%
- Reading proficiency
- 44% ▼ -10.00%
- Median HH income
- $44,434
- Composite
- 31.0/100
- National rank
- #6095
- State rank
- #245 of 301 in MN
Livability — Winnebago
- Score
- 76/100
- State rank
- #162
- US rank
- #3494
Category grades
Schools grade is shown separately in the Schools card above.
Census & demographics
- Census place
- Winnebago, MN
- Population (ZIP)
- 1,946
Population outlook (Faribault County) Hauer SSP2
- Today (2025)
- 13,474 people
- By 2030
- 13,112 · -2.7%
- By 2040
- 12,454 · -7.6%
- By 2050
- 11,973 · -11.1%
- By 2075
- 11,565 · -14.2%
- By 2100
- 10,844 · -19.5%
Race, ethnicity, and origin ACS 2023
- Neighborhood character
- Predominantly White (83%)
- Race & ethnicity
- White 83% Hispanic / Latino 14% Two or more races 11%
- Hispanic origin (detail)
- Mexican 12%
- Common ancestry
- Portuguese 12% Slovak 3% Romanian 2%
- Foreign-born
- 3% · Canada
- Languages at home
- 90% English-only · Spanish 9%
Political lean MEDSL · Faribault
- 2024 margin
- Solid R (+37.4) · D 30.4% · R 67.8% · Other 1.8%
- 2008→2024 swing
- -31.8pp toward R · 2008: -5.6pp · 2024: -37.4pp
- All cycles
- 2024: R+37.4 2020: R+33.6 2016: R+34.1 2012: R+9.1 2008: R+5.6
Not yet ingested
- Civics
- —
Market trends
- HPI YoY
- ▲ 9.36%
- Current HPI
- 281.463
- Rent YoY
- —
- Metro
- —
- State GDP YoY
- ▲ 2.41%
- F500 in state
- 34
Industry mix (Fortune 500 HQ in MN)
| Industry | F500 HQs | Revenue |
|---|---|---|
| Healthcare | 2 | $407B |
|
||
| Retail | 2 | $150B |
|
||
| Consumer Goods | 2 | $32B |
|
||
| Industrial Machinery | 2 | $6B |
|
||
| Agriculture | 1 | $40B |
|
||
| Healthcare / Medical Devices | 1 | $32B |
|
||
Price history
+212.3% since first listed8 events — show timeline
- 2026-05-06 Price Changed $149,900 NORTHSTARMLS as Distributed by MLS Grid
- 2026-04-22 Price Changed $159,900 NORTHSTARMLS as Distributed by MLS Grid
- 2026-04-07 Listed $169,900 NORTHSTARMLS as Distributed by MLS Grid
- 2026-01-14 Rental Removed $1,425 Avail
- 2025-12-30 Sold (Public Records) $101,100 Public Records
- 2025-12-16 Listed for Rent $1,425 Avail
- 2012-06-04 Sold (Public Records) $41,000 Public Records
- 2004-01-30 Sold (Public Records) $48,000 Public Records
Property tax history
+9.1%/yrLatest (2025): $1,774 · -8.1% YoY. Source: county tax records.
Cash-flow waterfall
monthlySold comps — $/sqft
last 12 mo · ≤1 miLoading sold comps…