34 Vistara Dr · Rancho Mirage, CA
Flood risk 1/10 · Minimal
- FEMA flood zone
- X
- Chance of flooding over 30 yrs
- 0.0%
- Est. flood insurance / yr
- $507 – $1,088
Fire risk 5/10 · Moderate
- Est. fire insurance / yr
- $659 – $1,223
Heat risk 9/10 · Severe
- Hot days now (above 114°F)
- 7 days/yr
- Hot days in 30 yrs
- 21 days/yr
Wind risk 1/10 · Minimal
- Chance of severe wind over 30 yrs
- —
Air-quality risk 4/10 · Minor
- Unhealthy air days now
- 5 days/yr
- Unhealthy air days in 30 yrs
- 6 days/yr
Risk factors via First Street. Map © Google.
Why this score? — see what drove the C grade
The composite is a weighted blend of 9 inputs, each scored 0–100. Each bar is that input's sub-score; the figure is the points it added to the 100-point composite (weight × sub-score).
- Cash flow +18.4/30.0
- ARV discount +13.8/15.0
- DSCR +5.8/10.0
- 1% rule +4.9/10.0
- Schools +3.8/10.0
- Rent growth +3.4/5.0
- Livability +2.6/5.0
- Condition / age +2.5/5.0
- Appreciation +0.0/10.0
$625,000
🖨 Deal sheet (PDF) 📄 Offer letter ✓ Due diligence
Listing remarks MLS
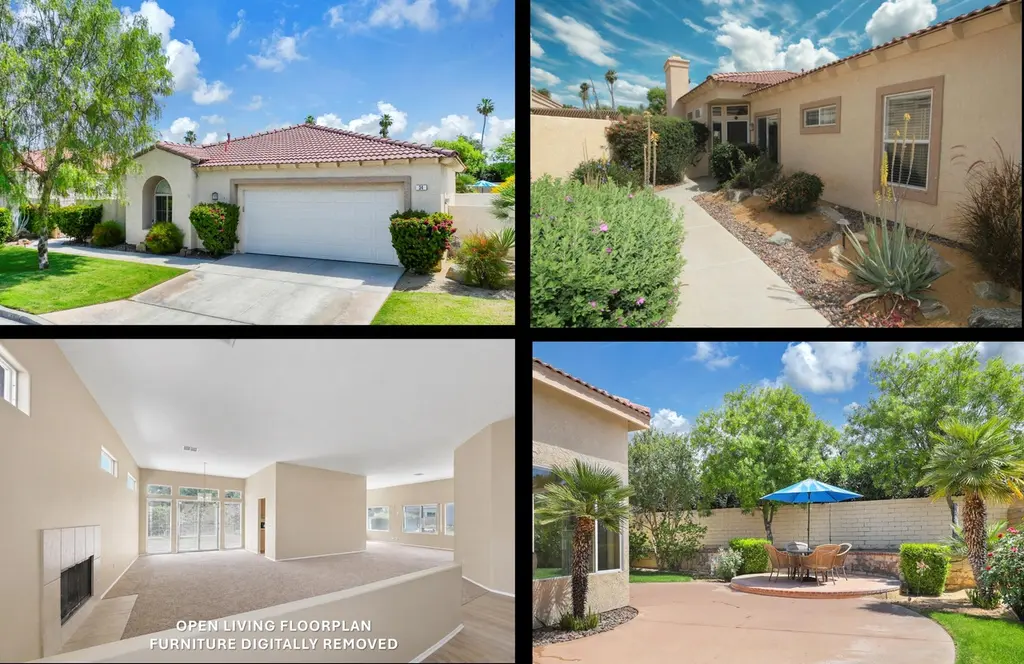
Are you ready for a simpler lifestyle with minimal upkeep? Or maybe a stylish getaway that you can lock and leave with peace of mind? This is the home and the community for you. Welcome to 34 Vistara; located in the Gated Community of The Estates at Rancho Mirage, a small enclave of just 88 homes. This is a Hidden Gem in the Desert real estate scene with one of the best locations in the valley. Close to both The River, and El Paseo. The low HOA includes front landscape maintenance, 2 Pools, Spas, Sauna, Park, and beautiful community landscaping throughout. This is an Open Floor Plan that flows easily from Inside to Outdoor Living, with a very private backyard, large enough to add a private pool, but no need - both of the community pools are close. This is your opportunity to own a piece of paradise in one of the valley's most desirable communities.
Key facts
- Low hoas
- Close to dining
- Community pools
Tags
Neighborhood map
What this means for you Summary
Snapshot
- This is a 3-bed/2.0-bath single-family listed at $625k.
Deal economics
- At list price, monthly cash flow is $586 ($7k/yr) — positive.
- The deal already cash-flows at list — no discount required.
- To meet the 1% rule (rent ≥ 1% of price), the offer needs to be $617k (1.2% below list).
- Recommended offer: $588k (6.0% below list) — sets the bar for market timing.
- Cap rate 7.4% vs local median 3.0% in Rancho Mirage — top-decile yield for the area; either an underpriced asset or a hidden risk that comps aren't pricing in. Stress-test before assuming the spread holds.
Location & tenants
- Location reads 51/100 on livability (#1,065 in CA) — a working-class tenant base; expect higher turnover. Strengths: employment A+; Watch: amenities F, commute F, cost of living F.
- Desert Sands Unified (suburban): math 31% / reading 56% proficiency, ranked #199 of 517 in CA (top 38%) — families likely to look elsewhere, expect single-tenant / working-renter base with shorter leases.
- Market conditions: Rents rising (+3.7%/yr); 529 active listings in the ZIP; 40 comparable units currently listed for rent nearby; rentals lingering (median 44d on market — plan ~5-8 weeks vacancy on turnover, expect pricing pressure); 80% of comp listings sitting > 30 days — soft ceiling on asking rent; solid renter incomes; 9,195 units permitted in Riverside County in 2024 (1,512 in 5+ unit buildings).
- At $6,174/mo this rent would consume 69% of the median local household income ($107k/yr) (locally 498% of renters already pay >50% of income on rent) — very limited rent-growth headroom before tenants either downsize or default.
Forward outlook
- Local home prices are declining (-3.0%/yr); year-one equity from $4k of loan paydown is wiped out by about $19k of value loss. Plan a longer hold.
- Riverside County population projected at +22% by 2050 — long-run rental-demand tailwind backs the buy-and-hold thesis.
Negotiation context
- It's been on market 76 days — a 6% lower offer ($588k) is reasonable based on typical stale-listing flexibility.
- Current owner paid $175k; list at $625k implies a 257% gain — meaningful room to come down on a strong offer.
Risks & watch-outs
- Climate carrying-cost: moderate wildfire risk; extreme-heat days projected 7→21/yr by 2055 (HVAC capex compounding) — expect insurance premiums to compound above CPI over the hold.
Questions for the listing agent
- It's been on market 76 days. Have you received any prior offers? Is the seller open to a 6% concession, seller financing, or rate buy-down credit?
- What does the HOA fee cover, when was the last increase, and are there any pending special assessments or reserve-fund shortfalls?
- Why hasn't it sold? Are there any deal-killer items the seller is aware of (foundation, flood, title, zoning, code violations)?
- Is there a deadline driving the sale (1031 exchange, divorce, estate, relocation)? That informs how much negotiation room exists.
- What's the average days-on-market for RENTAL listings here right now (not sales)? A rising rental-DOM trend means longer vacancies and softer asking-rent achievability than the comps imply.
- What's the recent tenant-quality profile in this submarket — average credit score on applications, eviction rate, late-payment / NSF rate, and stable-employment percentage? A property-management company in the area should have these aggregated.
- How much new for-sale + rental construction is in the pipeline within 1–3 miles? Heavy new supply typically softens prices + rents 12–24 months out; constrained supply supports both.
Investment metrics
- 1% rule
- 0.99% ✗
- Cap rate
- 7.42%
- Cash-on-cash
- 4.02%
- DSCR
- 1.18
- GRM
- 8.4
CMA / ARV
- ARV (median comp)
- $726,999
- List price
- $625,000
- Delta
- -14.03%
- Verdict
- UNDERPRICED
- Comps
- 20 within 1.0 mi
Show comp detail 12 sales within ~0.75 mi
| Address | Dist | Beds/Ba | Sqft | Sold | Price | $/sf | Match |
|---|---|---|---|---|---|---|---|
| 25 Vistara Dr | 0.06mi | 3/2.0 | 2,079 (0%) | 6mo | $740,000 | $356 | 92 |
| 1 Novato Ter | 0.09mi | 3/2.0 | 2,120 (+2%) | 8mo | $960,000 | $453 | 85 |
| 15 Florentina Dr | 0.16mi | 3/3.0 | 2,142 (+3%) | 2mo | $745,000 | $348 | 82 |
| 16 White Sun Way | 0.23mi | 3/2.0 | 2,078 (-0%) | 10mo | $820,000 | $395 | 80 |
| 2 Vistara Dr | 0.18mi | 3/2.0 | 2,120 (+2%) | 11mo | $620,000 | $292 | 79 |
| 32 Vistara Dr | 0.01mi | 3/2.0 | 1,848 (-11%) | 5mo | $604,000 | $327 | 77 |
| 22 Vistara Dr | 0.07mi | 3/2.0 | 1,848 (-11%) | 3mo | $675,000 | $365 | 76 |
| 5 Novato Ter | 0.11mi | 3/2.0 | 1,848 (-11%) | 12mo | $564,500 | $305 | 66 |
| 465 Monte Vis | 0.34mi | 3/3.0 | 1,927 (-7%) | 2mo | $680,000 | $353 | 66 |
| 72794 Rancho Grande Dr | 0.74mi | 3/2.0 | 2,008 (-3%) | 0mo | $528,000 | $263 | 60 |
| 72815 Tampico Dr | 0.72mi | 3/2.0 | 1,999 (-4%) | 7mo | $590,000 | $295 | 54 |
| 72278 Barbara Dr | 0.51mi | 3/2.0 | 2,288 (+10%) | 14mo | $1,640,000 | $717 | 48 |
Match score weights: distance 35% · size 25% · config 20% · recency 20%. Top-matched comps best support the ARV.
Projected returns pro-forma
-3.0% appreciation · 3.72% rent growth · sell at horizon
- IRR
- -9.2%
- Equity multiple
- 0.66×
- Total profit
- $-59,346
- Equity at exit
- $93,190
- IRR
- 1.2%
- Equity multiple
- 1.09×
- Total profit
- $15,481
- Equity at exit
- $54,039
Cash invested: $175,000 (down + closing). Projections, not guarantees.
Landlord ↔ Tenant lean methodology
- Overall (STATE)
- 18 Strongly Tenant-Friendly
- State California
- 18 Strongly Tenant-Friendly · D+13
- County
- — inherits STATE
- City
- — inherits STATE
ZIP-level market 92270
- Rents YoY
- 3.7%
- Active inventory
- 529
- Price-to-rent
- 8.4×
Monthly cashflow live
- Estimated rent
- $6,174 high interval (Pro) →
- Mortgage (P&I)
- −$3,278
- Tax from tax record
- −$373 /mo · $4,474/yr
- Insurance
- −$260
- HOA
- −$380
- Vacancy / Maint / Mgmt
- −$1,296
- Net cashflow
- $586
Break-even live
Sensitivity live
| Price | -10% $940 | -5% $763 | +0% $586 | +5% $410 | +10% $233 |
|---|---|---|---|---|---|
| Rent | -10% $99 | -5% $343 | +0% $586 | +5% $830 | +10% $1,074 |
| Rate | -1.0pp $901 | -0.5pp $745 | base $586 | +0.5pp $424 | +1.0pp $260 |
UW: 25.0% down · 7.5% · 30yr · 1.5% tax · 5.0% vac · 8.0% maint · 8.0% mgmt
Financing live
Cash to close
- Down payment
- $156,250
- Closing costs
- $18,750
- Reserves months
- —
- Total cash needed
- —
Loan-product check · same deal, 3 products live
Conventional
25% down · 7.5% · 30yr
- Down + closing
- —
- Monthly P&I
- —
- Monthly cashflow
- —
- DSCR
- —
- Eligible?
- —
Personal DTI + credit; lowest rate.
DSCR
20% down · 8.5% · 30yr
- Down + closing
- —
- Monthly P&I
- —
- Monthly cashflow
- —
- DSCR
- —
- Eligible?
- —
No personal income docs; deal must DSCR.
Hard money
10% down · 12.0% · 12mo
- Down + closing
- —
- Monthly P&I
- —
- Monthly cashflow
- —
- DSCR
- —
- Eligible?
- —
Short-term bridge; refi at stabilization.
Rent comps 40 comps
| Address | Beds | Baths | Sqft | Rent | $/sqft | DOM | Units | Dist |
|---|---|---|---|---|---|---|---|---|
| 159 Torremolinos Dr Rancho Mirage, CA | 2.0 | 2.0 | 1513 | $6,100 | $4.03 | 44d | 1 | 0.04mi |
| 70 Durango Cir Rancho Mirage, CA | 2.0 | 2.0 | 1500 | $3,800 | $2.53 | 15d | 1 | 0.13mi |
| 11 Ronda Dr Rancho Mirage, CA | 3.0 | 2.0 | 1680 | $3,200 | $1.90 | 44d | 1 | 0.13mi |
| 95 Torremolinos Dr Rancho Mirage, CA | 3.0 | 2.0 | 1680 | $3,600 | $2.14 | 19d | 1 | 0.22mi |
| 27 Torremolinos Dr Rancho Mirage, CA | 3.0 | 1.5 | 1621 | $3,300 | $2.04 | 44d | 1 | 0.27mi |
| 142 Avenida Las Palmas Rancho Mirage, CA | 3.0 | 2.5 | 2209 | $7,395 | $3.35 | 44d | 1 | 0.28mi |
| 72408 Desert Dr Rancho Mirage, CA | 3.0 | 3.0 | 2328 | $10,500 | $4.51 | 44d | 1 | 0.32mi |
| 16 Tortosa Dr Rancho Mirage, CA | 3.0 | 2.0 | 1720 | $7,495 | $4.36 | 44d | 1 | 0.32mi |
| 128 Castellana W Palm Desert, CA | 2.0 | 2.0 | 1670 | $6,500 | $3.89 | 44d | 1 | 0.32mi |
| 126 Castellana W Palm Desert, CA | 2.0 | 2.0 | 2208 | $6,400 | $2.90 | 44d | 1 | 0.32mi |
| 72382 Desert Dr Rancho Mirage, CA | 4.0 | 4.0 | 2543 | $14,995 | $5.90 | 19d | 1 | 0.35mi |
| 81 Marbella Dr Rancho Mirage, CA | 2.0 | 2.0 | 1582 | $5,500 | $3.48 | 44d | 1 | 0.35mi |
| 117 Juan Cir Palm Desert, CA | 2.0 | 2.0 | 1584 | $6,800 | $4.29 | 44d | 1 | 0.38mi |
| 101 Juan Cir Palm Desert, CA | 2.0 | 2.0 | 1600 | $6,500 | $4.06 | 44d | 1 | 0.40mi |
| 138 Gran Via Palm Desert, CA | 2.0 | 2.0 | 1457 | $5,500 | $3.77 | 44d | 1 | 0.41mi |
| 110 Giralda Cir Palm Desert, CA | 2.0 | 2.0 | 1584 | $7,000 | $4.42 | 44d | 1 | 0.42mi |
| 27 Calle Encinitas Rancho Mirage, CA | 2.0 | 2.0 | 1537 | $2,200 | $1.43 | 24d | 1 | 0.45mi |
| 173 Gran Via Palm Desert, CA | 2.0 | 2.0 | 1584 | $5,000 | $3.16 | 44d | 1 | 0.47mi |
| 175 Gran Via Palm Desert, CA | 2.0 | 2.0 | 1656 | $2,599 | $1.57 | 6d | 1 | 0.47mi |
| 172 Gran Via Palm Desert, CA | 2.0 | 1.5 | 1584 | $7,000 | $4.42 | 44d | 1 | 0.50mi |
| 184 Castellana S Palm Desert, CA | 2.0 | 2.0 | 1457 | $5,400 | $3.71 | 44d | 1 | 0.51mi |
| 191 Madrid Ave Palm Desert, CA | 2.0 | 2.0 | 1800 | $5,500 | $3.06 | 44d | 1 | 0.56mi |
| 293 Serena Dr Palm Desert, CA | 2.0 | 2.0 | 1670 | $5,500 | $3.29 | 44d | 1 | 0.56mi |
| 186 Madrid Ave Palm Desert, CA | 2.0 | 2.0 | 1800 | $7,100 | $3.94 | 44d | 1 | 0.59mi |
| 222 Castellana S Palm Desert, CA | 2.0 | 2.5 | 1656 | $7,700 | $4.65 | 44d | 1 | 0.63mi |
| 224 Castellana S Palm Desert, CA | 2.0 | 2.0 | 1457 | $5,300 | $3.64 | 44d | 1 | 0.64mi |
| 73073 Santa Rosa Way Palm Desert, CA | 3.0 | 2.0 | 1596 | $2,750 | $1.72 | 44d | 1 | 0.67mi |
| 236 Castellana S Palm Desert, CA | 2.0 | 2.0 | 1684 | $8,000 | $4.75 | 44d | 1 | 0.67mi |
| 294 San Vicente Cir Palm Desert, CA | 2.0 | 2.0 | 1584 | $5,300 | $3.35 | 44d | 1 | 0.68mi |
| 278 San Vicente Cir Palm Desert, CA | 2.0 | 2.0 | 1656 | $5,200 | $3.14 | 44d | 1 | 0.71mi |
| 261 Santa Barbara Cir Palm Desert, CA | 2.0 | 2.0 | 1656 | $5,800 | $3.50 | 44d | 1 | 0.73mi |
| 41 Don Quixote Dr Rancho Mirage, CA | 3.0 | 2.0 | 1995 | $3,600 | $1.80 | 25d | 1 | 0.75mi |
| 223 Serena Dr Palm Desert, CA | 3.0 | 2.0 | 1584 | $4,800 | $3.03 | 18d | 1 | 0.77mi |
| 223 Serena Dr Palm Desert, CA | 3.0 | 2.0 | 1584 | $4,800 | $3.03 | 44d | 1 | 0.77mi |
| 254 Santa Barbara Cir Palm Desert, CA | 2.0 | 2.0 | 1656 | $8,000 | $4.83 | 44d | 1 | 0.77mi |
| 246 Santa Barbara Cir Palm Desert, CA | 2.0 | 2.0 | 1656 | $9,000 | $5.43 | 44d | 1 | 0.79mi |
| 222 Serena Dr Palm Desert, CA | 2.0 | 2.5 | 2055 | $6,300 | $3.07 | 44d | 1 | 0.79mi |
| 235 Santa Barbara Cir Palm Desert, CA | 3.0 | 3.0 | 1800 | $7,500 | $4.17 | 44d | 1 | 0.80mi |
| 207 Serena Dr Palm Desert, CA | 2.0 | 2.0 | 1584 | $5,900 | $3.72 | 44d | 1 | 0.80mi |
| 240 Santa Barbara Cir Palm Desert, CA | 2.0 | 2.0 | 1457 | $6,000 | $4.12 | 25d | 1 | 0.81mi |
HOA detail
- Monthly dues
- $380 · $4,560/yr
- Likely covers
- landscapingpoolsecurity
Listing history 17 events
-
2026-06-18days on market $625,000 Active 76 DOM
-
2026-06-17days on market $625,000 Active 75 DOM
-
2026-06-16days on market $625,000 Active 74 DOM
-
2026-06-15days on market $625,000 Active 73 DOM
-
2026-06-13days on market $625,000 Active 71 DOM
-
2026-06-09days on market $625,000 Active 67 DOM
-
2026-06-08days on market $625,000 Active 66 DOM
-
2026-06-07days on market $625,000 Active 65 DOM
-
2026-06-04days on market $625,000 Active 62 DOM
-
2026-06-03days on market $625,000 Active 61 DOM
-
2026-06-02days on market $625,000 Active 60 DOM
-
2026-06-02price $625,000 Active 59 DOM
-
2026-06-01days on market $640,000 Active 59 DOM
-
2026-05-31days on market $640,000 Active 58 DOM
-
2026-05-08price $640,000 860-char remark
Show marketing remark (860 chars)
Are you ready for a simpler lifestyle with minimal upkeep? Or maybe a stylish getaway that you can lock and leave with peace of mind? This is the home and the community for you. Welcome to 34 Vistara; located in the Gated Community of The Estates at Rancho Mirage, a small enclave of just 88 homes. This is a Hidden Gem in the Desert real estate scene with one of the best locations in the valley. Close to both The River, and El Paseo. The low HOA includes front landscape maintenance, 2 Pools, Spas, Sauna, Park, and beautiful community landscaping throughout. This is an Open Floor Plan that flows easily from Inside to Outdoor Living, with a very private backyard, large enough to add a private pool, but no need - both of the community pools are close. This is your opportunity to own a piece of paradise in one of the valley's most desirable communities.
-
2026-04-03$672,500 Active 860-char remark
Show marketing remark (860 chars)
Are you ready for a simpler lifestyle with minimal upkeep? Or maybe a stylish getaway that you can lock and leave with peace of mind? This is the home and the community for you. Welcome to 34 Vistara; located in the Gated Community of The Estates at Rancho Mirage, a small enclave of just 88 homes. This is a Hidden Gem in the Desert real estate scene with one of the best locations in the valley. Close to both The River, and El Paseo. The low HOA includes front landscape maintenance, 2 Pools, Spas, Sauna, Park, and beautiful community landscaping throughout. This is an Open Floor Plan that flows easily from Inside to Outdoor Living, with a very private backyard, large enough to add a private pool, but no need - both of the community pools are close. This is your opportunity to own a piece of paradise in one of the valley's most desirable communities.
-
1997-07-30soldstatus $175,000
ⓘ Source: listings_history table (triggers on properties + properties_extension) + one-shot
backfill from property_details.listing_events for pre-trigger history.
Tax reassessment forecast CA · Resets to sale price
- Current annual tax
- $4,474 · $373/mo
- Projected year-2 tax
- $4,750 · $396/mo
- Expected delta
- +$276/yr (+$23/mo · 6.2%)
ⓘ Screening estimate from a state-policy table — verify with the county assessor before closing.
Climate risk First Street
- Flood 1/10 Low FEMA zone X · 0% chance over 30 yrs
- Wildfire 5/10 Major
- Heat 9/10 Extreme 7 d/yr ≥114°F today · 21 d/yr by 30 yrs out
- Wind 1/10 Low
- Air quality 4/10 Moderate 5 unhealthy d/yr today · 6 by 30 yrs out
Nearby sold comps map
Loading sold comps map…
Walkable amenities ~0.75 mi
Loading nearby amenities…
Taxation est. · year 1
- Rental income
- $74,085
- − Mortgage interest
- −$35,010
- − Property taxes
- −$4,474
- − Insurance
- −$3,125
- − Repairs & maintenance
- −$5,927
- − Management
- −$5,927
- − HOA
- −$4,560
- − Depreciation
- −$18,182
- Taxable loss
- −$3,119
- Est. tax savings @ 24.0%
- +$749
- After-tax cash flow
- $7,786/yr
For passive investors: Depreciation is non-cash, so a rental often shows a tax loss while cash-flowing — sheltering income. Rental losses are passive: they offset passive income freely, and up to $25,000/yr can offset ordinary (W-2) income if you actively participate and your MAGI is under $100k (phasing out to $0 by $150k); unused losses carry forward. On sale, claimed depreciation is recaptured at up to 25%, and gains may owe capital-gains tax (a 1031 exchange can defer both). Figures are a year-1 estimate at your 24.0% rate — not tax advice; consult a CPA.
Schools (NCES district)
- District
- Desert Sands Unified
- NCES district ID
- 0611110
- Math proficiency
- 31% ▼ -4.00%
- Reading proficiency
- 56% ▲ 7.00%
- Median HH income
- $54,957
- Composite
- 37.77/100
- National rank
- #4346
- State rank
- #199 of 517 in CA
Livability — Rancho Mirage
- Score
- 51/100
- State rank
- #1065
- US rank
- #25255
Category grades
Schools grade is shown separately in the Schools card above.
Census & demographics
- Census place
- Rancho Mirage, CA
- County
- Riverside County · 2,287,001 people
- City population
- 17,563
- Metro
- Riverside-San Bernardino-Ontario, CA
- Population (ZIP)
- 17,563
- Household income
- $107,364
- Rent vs Own
- Severe rent burden
- 498.0
Population outlook (Riverside County) Hauer SSP2
- Today (2025)
- 2,664,475 people
- By 2030
- 2,802,692 · +5.2%
- By 2040
- 3,050,904 · +14.5%
- By 2050
- 3,256,783 · +22.2%
- By 2075
- 3,655,058 · +37.2%
- By 2100
- 3,766,594 · +41.4%
Race, ethnicity, and origin ACS 2023
- Neighborhood character
- Predominantly White (77%)
- Race & ethnicity
- White 77% Hispanic / Latino 15% Two or more races 6% Asian 4% Black 2%
- Hispanic origin (detail)
- Mexican 12%
- Common ancestry
- Slovak 4% Romanian 3% Lithuanian 3%
- Foreign-born
- 17% · Canada, South Korea, China
- Languages at home
- 81% English-only · Spanish 11% Other Indo-European 3% French/Haitian/Cajun 1%
Political lean MEDSL · Riverside
- 2024 margin
- Toss-up / Even · D 48.0% · R 49.3% · Other 2.6%
- 2008→2024 swing
- -3.6pp toward R · 2008: 2.3pp · 2024: -1.3pp
- All cycles
- 2024: R+1.3 2020: D+8.0 2016: D+4.3 2012: R+0.4 2008: D+2.3
Not yet ingested
- Civics
- —
Market trends
- HPI YoY
- ▼ -210.99%
- Current HPI
- 282.2957
- Rent YoY
- ▲ 3.72%
- Metro
- Riverside-San Bernardino-Ontario, CA
- State GDP YoY
- ▲ 3.21%
- F500 in state
- 116
Industry mix (Fortune 500 HQ in CA)
| Industry | F500 HQs | Revenue |
|---|---|---|
| Technology | 27 | $1,492B |
|
||
| Financial Services | 3 | $174B |
|
||
| Retail | 3 | $44B |
|
||
| Insurance | 3 | $26B |
|
||
| Media / Entertainment | 2 | $115B |
|
||
| Pharmaceuticals / Biotech | 2 | $62B |
|
||
Price history
+265.7% since first listed3 events — show timeline
- 2026-05-08 Price Changed $640,000 GPSMLS
- 2026-04-03 Listed $672,500 GPSMLS
- 1997-07-30 Sold (Public Records) $175,000 Public Records
Property tax history
+2.2%/yrLatest (2025): $4,474 · +4.6% YoY. Source: county tax records.
Cash-flow waterfall
monthlySold comps — $/sqft
last 12 mo · ≤1 miLoading sold comps…