 Triplex
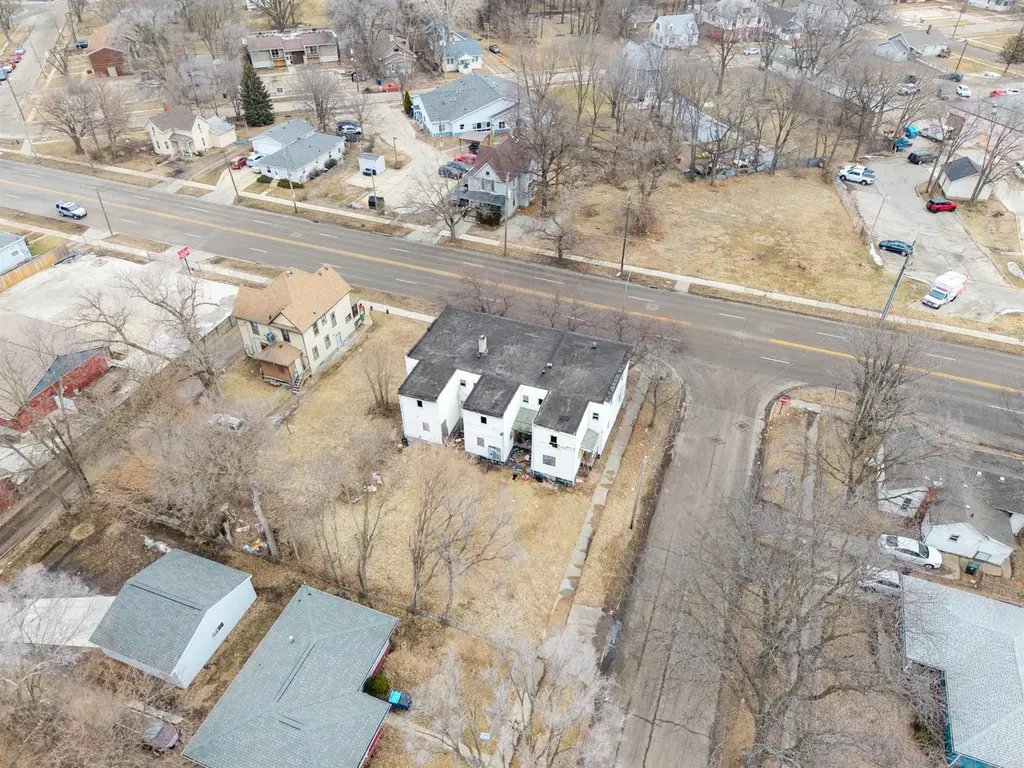
60, 62, 64 Franklin St · Waterloo, IA
Flood risk 1/10 · Minimal
- FEMA flood zone
- X
- Chance of flooding over 30 yrs
- 0.0%
- Est. flood insurance / yr
- $473 – $860
Fire risk 1/10 · Minimal
- Est. fire insurance / yr
- $902 – $1,676
Heat risk 3/10 · Minor
- Hot days now (above 101°F)
- 7 days/yr
- Hot days in 30 yrs
- 16 days/yr
Wind risk 2/10 · Minimal
- Chance of severe wind over 30 yrs
- —
Air-quality risk 1/10 · Minimal
- Unhealthy air days now
- 0 days/yr
- Unhealthy air days in 30 yrs
- 0 days/yr
Risk factors via First Street. Map © Google.
Why this score? — see what drove the D+ grade
The composite is a weighted blend of 9 inputs, each scored 0–100. Each bar is that input's sub-score; the figure is the points it added to the 100-point composite (weight × sub-score).
- Cash flow +15.0/30.0
- ARV discount +7.5/15.0
- 1% rule +5.0/10.0
- DSCR +5.0/10.0
- Schools +4.4/10.0
- Rent growth +4.2/5.0
- Livability +4.0/5.0
- Condition / age +1.0/5.0
- Appreciation +0.0/10.0
$40,000
🖨 Deal sheet 📄 Offer letter ✓ Due diligence
Multi-family units
County records classify this as Multi-Family (2-4 Unit). Listing-text estimate: 3 units. confirmed
Listing remarks MLS
Calling all investors and visionaries! This prime multi-unit property located at 60, 62, 64 Franklin St in Waterloo is now available for sale at $40,000. Situated in a convenient and established area, this triplex offers a unique opportunity for redevelopment or future improvement. With strong potential for those looking to add value, reimagine the space, or pursue a long-term investment strategy, this property is ideal for buyers seeking their next project in a desirable location close to local amenities, schools, and transportation. Opportunities like this don’t come along often, bring your ideas and make this one your next successful investment. All measurements and features approximate.
Key facts
- Desirable location
- Triplex
- Local amenities
Tags
Neighborhood map
What this means for you Summary
Snapshot
- This is a 3 × 3-bed/1-bath units multifamily listed at $40k. Condition is rated poor.
Deal economics
- At list price, monthly cash flow is $3k ($30k/yr) — positive. Per door: $838/mo.
- The deal already cash-flows at list — no discount required.
- Meets the 1% rule at list price ($4k rent vs $40k).
- Recommended offer: $36k (9.0% below list) — sets the bar for market timing.
- Cap rate 81.7% vs local median 4.2% in Waterloo — top-decile yield for the area; either an underpriced asset or a hidden risk that comps aren't pricing in. Stress-test before assuming the spread holds.
Location & tenants
- Location reads 81/100 on livability (#74 in IA, #1,589 nationally) — a professional / high-income tenant draw. Strengths: commute A+, cost of living A+, housing A+; Watch: schools C-, crime F, employment D-.
- Waterloo Community School District (urban): math 50% / reading 54% proficiency, ranked #276 of 289 in IA (top 96%) — acceptable for families but not a draw, mixed tenant base, ~2y average lease.
- Market conditions: Rents rising fast (+6.7%/yr); 98 active listings in the ZIP; 287 units permitted in Black Hawk County in 2024 (67 in 5+ unit buildings).
- At $3,532/mo this rent would consume 85% of the median local household income ($50k/yr) (locally 871% of renters already pay >50% of income on rent) — very limited rent-growth headroom before tenants either downsize or default.
Forward outlook
- Local home prices are declining (-3.0%/yr); year-one equity from $277 of loan paydown is wiped out by about $1k of value loss. Plan a longer hold.
- Black Hawk County population projected at +10% by 2050 — modest demand growth; plan on rents tracking national, not racing it.
- At projected returns (-3.0% appreciation + 6.7% rent growth), your $11k cash investment doubles in ~1 year — after that, you're playing with house money.
Negotiation context
- It's been on market 107 days — a 9% lower offer ($36k) is reasonable based on typical stale-listing flexibility.
Risks & watch-outs
- Watch-outs: built in 1900 — expect roof / HVAC / electrical / plumbing capex.
Questions for the listing agent
- It's been on market 107 days. Have you received any prior offers? Is the seller open to a 9% concession, seller financing, or rate buy-down credit?
- Can we see the unit-by-unit rent roll, current vacancy, and any below-market leases? What's the average tenancy length?
- What capital expenditures (roof, boiler, parking lot, exteriors) have been made in the last 5 years, and what's planned in the next 2?
- Have any recent inspections been done? Can we get a copy of the seller's disclosures and any deferred-maintenance estimates?
- Built in 1900 — when were the roof, HVAC, electrical panel, plumbing, and water heater last replaced?
- Why hasn't it sold? Are there any deal-killer items the seller is aware of (foundation, flood, title, zoning, code violations)?
- Is there a deadline driving the sale (1031 exchange, divorce, estate, relocation)? That informs how much negotiation room exists.
- Crime grade is F in this area — have there been break-ins, vandalism, or insurance claims at this property in the last 3 years? What carrier currently insures it and at what premium?
- The area grade is low — what's the realistic commute time and amenity access for the typical tenant pool here? Any planned neighborhood developments (good or bad) we should know about?
- What's the average days-on-market for RENTAL listings here right now (not sales)? A rising rental-DOM trend means longer vacancies and softer asking-rent achievability than the comps imply.
- What's the recent tenant-quality profile in this submarket — average credit score on applications, eviction rate, late-payment / NSF rate, and stable-employment percentage? A property-management company in the area should have these aggregated.
- How much new apartment / multifamily construction is in the pipeline within 1–3 miles? Heavy new supply (>2% of stock underway) typically softens rents 12–24 months out; light construction supports rent growth.
Investment metrics
- 1% rule
- 8.83% ✓
- Cap rate
- 81.71%
- Cash-on-cash
- 269.34%
- DSCR
- 12.98
- GRM
- 0.9
CMA / ARV
- ARV (median comp)
- $113,180
- List price
- $40,000
- Delta
- -64.66%
- Verdict
- UNDERPRICED
- Comps
- 5 within 1.0 mi
Projected returns pro-forma
-3.0% appreciation · 6.67% rent growth · sell at horizon
- IRR
- —
- Equity multiple
- 15.93×
- Total profit
- $167,202
- Equity at exit
- $5,964
- IRR
- —
- Equity multiple
- 37.77×
- Total profit
- $411,827
- Equity at exit
- $3,458
Cash invested: $11,200 (down + closing). Projections, not guarantees.
Landlord ↔ Tenant lean methodology
- Overall (STATE)
- 83 Strongly Landlord-Friendly
- State Iowa
- 83 Strongly Landlord-Friendly · R+6
- County
- — inherits STATE
- City
- — inherits STATE
ZIP-level market 50703
- Rents YoY
- 6.7%
- Active inventory
- 98
- Price-to-rent
- 2.8×
Monthly cashflow live
- Estimated rent
- $3,532 high interval (Pro) →
- Mortgage (P&I)
- −$210
- Tax est. 1.5%
- −$50 /mo · $600/yr
- Insurance
- −$17
- HOA
- −$0
- Vacancy / Maint / Mgmt
- −$742
- Net cashflow
- $2,514
Break-even live
3-unit breakdown (identical units grouped — click to expand)
| Units | Beds | Baths | Est. rent |
|---|---|---|---|
| 3× units | 3 | 1 | $3,531 |
| #1 | 3 | 1 | $1,177 |
| #2 | 3 | 1 | $1,177 |
| #3 | 3 | 1 | $1,177 |
| Total (3 units) | $3,532 | ||
UW: 25.0% down · 7.5% · 30yr · 1.5% tax · 5.0% vac · 8.0% maint · 8.0% mgmt
Financing live
Cash to close
- Down payment
- $10,000
- Closing costs
- $1,200
- Reserves months
- —
- Total cash needed
- —
Loan-product check · same deal, 3 products live
Conventional
25% down · 7.5% · 30yr
- Down + closing
- —
- Monthly P&I
- —
- Monthly cashflow
- —
- DSCR
- —
- Eligible?
- —
Personal DTI + credit; lowest rate.
DSCR
20% down · 8.5% · 30yr
- Down + closing
- —
- Monthly P&I
- —
- Monthly cashflow
- —
- DSCR
- —
- Eligible?
- —
No personal income docs; deal must DSCR.
Hard money
10% down · 12.0% · 12mo
- Down + closing
- —
- Monthly P&I
- —
- Monthly cashflow
- —
- DSCR
- —
- Eligible?
- —
Short-term bridge; refi at stabilization.
Listing history 11 events
-
2026-06-10days on market $40,000 Active 107 DOM
-
2026-06-09days on market $40,000 Active 106 DOM
-
2026-06-08days on market $40,000 Active 105 DOM
-
2026-06-07days on market $40,000 Active 104 DOM
-
2026-06-05days on market $40,000 Active 101 DOM
-
2026-06-03days on market $40,000 Active 100 DOM
-
2026-06-02days on market $40,000 Active 99 DOM
-
2026-06-01days on market $40,000 Active 98 DOM
-
2026-05-31days on market $40,000 Active 97 DOM
-
2026-05-30days on market $40,000 Active 96 DOM
-
2026-02-23$40,000 Active 705-char remark
Show marketing remark (705 chars)
Calling all investors and visionaries! This prime multi-unit property located at 60, 62, 64 Franklin St in Waterloo is now available for sale at $40,000. Situated in a convenient and established area, this triplex offers a unique opportunity for redevelopment or future improvement. With strong potential for those looking to add value, reimagine the space, or pursue a long-term investment strategy, this property is ideal for buyers seeking their next project in a desirable location close to local amenities, schools, and transportation. Opportunities like this don’t come along often, bring your ideas and make this one your next successful investment. All measurements and features approximate.
ⓘ Source: listings_history table (triggers on properties + properties_extension) + one-shot
backfill from property_details.listing_events for pre-trigger history.
Climate risk First Street
- Flood 1/10 Low FEMA zone X · 0% chance over 30 yrs
- Wildfire 1/10 Low
- Heat 3/10 Moderate 7 d/yr ≥101°F today · 16 d/yr by 30 yrs out
- Wind 2/10 Low
- Air quality 1/10 Low 0 unhealthy d/yr today · 0 by 30 yrs out
Nearby sold comps map
Loading sold comps map…
Walkable amenities ~0.75 mi
Loading nearby amenities…
Taxation est. · year 1
- Rental income
- $42,384
- − Mortgage interest
- −$2,241
- − Property taxes
- −$600
- − Insurance
- −$200
- − Repairs & maintenance
- −$3,391
- − Management
- −$3,391
- − Depreciation
- −$1,164
- Taxable income
- $31,398
- Est. tax owed @ 24.0%
- −$7,536
- After-tax cash flow
- $22,631/yr
For passive investors: Depreciation is non-cash, so a rental often shows a tax loss while cash-flowing — sheltering income. Rental losses are passive: they offset passive income freely, and up to $25,000/yr can offset ordinary (W-2) income if you actively participate and your MAGI is under $100k (phasing out to $0 by $150k); unused losses carry forward. On sale, claimed depreciation is recaptured at up to 25%, and gains may owe capital-gains tax (a 1031 exchange can defer both). Figures are a year-1 estimate at your 24.0% rate — not tax advice; consult a CPA.
Condition & rehab AI · 10 photos
This multi-family property requires extensive repairs and structural work to become habitable and increase its value.
Repairs flagged
- Major exterior siding — The siding is peeling and damaged, requiring extensive repair.
- Major roof — The roof appears to be in poor condition, with visible damage and potential leaks.
- Major interior — The interior is not visible, but the exterior suggests significant damage and disrepair.
- Major flooring — The flooring is not visible, but the exterior suggests significant damage and disrepair.
- Major systems — No systems are visible, but the exterior suggests significant damage and disrepair.
Value-add opportunities
- Both structural repairs — Structural repairs are necessary to ensure the property is safe and habitable.
- Both exterior siding replacement — Replacing the damaged siding will improve the property's appearance and increase its value.
- Both roof repair/replacement — Repairing or replacing the damaged roof will prevent further water damage and increase the property's value.
- Both interior repairs — Interior repairs will make the property habitable and increase its value.
- Both flooring replacement — Replacing the damaged flooring will improve the property's appearance and increase its value.
- Both system upgrades — Upgrading the systems will improve the property's functionality and increase its value.
Renovation cost estimate screening
| Repair item | Severity | Est. cost |
|---|---|---|
| exterior siding · The siding is peeling and damaged, requiring extensive repair. | Major | $15,000–50,000 |
| roof · The roof appears to be in poor condition, with visible damage and potential leaks. | Major | $15,000–50,000 |
| interior · The interior is not visible, but the exterior suggests significant damage and disrepair. | Major | $15,000–50,000 |
| flooring · The flooring is not visible, but the exterior suggests significant damage and disrepair. | Major | $15,000–50,000 |
| systems · No systems are visible, but the exterior suggests significant damage and disrepair. | Major | $15,000–50,000 |
| Total estimated repair cost · 5 items | $75,000–250,000 |
Value-add ROI direction
- Both structural repairs — Structural repairs are necessary to ensure the property is safe and habitable. ↑
- Both exterior siding replacement — Replacing the damaged siding will improve the property's appearance and increase its value. ↑
- Both roof repair/replacement — Repairing or replacing the damaged roof will prevent further water damage and increase the property's value. ↑
- Both interior repairs — Interior repairs will make the property habitable and increase its value. ↑
- Both flooring replacement — Replacing the damaged flooring will improve the property's appearance and increase its value. ↑
- Both system upgrades — Upgrading the systems will improve the property's functionality and increase its value. ↑
ⓘ Cost ranges are severity-bucket heuristics (US national rule-of-thumb). Get contractor quotes + a written scope before underwriting a rehab budget.
Schools (NCES district)
- District
- Waterloo Community School District
- NCES district ID
- 1930480
- Math proficiency
- 50% ▼ -4.00%
- Reading proficiency
- 54% ▲ 1.00%
- Median HH income
- $42,545
- Composite
- 43.72/100
- National rank
- #2950
- State rank
- #276 of 289 in IA
Livability — Waterloo
- Score
- 81/100
- State rank
- #74
- US rank
- #1589
Category grades
Schools grade is shown separately in the Schools card above.
Census & demographics
- Census place
- Waterloo, IA
- County
- Black Hawk County · 112,933 people
- City population
- 69,066
- Metro
- Waterloo-Cedar Falls, IA
- Population (ZIP)
- 17,952
- Household income
- $50,060
- Rent vs Own
- Severe rent burden
- 871.0
Population outlook (Black Hawk County) Hauer SSP2
- Today (2025)
- 139,716 people
- By 2030
- 142,853 · +2.2%
- By 2040
- 147,843 · +5.8%
- By 2050
- 153,247 · +9.7%
- By 2075
- 167,977 · +20.2%
- By 2100
- 177,320 · +26.9%
Race, ethnicity, and origin ACS 2023
- Neighborhood character
- Diverse neighborhood (Simpson 0.62)
- Race & ethnicity
- White 55% Black 26% Hispanic / Latino 10% Two or more races 7% Asian 2%
- Hispanic origin (detail)
- Mexican 6%
- Common ancestry
- Iranian 1% Portuguese 1% Lithuanian 1%
- Foreign-born
- 7% · Canada, Philippines, China
- Languages at home
- 89% English-only · Spanish 7% Other Asian/Pacific 2% Russian/Polish/Slavic 1%
Political lean MEDSL · Black Hawk
- 2024 margin
- Toss-up / Even · D 50.0% · R 48.8% · Other 1.2%
- 2008→2024 swing
- -21.3pp toward R · 2008: 22.4pp · 2024: 1.2pp
- All cycles
- 2024: D+1.2 2020: D+9.0 2016: D+7.3 2012: D+20.0 2008: D+22.4
Not yet ingested
- Civics
- —
Market trends
- HPI YoY
- ▼ -117.18%
- Current HPI
- 132.9478
- Rent YoY
- ▲ 6.67%
- Metro
- Waterloo-Cedar Falls, IA
- State GDP YoY
- ▲ 2.48%
- F500 in state
- 4
Industry mix (Fortune 500 HQ in IA)
| Industry | F500 HQs | Revenue |
|---|---|---|
| Financial Services | 1 | $16B |
|
||
| Retail / Convenience | 1 | $15B |
|
||
Price history
1 event — show timeline
- 2026-02-23 Listed $40,000 NEIRBR as distributed by MLS GRID
Cash-flow waterfall
monthlySold comps — $/sqft
last 12 mo · ≤1 miLoading sold comps…