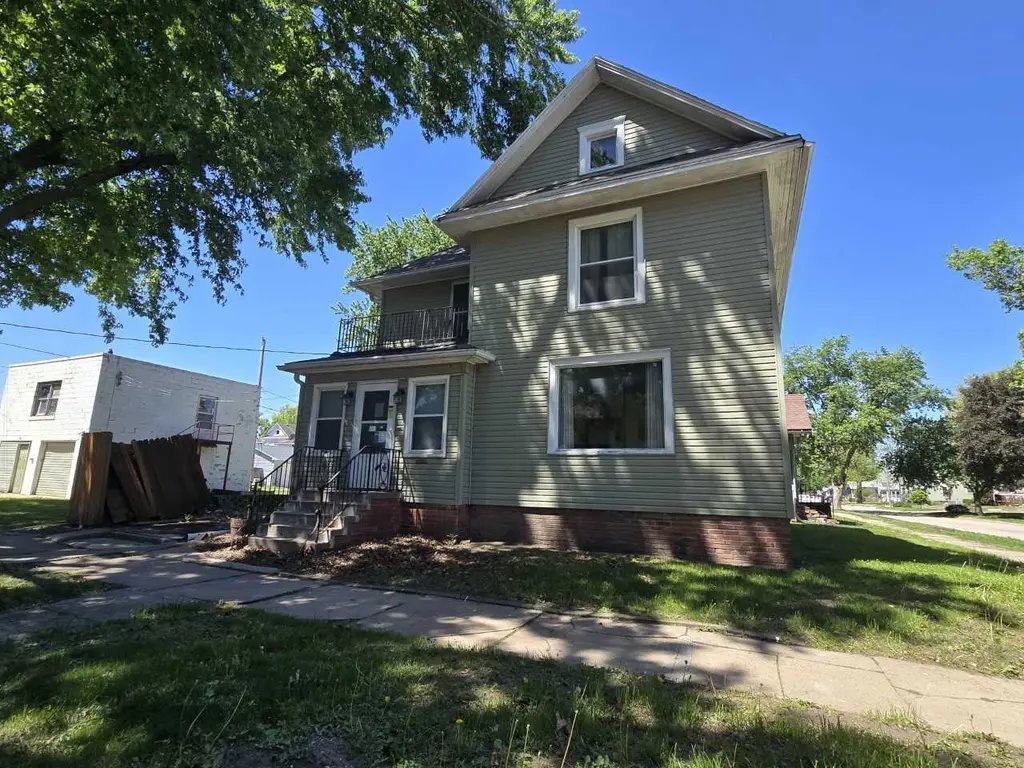
811 N 3rd St · Red Oak, IA
Flood risk 1/10 · Minimal
- FEMA flood zone
- X
- Chance of flooding over 30 yrs
- 0.0%
- Est. flood insurance / yr
- $473 – $860
Fire risk 1/10 · Minimal
- Est. fire insurance / yr
- $902 – $1,676
Heat risk 3/10 · Minor
- Hot days now (above 106°F)
- 7 days/yr
- Hot days in 30 yrs
- 15 days/yr
Wind risk 2/10 · Minimal
- Chance of severe wind over 30 yrs
- —
Air-quality risk 1/10 · Minimal
- Unhealthy air days now
- 0 days/yr
- Unhealthy air days in 30 yrs
- 0 days/yr
Risk factors via First Street. Map © Google.
Why this score? — see what drove the B+ grade
The composite is a weighted blend of 9 inputs, each scored 0–100. Each bar is that input's sub-score; the figure is the points it added to the 100-point composite (weight × sub-score).
- Cash flow +30.0/30.0
- ARV discount +15.0/15.0
- DSCR +10.0/10.0
- 1% rule +9.4/10.0
- Schools +4.9/10.0
- Livability +3.4/5.0
- Rent growth +2.5/5.0
- Condition / age +2.5/5.0
- Appreciation +0.0/10.0
$95,000
🖨 Deal sheet (PDF) 📄 Offer letter ✓ Due diligence
Listing remarks MLS
If your're looking for a large 3 bedroom house this may just be the one for you! The home has vinyl siding, many newer windows, all wallpaper has been stripped away, with a newer furnace, newer water heater and an estimated $20K in roof repairs and replacement. Also includes a detached garage with a 2nd floor.
Key facts
- Upstairs storage
- Outdoor space
- Off-street parking
Tags
Property features AI
Finance
- HOA & community: Community sidewalks
Exterior
- Parking: Off-street parking; 2-car garage
- Utilities: Natural gas available; Electricity available; Public sewer
- Home design: Single-family residence; Two-story home; Frame construction
- Construction: Composition roof
- Exterior features: Patio; Waterfront lot; Lot approximately 45 x 112
Interior
- Heating & cooling: Central air conditioning; Natural gas heating with forced air
- Interior features: Full unfinished basement; Sidewalks on the property
- Laundry & utility: Washer hookup on main level
Neighborhood map
What this means for you Summary
Snapshot
- This is a 3-bed/2.0-bath single-family listed at $95k.
Deal economics
- At list price, monthly cash flow is $408 ($5k/yr) — positive.
- The deal already cash-flows at list — no discount required.
- Meets the 1% rule at list price ($1k rent vs $95k).
- Cap rate 11.4% vs local median 3.6% in Red Oak — top-decile yield for the area; either an underpriced asset or a hidden risk that comps aren't pricing in. Stress-test before assuming the spread holds.
Location & tenants
- Location reads 68/100 on livability (#428 in IA) — a middle-class / working-renter tenant base. Strengths: cost of living A+, housing A+, health & safety A+; Watch: employment D+, amenities F, commute F.
- Red Oak Community School District (town): math 58% / reading 59% proficiency, ranked #255 of 289 in IA (top 88%) — acceptable for families but not a draw, mixed tenant base, ~2y average lease.
- Zoned schools: Inman Elementary School (math 63% / reading 47%, grade C, #459 of 616 statewide, top 75%, 496 students, 59% FRL); Red Oak Early Childhood Center (74 students, 62% FRL); Red Oak Junior/Senior High School (math 55% / reading 67%, grade C+, #258 of 336 statewide, top 78%, 474 students, 55% FRL).
- Market conditions: 56 active listings in the ZIP; 13 units permitted in Montgomery County in 2024 (0 in 5+ unit buildings).
Forward outlook
- Local home prices are declining (-3.0%/yr); year-one equity from $657 of loan paydown is wiped out by about $3k of value loss. Plan a longer hold.
- Montgomery County population projected at -20% by 2050 — secular population decline; favor cash flow + early exit over multi-decade hold.
- At projected returns (-3.0% appreciation + 3.0% rent growth), your $27k cash investment doubles in ~7 years — after that, you're playing with house money.
Negotiation context
- Only 10 days on market — expect competitive offers; lowballing is unlikely to land.
- 4 sale attempts since 8y ago with the ask held roughly flat each time — persistent listings suggest the price (not the market) is what's stuck; bring a comps-based counter.
- Current owner paid $60k; list at $95k implies a 58% gain — meaningful room to come down on a strong offer.
Risks & watch-outs
- Watch-outs: built in 1905 — expect roof / HVAC / electrical / plumbing capex.
Questions for the listing agent
- Built in 1905 — when were the roof, HVAC, electrical panel, plumbing, and water heater last replaced?
- Is there a deadline driving the sale (1031 exchange, divorce, estate, relocation)? That informs how much negotiation room exists.
- What's the average days-on-market for RENTAL listings here right now (not sales)? A rising rental-DOM trend means longer vacancies and softer asking-rent achievability than the comps imply.
- What's the recent tenant-quality profile in this submarket — average credit score on applications, eviction rate, late-payment / NSF rate, and stable-employment percentage? A property-management company in the area should have these aggregated.
- How much new for-sale + rental construction is in the pipeline within 1–3 miles? Heavy new supply typically softens prices + rents 12–24 months out; constrained supply supports both.
Investment metrics
- 1% rule
- 1.44% ✓
- Cap rate
- 11.44%
- Cash-on-cash
- 18.40%
- DSCR
- 1.82
- GRM
- 5.8
CMA / ARV
- ARV (on-the-fly)
- $151,848
- Comps found
- 12
Show comp detail 12 sales within ~0.75 mi
| Address | Dist | Beds/Ba | Sqft | Sold | Price | $/sf | Match |
|---|---|---|---|---|---|---|---|
| 1010 N 6th St | 0.24mi | 3/2.0 | 1,874 (-6%) | 3mo | $143,000 | $76 | 76 |
| 207 E Joy St | 0.03mi | 3/2.0 | 1,760 (-12%) | 4mo | $122,500 | $70 | 76 |
| 701 E Oak St | 0.43mi | 4/3.0 (+1) | 1,968 (-2%) | 9mo | $165,000 | $84 | 61 |
| 907 N 7th St | 0.25mi | 2/1.5 (-1) | 1,876 (-6%) | 12mo | $93,500 | $50 | 61 |
| 306 Maple St | 0.25mi | 4/2.0 (+1) | 1,810 (-9%) | 10mo | $138,500 | $77 | 60 |
| 1509 N 8th St | 0.54mi | 3/2.0 | 2,117 (+6%) | 12mo | $209,000 | $99 | 55 |
| 711 E Oak St | 0.45mi | 3/1.5 | 2,253 (+13%) | 2mo | $139,500 | $62 | 54 |
| 1012 E Corning St | 0.53mi | 2/2.0 (-1) | 1,800 (-10%) | 0mo | $130,000 | $72 | 53 |
| 210 N 8th St | 0.49mi | 3/2.0 | 1,732 (-13%) | 5mo | $50,000 | $29 | 51 |
| 1123 Boundary St | 0.49mi | 4/2.0 (+1) | 1,878 (-6%) | 14mo | $310,000 | $165 | 51 |
| 1406 N 6th St | 0.42mi | 2/1.5 (-1) | 1,768 (-12%) | 12mo | $75,000 | $42 | 45 |
| 1406 Forest Ave | 0.73mi | 3/2.5 | 2,224 (+11%) | 9mo | $250,000 | $112 | 37 |
Match score weights: distance 35% · size 25% · config 20% · recency 20%. Top-matched comps best support the ARV.
Projected returns pro-forma
-3.0% appreciation · 3.0% rent growth · sell at horizon
- IRR
- 10.1%
- Equity multiple
- 1.40×
- Total profit
- $10,607
- Equity at exit
- $14,165
- IRR
- 19.2%
- Equity multiple
- 2.61×
- Total profit
- $42,799
- Equity at exit
- $8,214
Cash invested: $26,600 (down + closing). Projections, not guarantees.
Landlord ↔ Tenant lean methodology
- Overall (STATE)
- 83 Strongly Landlord-Friendly
- State Iowa
- 83 Strongly Landlord-Friendly · R+6
- County
- — inherits STATE
- City
- — inherits STATE
ZIP-level market 51566
- Home prices YoY
- -33.3%
- Active inventory
- 56
- Price-to-rent
- 5.8×
Monthly cashflow live
- Estimated rent
- $1,365 medium interval (Pro) →
- Mortgage (P&I)
- −$498
- Tax from tax record
- −$133 /mo · $1,596/yr
- Insurance
- −$40
- HOA
- −$0
- Vacancy / Maint / Mgmt
- −$287
- Net cashflow
- $408
Break-even live
Sensitivity live
| Price | -10% $462 | -5% $435 | +0% $408 | +5% $381 | +10% $354 |
|---|---|---|---|---|---|
| Rent | -10% $300 | -5% $354 | +0% $408 | +5% $462 | +10% $516 |
| Rate | -1.0pp $456 | -0.5pp $432 | base $408 | +0.5pp $383 | +1.0pp $358 |
UW: 25.0% down · 7.5% · 30yr · 1.5% tax · 5.0% vac · 8.0% maint · 8.0% mgmt
Financing live
Cash to close
- Down payment
- $23,750
- Closing costs
- $2,850
- Reserves months
- —
- Total cash needed
- —
Loan-product check · same deal, 3 products live
Conventional
25% down · 7.5% · 30yr
- Down + closing
- —
- Monthly P&I
- —
- Monthly cashflow
- —
- DSCR
- —
- Eligible?
- —
Personal DTI + credit; lowest rate.
DSCR
20% down · 8.5% · 30yr
- Down + closing
- —
- Monthly P&I
- —
- Monthly cashflow
- —
- DSCR
- —
- Eligible?
- —
No personal income docs; deal must DSCR.
Hard money
10% down · 12.0% · 12mo
- Down + closing
- —
- Monthly P&I
- —
- Monthly cashflow
- —
- DSCR
- —
- Eligible?
- —
Short-term bridge; refi at stabilization.
Listing history 9 events
-
2026-06-22days on market $95,000 Active 10 DOM
-
2026-06-21days on market $95,000 Active 9 DOM
-
2026-06-21days on market $95,000 Active 8 DOM
-
2026-06-18days on market $95,000 Active 6 DOM
-
2026-06-17days on market $95,000 Active 5 DOM
-
2026-06-16days on market $95,000 Active 4 DOM
-
2026-06-15days on market $95,000 Active 3 DOM
-
2026-06-13remarks 333-char remark
-
2026-06-13$95,000 Active 1 DOM
ⓘ Source: listings_history table (triggers on properties + properties_extension) + one-shot
backfill from property_details.listing_events for pre-trigger history.
Tax reassessment forecast IA · Partial reset (capped growth)
- Current annual tax
- $1,596 · $133/mo
- Projected year-2 tax
- $1,596 · $133/mo
- Expected delta
- $0/yr ($0/mo · 0.0%)
ⓘ Screening estimate from a state-policy table — verify with the county assessor before closing.
Climate risk First Street
- Flood 1/10 Low FEMA zone X · 0% chance over 30 yrs
- Wildfire 1/10 Low
- Heat 3/10 Moderate 7 d/yr ≥106°F today · 15 d/yr by 30 yrs out
- Wind 2/10 Low
- Air quality 1/10 Low 0 unhealthy d/yr today · 0 by 30 yrs out
Nearby sold comps map
Loading sold comps map…
Walkable amenities ~0.75 mi
Loading nearby amenities…
Taxation est. · year 1
- Rental income
- $16,383
- − Mortgage interest
- −$5,321
- − Property taxes
- −$1,596
- − Insurance
- −$475
- − Repairs & maintenance
- −$1,311
- − Management
- −$1,311
- − Depreciation
- −$2,764
- Taxable income
- $3,606
- Est. tax owed @ 24.0%
- −$865
- After-tax cash flow
- $4,028/yr
For passive investors: Depreciation is non-cash, so a rental often shows a tax loss while cash-flowing — sheltering income. Rental losses are passive: they offset passive income freely, and up to $25,000/yr can offset ordinary (W-2) income if you actively participate and your MAGI is under $100k (phasing out to $0 by $150k); unused losses carry forward. On sale, claimed depreciation is recaptured at up to 25%, and gains may owe capital-gains tax (a 1031 exchange can defer both). Figures are a year-1 estimate at your 24.0% rate — not tax advice; consult a CPA.
Schools (NCES district)
- District
- Red Oak Community School District
- NCES district ID
- 1924000
- Math proficiency
- 58% ▼ -6.00%
- Reading proficiency
- 59% ▲ 2.00%
- Median HH income
- $38,902
- Composite
- 48.77/100
- National rank
- #2092
- State rank
- #255 of 289 in IA
Livability — Red Oak
- Score
- 68/100
- State rank
- #428
- US rank
- #9239
Category grades
Schools grade is shown separately in the Schools card above.
Census & demographics
- Census place
- Red Oak, IA
- City population
- 7,004
- Population (ZIP)
- 7,004
Population outlook (Montgomery County) Hauer SSP2
- Today (2025)
- 9,518 people
- By 2030
- 9,116 · -4.2%
- By 2040
- 8,303 · -12.8%
- By 2050
- 7,595 · -20.2%
- By 2075
- 6,568 · -31.0%
- By 2100
- 5,800 · -39.1%
Race, ethnicity, and origin ACS 2023
- Neighborhood character
- Predominantly White (91%)
- Race & ethnicity
- White 91% Two or more races 4% Hispanic / Latino 1% Asian 1%
- Common ancestry
- Serbian 2% Romanian 1% Iranian 1%
- Foreign-born
- 2% · Canada
- Languages at home
- 98% English-only · Spanish 1%
Political lean MEDSL · Montgomery
- 2024 margin
- Solid R (+39.1) · D 29.8% · R 68.9% · Other 1.3%
- 2008→2024 swing
- -28.5pp toward R · 2008: -10.6pp · 2024: -39.1pp
- All cycles
- 2024: R+39.1 2020: R+39.0 2016: R+42.4 2012: R+21.6 2008: R+10.6
Not yet ingested
- Civics
- —
Market trends
- HPI YoY
- ▼ -93.42%
- Current HPI
- 187.1643
- Rent YoY
- —
- Metro
- —
- State GDP YoY
- ▲ 2.48%
- F500 in state
- 4
Industry mix (Fortune 500 HQ in IA)
| Industry | F500 HQs | Revenue |
|---|---|---|
| Financial Services | 1 | $16B |
|
||
| Retail / Convenience | 1 | $15B |
|
||
Price history
+106.5% since first listed10 events — show timeline
- 2026-06-11 Listed $95,000 SWIAR
- 2025-06-04 Pending — IAR
- 2025-05-20 Price Changed $79,900 IAR
- 2025-02-20 Listed $84,900 IAR
- 2019-02-25 Sold (Public Records) $60,000 Public Records
- 2019-02-21 Sold (MLS) $60,000 NORTHSTARMLS as Distributed by MLS Grid
- 2019-02-21 Sold (MLS) $60,000 IAR
- 2018-06-13 Listed $69,900 NORTHSTARMLS as Distributed by MLS Grid
- 2018-06-13 Listed $69,900 IAR
- 2006-11-09 Sold (Public Records) $46,000 Public Records
Property tax history
+5.5%/yrLatest (2025): $1,596 · +4.6% YoY. Source: county tax records.
Cash-flow waterfall
monthlySold comps — $/sqft
last 12 mo · ≤1 miLoading sold comps…