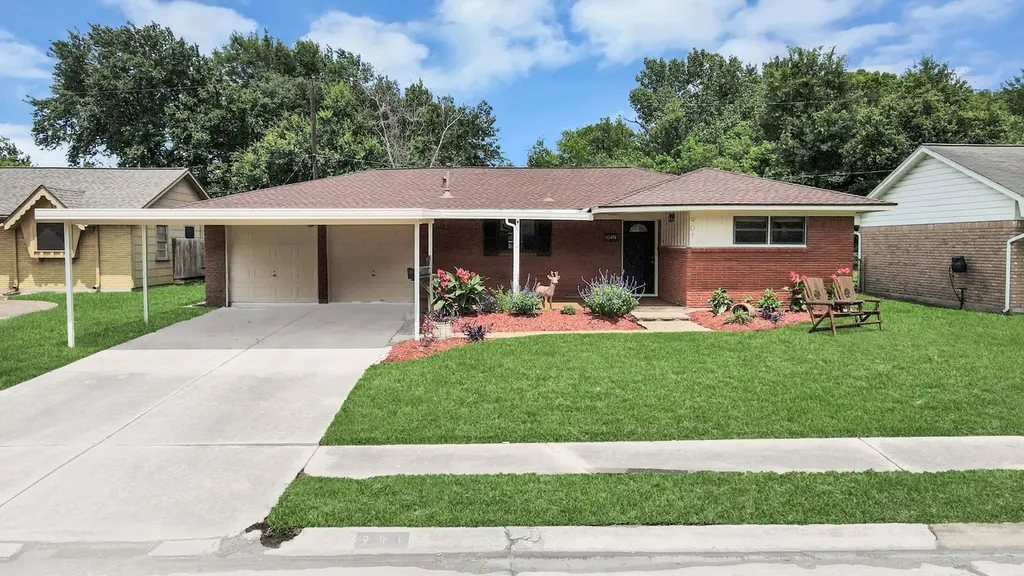
901 Alyse St · Deer Park, TX
Flood risk 1/10 · Minimal
- FEMA flood zone
- X (unshaded)
- Chance of flooding over 30 yrs
- 0.0%
- Est. flood insurance / yr
- $507 – $1,088
Fire risk 1/10 · Minimal
- Est. fire insurance / yr
- $1,222 – $2,270
Heat risk 9/10 · Severe
- Hot days now (above 110°F)
- 6 days/yr
- Hot days in 30 yrs
- 20 days/yr
Wind risk 9/10 · Severe
- Chance of severe wind over 30 yrs
- 99.0%
Air-quality risk 2/10 · Minimal
- Unhealthy air days now
- 2 days/yr
- Unhealthy air days in 30 yrs
- 2 days/yr
Risk factors via First Street. Map © Google.
Why this score? — see what drove the D- grade
The composite is a weighted blend of 9 inputs, each scored 0–100. Each bar is that input's sub-score; the figure is the points it added to the 100-point composite (weight × sub-score).
- Cash flow +9.3/30.0
- ARV discount +7.9/15.0
- Schools +4.3/10.0
- 1% rule +4.0/10.0
- Livability +3.6/5.0
- Rent growth +3.1/5.0
- DSCR +2.6/10.0
- Condition / age +2.5/5.0
- Appreciation +0.0/10.0
$219,900
🖨 Deal sheet (PDF) 📄 Offer letter ✓ Due diligence
Listing remarks
This is the one you've been waiting for. Freshly painted and move-in ready, this 4-bedroom home offers an open kitchen and family room, a backyard retreat with a covered deck, garden beds, storage shed, and no rear neighbors. The epoxy-finished garage with mini-split creates the perfect flex space for hobbies, workouts, projects, or game nights. Major updates include a 2023 roof, 2019 HVAC, radiant barrier insulation (2025), and plumbing upgrades. Plus, pickleball courts are just a short walk away. Exceptional value and ready for its next chapter.
Key facts
- 7,021 sq ft lot
- 2 garage spots
- Built 1962
Neighborhood map
What this means for you Summary
Snapshot
- This is a 3-bed/2.0-bath single-family listed at $220k.
Deal economics
- At list price, monthly cash flow is $-161 ($-2k/yr) — negative.
- To cash-flow at today's rent, offer at most $191k (13.0% below list).
- To meet the 1% rule (rent ≥ 1% of price), the offer needs to be $197k (10.5% below list).
- Recommended offer: $191k (13.0% below list) — sets the bar for cash-flow.
- Cap rate 5.4% vs local median 3.7% in Deer Park — top-decile yield for the area; either an underpriced asset or a hidden risk that comps aren't pricing in. Stress-test before assuming the spread holds.
Location & tenants
- Location reads 72/100 on livability (#244 in TX) — a middle-class / working-renter tenant base. Strengths: cost of living A+, housing A+, crime A; Watch: amenities C-, commute F.
- Deer Park ISD (suburban): math 50% / reading 47% proficiency, ranked #170 of 826 in TX (top 21%) — families likely to look elsewhere, expect single-tenant / working-renter base with shorter leases.
- Zoned schools: San Jacinto El (math 40% / reading 47%, grade F, #1,269 of 4,322 statewide, top 30%, 801 students, 52% FRL); Deer Park J H (math 60% / reading 55%, grade B, #206 of 1,662 statewide, top 13%, 863 students, 40% FRL); Deer Park H S (math 57% / reading 59%, grade C, #320 of 1,632 statewide, top 20%, 4,026 students, 38% FRL) — zoned schools at 43% FRL track the district average.
- Market conditions: Rents rising (+2.3%/yr); 170 active listings in the ZIP; 2 comparable units currently listed for rent nearby; solid renter incomes; 29,883 units permitted in Harris County in 2024 (8,621 in 5+ unit buildings).
Forward outlook
- Local home prices are declining (-3.0%/yr); year-one equity from $2k of loan paydown is wiped out by about $7k of value loss. Plan a longer hold.
- Harris County population projected at +47% by 2050 — long-run rental-demand tailwind backs the buy-and-hold thesis.
Negotiation context
- Only 11 days on market — expect competitive offers; lowballing is unlikely to land.
- Current owner paid $77k; list at $220k implies a 186% gain — meaningful room to come down on a strong offer.
Risks & watch-outs
- Watch-outs: property tax is 2.6% of price.
- Climate carrying-cost: severe wind risk, 99% chance of damaging wind over 30y; extreme-heat days projected 6→20/yr by 2055 (HVAC capex compounding) — expect insurance premiums to compound above CPI over the hold.
Questions for the listing agent
- What do current leases actually rent for vs. the listed asking? Can we see a recent rent roll and the last 12 months of T-12 income?
- Built in 1962 — when were the roof, HVAC, electrical panel, plumbing, and water heater last replaced?
- Property tax is high relative to price — has the assessment been appealed recently, and will the sale trigger a re-assessment?
- Is there a deadline driving the sale (1031 exchange, divorce, estate, relocation)? That informs how much negotiation room exists.
- The area grade is low — what's the realistic commute time and amenity access for the typical tenant pool here? Any planned neighborhood developments (good or bad) we should know about?
- What's the average days-on-market for RENTAL listings here right now (not sales)? A rising rental-DOM trend means longer vacancies and softer asking-rent achievability than the comps imply.
- What's the recent tenant-quality profile in this submarket — average credit score on applications, eviction rate, late-payment / NSF rate, and stable-employment percentage? A property-management company in the area should have these aggregated.
- How much new for-sale + rental construction is in the pipeline within 1–3 miles? Heavy new supply typically softens prices + rents 12–24 months out; constrained supply supports both.
Investment metrics
- 1% rule
- 0.90% ✗
- Cap rate
- 5.41%
- Cash-on-cash
- -3.14%
- DSCR
- 0.86
- GRM
- 9.3
CMA / ARV
- ARV (on-the-fly)
- $222,056
- Comps found
- 12
Show comp detail 12 sales within ~0.75 mi
| Address | Dist | Beds/Ba | Sqft | Sold | Price | $/sf | Match |
|---|---|---|---|---|---|---|---|
| 917 Norwood St | 0.27mi | 3/2.0 | 1,447 (+7%) | 4mo | $275,000 | $190 | 73 |
| 918 Martha St | 0.24mi | 3/2.0 | 1,471 (+9%) | 2mo | $236,000 | $160 | 72 |
| 402 Alice Ln | 0.60mi | 3/2.0 | 1,326 (-2%) | 2mo | $244,500 | $184 | 67 |
| 902 Ivy Ave | 0.57mi | 3/1.5 | 1,409 (+4%) | 3mo | $234,900 | $167 | 62 |
| 1501 Deer Ave | 0.59mi | 3/2.0 | 1,304 (-4%) | 5mo | $185,000 | $142 | 62 |
| 418 E 1st St | 0.58mi | 3/1.0 | 1,382 (+2%) | 5mo | $110,000 | $80 | 62 |
| 437 E 2nd St | 0.54mi | 4/2.0 (+1) | 1,300 (-4%) | 2mo | $199,999 | $154 | 61 |
| 118 E 10th St | 0.67mi | 3/2.0 | 1,310 (-3%) | 2mo | $230,000 | $176 | 61 |
| 321 Reta Dr | 0.70mi | 3/2.0 | 1,399 (+3%) | 4mo | $229,900 | $164 | 58 |
| 1110 Ivy Ave | 0.59mi | 2/2.0 (-1) | 1,454 (+7%) | 1mo | $191,200 | $131 | 55 |
| 825 Grove St | 0.62mi | 3/1.5 | 1,215 (-10%) | 1mo | $199,000 | $164 | 52 |
| 221 E 2nd St | 0.70mi | 4/1.0 (+1) | 1,214 (-10%) | 4mo | $175,000 | $144 | 38 |
Match score weights: distance 35% · size 25% · config 20% · recency 20%. Top-matched comps best support the ARV.
Projected returns pro-forma
-3.0% appreciation · 2.26% rent growth · sell at horizon
- IRR
- -22.4%
- Equity multiple
- 0.23×
- Total profit
- $-47,212
- Equity at exit
- $32,788
- IRR
- -18.6%
- Equity multiple
- 0.03×
- Total profit
- $-59,612
- Equity at exit
- $19,013
Cash invested: $61,572 (down + closing). Projections, not guarantees.
Landlord ↔ Tenant lean methodology
- Overall (STATE)
- 87 Strongly Landlord-Friendly
- State Texas
- 87 Strongly Landlord-Friendly · R+5
- County
- — inherits STATE
- City
- — inherits STATE
ZIP-level market 77536
- Home prices YoY
- -24.8%
- Rents YoY
- 2.3%
- Active inventory
- 170
- Price-to-rent
- 9.3×
Monthly cashflow live
- Estimated rent
- $1,969 medium interval (Pro) →
- Mortgage (P&I)
- −$1,153
- Tax from tax record
- −$472 /mo · $5,661/yr
- Insurance
- −$92
- HOA
- −$0
- Vacancy / Maint / Mgmt
- −$413
- Net cashflow
- $-161
Break-even live
Sensitivity live
| Price | -10% $-37 | -5% $-99 | +0% $-161 | +5% $-224 | +10% $-286 |
|---|---|---|---|---|---|
| Rent | -10% $-317 | -5% $-239 | +0% $-161 | +5% $-84 | +10% $-6 |
| Rate | -1.0pp $-51 | -0.5pp $-105 | base $-161 | +0.5pp $-218 | +1.0pp $-276 |
UW: 25.0% down · 7.5% · 30yr · 1.5% tax · 5.0% vac · 8.0% maint · 8.0% mgmt
Financing live
Cash to close
- Down payment
- $54,975
- Closing costs
- $6,597
- Reserves months
- —
- Total cash needed
- —
Loan-product check · same deal, 3 products live
Conventional
25% down · 7.5% · 30yr
- Down + closing
- —
- Monthly P&I
- —
- Monthly cashflow
- —
- DSCR
- —
- Eligible?
- —
Personal DTI + credit; lowest rate.
DSCR
20% down · 8.5% · 30yr
- Down + closing
- —
- Monthly P&I
- —
- Monthly cashflow
- —
- DSCR
- —
- Eligible?
- —
No personal income docs; deal must DSCR.
Hard money
10% down · 12.0% · 12mo
- Down + closing
- —
- Monthly P&I
- —
- Monthly cashflow
- —
- DSCR
- —
- Eligible?
- —
Short-term bridge; refi at stabilization.
Rent comps 2 comps
| Address | Beds | Baths | Sqft | Rent | $/sqft | DOM | Units | Dist |
|---|---|---|---|---|---|---|---|---|
| 813 Luella Ave Deer Park, TX | 3.0 | 2.0 | 1266 | $1,781 | $1.41 | 45d | 1 | 0.09mi |
| 418 E 1st St Deer Park, TX | 4.0 | 2.0 | 1600 | $2,000 | $1.25 | 45d | 1 | 0.57mi |
Listing history 11 events
-
2026-06-21days on market $219,900 Pending 11 DOM
-
2026-06-18days on market $219,900 Pending 8 DOM
-
2026-06-17days on market $219,900 Pending 7 DOM
-
2026-06-16days on market $219,900 Pending 6 DOM
-
2026-06-15status $219,900 Pending 5 DOM
-
2026-06-15days on market $219,900 Active 5 DOM
-
2026-06-13status $219,900 Active 3 DOM
-
2026-06-09days on market $219,900 Coming Soon 3 DOM
-
2026-06-08days on market $219,900 Coming Soon 2 DOM
-
2026-06-07remarks 553-char remark
-
2026-06-07$219,900 Coming Soon 1 DOM
ⓘ Source: listings_history table (triggers on properties + properties_extension) + one-shot
backfill from property_details.listing_events for pre-trigger history.
Tax reassessment forecast TX · Resets to sale price
- Current annual tax
- $5,661 · $472/mo
- Projected year-2 tax
- $5,661 · $472/mo
- Expected delta
- $0/yr ($0/mo · 0.0%)
ⓘ Screening estimate from a state-policy table — verify with the county assessor before closing.
Climate risk First Street
- Flood 1/10 Low FEMA zone X (unshaded) · 0% chance over 30 yrs
- Wildfire 1/10 Low
- Heat 9/10 Extreme 6 d/yr ≥110°F today · 20 d/yr by 30 yrs out
- Wind 9/10 Extreme 99% chance of damaging wind over 30 yrs
- Air quality 2/10 Low 2 unhealthy d/yr today · 2 by 30 yrs out
Nearby sold comps map
Loading sold comps map…
Walkable amenities ~0.75 mi
Loading nearby amenities…
Taxation est. · year 1
- Rental income
- $23,624
- − Mortgage interest
- −$12,318
- − Property taxes
- −$5,661
- − Insurance
- −$1,100
- − Repairs & maintenance
- −$1,890
- − Management
- −$1,890
- − Depreciation
- −$6,397
- Taxable loss
- −$5,631
- Est. tax savings @ 24.0%
- +$1,352
- After-tax cash flow
- $-584/yr
For passive investors: Depreciation is non-cash, so a rental often shows a tax loss while cash-flowing — sheltering income. Rental losses are passive: they offset passive income freely, and up to $25,000/yr can offset ordinary (W-2) income if you actively participate and your MAGI is under $100k (phasing out to $0 by $150k); unused losses carry forward. On sale, claimed depreciation is recaptured at up to 25%, and gains may owe capital-gains tax (a 1031 exchange can defer both). Figures are a year-1 estimate at your 24.0% rate — not tax advice; consult a CPA.
Schools (NCES district)
- District
- Deer Park ISD
- NCES district ID
- 4816530
- Math proficiency
- 50% ▼ -10.00%
- Reading proficiency
- 47% ▼ -3.00%
- Median HH income
- $68,227
- Composite
- 43.3/100
- National rank
- #3039
- State rank
- #170 of 826 in TX
Livability — Deer Park
- Score
- 72/100
- State rank
- #244
- US rank
- #5835
Category grades
Schools grade is shown separately in the Schools card above.
Census & demographics
- Census place
- Deer Park, TX
- County
- Harris County · 4,702,590 people
- City population
- 33,174
- Metro
- Houston-The Woodlands-Sugar Land, TX
- Population (ZIP)
- 33,174
- Household income
- $102,045
- Rent vs Own
- Severe rent burden
- 583.0
Population outlook (Harris County) Hauer SSP2
- Today (2025)
- 5,571,493 people
- By 2030
- 6,089,821 · +9.3%
- By 2040
- 7,142,806 · +28.2%
- By 2050
- 8,185,864 · +46.9%
- By 2075
- 10,574,329 · +89.8%
- By 2100
- 12,109,958 · +117.4%
Race, ethnicity, and origin ACS 2023
- Neighborhood character
- Majority White (58%)
- Race & ethnicity
- White 58% Hispanic / Latino 36% Two or more races 15% Black 3% Native American 1%
- Hispanic origin (detail)
- Mexican 33%
- Common ancestry
- Italian 3% Slovak 2% Lithuanian 2%
- Foreign-born
- 7% · Canada
- Languages at home
- 83% English-only · Spanish 17%
Political lean MEDSL · Harris
- 2024 margin
- Lean D (+5.5) · D 52.0% · R 46.4% · Other 1.6%
- 2008→2024 swing
- +3.9pp toward D · 2008: 1.6pp · 2024: 5.5pp
- All cycles
- 2024: D+5.5 2020: D+13.3 2016: D+12.4 2012: D+0.1 2008: D+1.6
Not yet ingested
- Civics
- —
Market trends
- HPI YoY
- ▼ -83.30%
- Current HPI
- 253.1973
- Rent YoY
- ▲ 2.26%
- Metro
- Houston-The Woodlands-Sugar Land, TX
- State GDP YoY
- ▲ 3.95%
- F500 in state
- 110
Industry mix (Fortune 500 HQ in TX)
| Industry | F500 HQs | Revenue |
|---|---|---|
| Energy | 16 | $1,198B |
|
||
| Technology | 5 | $198B |
|
||
| Engineering / Construction | 4 | $72B |
|
||
| Energy Services | 3 | $60B |
|
||
| Utilities | 3 | $41B |
|
||
| Healthcare | 2 | $330B |
|
||
Price history
+185.6% since first listed3 events — show timeline
- 2026-06-06 Coming Soon $219,900 HARMLS
- 1999-10-05 Sold (Public Records) — Public Records
- 1999-09-01 Sold (Public Records) $77,000 Public Records
Property tax history
+2.8%/yrLatest (2025): $5,661 · +2.3% YoY. Source: county tax records.
Cash-flow waterfall
monthlySold comps — $/sqft
last 12 mo · ≤1 miLoading sold comps…