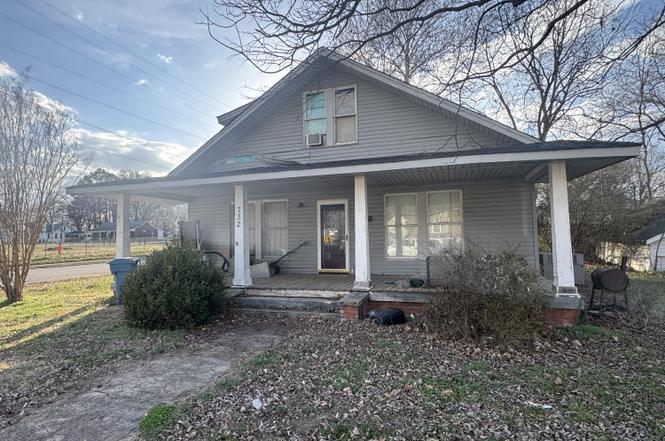
732 S Church St · Trenton, TN
Flood risk 1/10 · Minimal
- FEMA flood zone
- X (unshaded)
- Chance of flooding over 30 yrs
- 0.0%
- Est. flood insurance / yr
- $507 – $1,088
Fire risk 2/10 · Minimal
- Est. fire insurance / yr
- $949 – $1,763
Heat risk 6/10 · Moderate
- Hot days now (above 108°F)
- 7 days/yr
- Hot days in 30 yrs
- 20 days/yr
Wind risk 4/10 · Minor
- Chance of severe wind over 30 yrs
- 13.0%
Air-quality risk 1/10 · Minimal
- Unhealthy air days now
- 0 days/yr
- Unhealthy air days in 30 yrs
- 0 days/yr
Risk factors via First Street. Map © Google.
Why this score? — see what drove the B- grade
The composite is a weighted blend of 9 inputs, each scored 0–100. Each bar is that input's sub-score; the figure is the points it added to the 100-point composite (weight × sub-score).
- Cash flow +30.0/30.0
- 1% rule +10.0/10.0
- DSCR +10.0/10.0
- ARV discount +7.5/15.0
- Livability +2.6/5.0
- Rent growth +2.5/5.0
- Condition / age +2.5/5.0
- Schools +2.0/10.0
- Appreciation +0.0/10.0
$89,700
🖨 Deal sheet 📄 Offer letter ✓ Due diligence
Listing remarks MLS
VERY ATTRACTIVE OLDER HOME ON CORNER LOT ACROSS FROM ELEMENTARY SCHOOL. INSIDE FEATURES 1 BEDROOM AND BONUS ROOM UPSTAIRS. DOWN STAIRS HAS 2 BR, 2 BATH, ORIGINAL HARDWOOD FLOORS, LARGE ROOMS, NICE OAK KITCHEN CABINETS, EAT-IN KITCHEN, SEPARATE DINING ROOM. LARGE FRONT PORCH FLOOR ONLY 3 YRS OLD NICE PLACE TO HAVE YOUR MORNING . SHADY LOT.
Key facts
- 6,969 sq ft lot
- 2 parking spots
- Built 1929
Tags
Property features AI
Exterior
- Parking: 2 total parking spaces; Carport with 2 spaces
- Utilities: Public water; Public sewer; Electricity connected; Natural gas available; Water connected; Sewer connected
- Home design: Single family residence; Two-story; Raised foundation
- Construction: Vinyl siding; Raised foundation; Two levels
- Exterior features: Front porch; Corner lot; Asphalt road frontage on a city street; Publicly maintained road
Interior
- Bedrooms: 3 bedrooms on the main level
- Flooring: Hardwood
- Bathrooms: 2 full bathrooms on the main level
- Heating & cooling: Central heating; Central air; Window unit(s)
- Interior features: Hardwood floors; 5 total rooms
- Laundry & utility: Electric dryer hookup
Neighborhood map
What this means for you Summary
Snapshot
- This is a 4-bed/2.0-bath single-family listed at $90k.
Deal economics
- At list price, monthly cash flow is $499 ($6k/yr) — positive.
- The deal already cash-flows at list — no discount required.
- Meets the 1% rule at list price ($1k rent vs $90k).
- Recommended offer: $82k (9.0% below list) — sets the bar for market timing.
Location & tenants
- Location reads 51/100 on livability (#408 in TN) — a working-class tenant base; expect higher turnover. Strengths: cost of living A+, housing A-; Watch: health & safety C-, schools F, crime D-.
- Trenton (town): math 24% / reading 24% proficiency, ranked #99 of 139 in TN (top 71%) — low school quality limits family demand, transient renter base, plan for 1-2y turnover.
- Market conditions: 82 active listings in the ZIP; 155 units permitted in Gibson County in 2024 (0 in 5+ unit buildings).
Forward outlook
- Local home prices are declining (-3.0%/yr); year-one equity from $620 of loan paydown is wiped out by about $3k of value loss. Plan a longer hold.
- Gibson County population projected to shrink 8% by 2050 — rents likely to lag national; underwrite the cash flow, not the appreciation.
- At projected returns (-3.0% appreciation + 3.0% rent growth), your $25k cash investment doubles in ~6 years — after that, you're playing with house money.
Negotiation context
- It's been on market 105 days — a 9% lower offer ($82k) is reasonable based on typical stale-listing flexibility.
- 2 sale attempts since 11y ago; this cycle's ask has dropped $20k (18%) from the opening price — seller is motivated, your offer sets the floor, not the list.
- Current owner paid $35k; list at $90k implies a 156% gain — meaningful room to come down on a strong offer.
Risks & watch-outs
- Watch-outs: built in 1929 — expect roof / HVAC / electrical / plumbing capex.
- Climate carrying-cost: extreme-heat days projected 7→20/yr by 2055 (HVAC capex compounding) — expect insurance premiums to compound above CPI over the hold.
Questions for the listing agent
- It's been on market 105 days. Have you received any prior offers? Is the seller open to a 9% concession, seller financing, or rate buy-down credit?
- Built in 1929 — when were the roof, HVAC, electrical panel, plumbing, and water heater last replaced?
- Why hasn't it sold? Are there any deal-killer items the seller is aware of (foundation, flood, title, zoning, code violations)?
- Is there a deadline driving the sale (1031 exchange, divorce, estate, relocation)? That informs how much negotiation room exists.
- Schools are F-rated, which usually means shorter tenancies and higher turnover. Who's the typical renter profile here, and what's been the actual vacancy rate?
- Crime grade is D in this area — have there been break-ins, vandalism, or insurance claims at this property in the last 3 years? What carrier currently insures it and at what premium?
- What's the average days-on-market for RENTAL listings here right now (not sales)? A rising rental-DOM trend means longer vacancies and softer asking-rent achievability than the comps imply.
- What's the recent tenant-quality profile in this submarket — average credit score on applications, eviction rate, late-payment / NSF rate, and stable-employment percentage? A property-management company in the area should have these aggregated.
- How much new for-sale + rental construction is in the pipeline within 1–3 miles? Heavy new supply typically softens prices + rents 12–24 months out; constrained supply supports both.
Investment metrics
- 1% rule
- 1.52% ✓
- Cap rate
- 12.97%
- Cash-on-cash
- 23.83%
- DSCR
- 2.06
- GRM
- 5.5
CMA / ARV
No comps found within radius.
Projected returns pro-forma
-3.0% appreciation · 3.0% rent growth · sell at horizon
- IRR
- 17.0%
- Equity multiple
- 1.69×
- Total profit
- $17,225
- Equity at exit
- $13,375
- IRR
- 25.5%
- Equity multiple
- 3.22×
- Total profit
- $55,875
- Equity at exit
- $7,756
Cash invested: $25,116 (down + closing). Projections, not guarantees.
Landlord ↔ Tenant lean methodology
- Overall (STATE)
- 87 Strongly Landlord-Friendly
- State Tennessee
- 87 Strongly Landlord-Friendly · R+13
- County
- — inherits STATE
- City
- — inherits STATE
ZIP-level market 38382
- Home prices YoY
- -14.0%
- Active inventory
- 82
- Price-to-rent
- 5.5×
Monthly cashflow live
- Estimated rent
- $1,359 medium interval (Pro) →
- Mortgage (P&I)
- −$470
- Tax from tax record
- −$67 /mo · $807/yr
- Insurance
- −$37
- HOA
- −$0
- Vacancy / Maint / Mgmt
- −$285
- Net cashflow
- $499
Break-even live
UW: 25.0% down · 7.5% · 30yr · 1.5% tax · 5.0% vac · 8.0% maint · 8.0% mgmt
Financing live
Cash to close
- Down payment
- $22,425
- Closing costs
- $2,691
- Reserves months
- —
- Total cash needed
- —
Loan-product check · same deal, 3 products live
Conventional
25% down · 7.5% · 30yr
- Down + closing
- —
- Monthly P&I
- —
- Monthly cashflow
- —
- DSCR
- —
- Eligible?
- —
Personal DTI + credit; lowest rate.
DSCR
20% down · 8.5% · 30yr
- Down + closing
- —
- Monthly P&I
- —
- Monthly cashflow
- —
- DSCR
- —
- Eligible?
- —
No personal income docs; deal must DSCR.
Hard money
10% down · 12.0% · 12mo
- Down + closing
- —
- Monthly P&I
- —
- Monthly cashflow
- —
- DSCR
- —
- Eligible?
- —
Short-term bridge; refi at stabilization.
Listing history 20 events
-
2026-06-18days on market $89,700 Active 105 DOM
-
2026-06-17days on market $89,700 Active 104 DOM
-
2026-06-16days on market $89,700 Active 103 DOM
-
2026-06-15days on market $89,700 Active 102 DOM
-
2026-06-13days on market $89,700 Active 100 DOM
-
2026-06-12pricedays on market $89,700 Active 99 DOM
-
2026-06-09days on market $98,900 Active 96 DOM
-
2026-06-08days on market $98,900 Active 95 DOM
-
2026-06-08days on market $98,900 Active 94 DOM
-
2026-06-07days on market $98,900 Active 93 DOM
-
2026-06-03days on market $98,900 Active 90 DOM
-
2026-06-02days on market $98,900 Active 89 DOM
-
2026-06-01days on market $98,900 Active 88 DOM
-
2026-05-31days on market $98,900 Active 87 DOM
-
2026-04-20price $99,000
-
2026-03-04$109,900 Active
-
2015-08-31soldstatus $35,000 340-char remark
Show marketing remark (340 chars)
VERY ATTRACTIVE OLDER HOME ON CORNER LOT ACROSS FROM ELEMENTARY SCHOOL. INSIDE FEATURES 1 BEDROOM AND BONUS ROOM UPSTAIRS. DOWN STAIRS HAS 2 BR, 2 BATH, ORIGINAL HARDWOOD FLOORS, LARGE ROOMS, NICE OAK KITCHEN CABINETS, EAT-IN KITCHEN, SEPARATE DINING ROOM. LARGE FRONT PORCH FLOOR ONLY 3 YRS OLD NICE PLACE TO HAVE YOUR MORNING . SHADY LOT.
-
2015-08-31soldstatus $35,000
Show marketing remark (340 chars)
VERY ATTRACTIVE OLDER HOME ON CORNER LOT ACROSS FROM ELEMENTARY SCHOOL. INSIDE FEATURES 1 BEDROOM AND BONUS ROOM UPSTAIRS. DOWN STAIRS HAS 2 BR, 2 BATH, ORIGINAL HARDWOOD FLOORS, LARGE ROOMS, NICE OAK KITCHEN CABINETS, EAT-IN KITCHEN, SEPARATE DINING ROOM. LARGE FRONT PORCH FLOOR ONLY 3 YRS OLD NICE PLACE TO HAVE YOUR MORNING . SHADY LOT.
-
2015-08-12$35,000 340-char remark
Show marketing remark (340 chars)
VERY ATTRACTIVE OLDER HOME ON CORNER LOT ACROSS FROM ELEMENTARY SCHOOL. INSIDE FEATURES 1 BEDROOM AND BONUS ROOM UPSTAIRS. DOWN STAIRS HAS 2 BR, 2 BATH, ORIGINAL HARDWOOD FLOORS, LARGE ROOMS, NICE OAK KITCHEN CABINETS, EAT-IN KITCHEN, SEPARATE DINING ROOM. LARGE FRONT PORCH FLOOR ONLY 3 YRS OLD NICE PLACE TO HAVE YOUR MORNING . SHADY LOT.
-
2001-01-06soldstatus $70,000
ⓘ Source: listings_history table (triggers on properties + properties_extension) + one-shot
backfill from property_details.listing_events for pre-trigger history.
Tax reassessment forecast TN · Resets to sale price
- Current annual tax
- $807 · $67/mo
- Projected year-2 tax
- $807 · $67/mo
- Expected delta
- $0/yr ($0/mo · 0.0%)
ⓘ Screening estimate from a state-policy table — verify with the county assessor before closing.
Climate risk First Street
- Flood 1/10 Low FEMA zone X (unshaded) · 0% chance over 30 yrs
- Wildfire 2/10 Low
- Heat 6/10 Major 7 d/yr ≥108°F today · 20 d/yr by 30 yrs out
- Wind 4/10 Moderate 13% chance of damaging wind over 30 yrs
- Air quality 1/10 Low 0 unhealthy d/yr today · 0 by 30 yrs out
Nearby sold comps map
Loading sold comps map…
Walkable amenities ~0.75 mi
Loading nearby amenities…
Taxation est. · year 1
- Rental income
- $16,311
- − Mortgage interest
- −$5,025
- − Property taxes
- −$807
- − Insurance
- −$448
- − Repairs & maintenance
- −$1,305
- − Management
- −$1,305
- − Depreciation
- −$2,609
- Taxable income
- $4,811
- Est. tax owed @ 24.0%
- −$1,155
- After-tax cash flow
- $4,830/yr
For passive investors: Depreciation is non-cash, so a rental often shows a tax loss while cash-flowing — sheltering income. Rental losses are passive: they offset passive income freely, and up to $25,000/yr can offset ordinary (W-2) income if you actively participate and your MAGI is under $100k (phasing out to $0 by $150k); unused losses carry forward. On sale, claimed depreciation is recaptured at up to 25%, and gains may owe capital-gains tax (a 1031 exchange can defer both). Figures are a year-1 estimate at your 24.0% rate — not tax advice; consult a CPA.
Schools (NCES district)
- District
- Trenton
- NCES district ID
- 4704100
- Math proficiency
- 24% ▼ -13.00%
- Reading proficiency
- 24% ▼ -2.00%
- Median HH income
- $33,930
- Composite
- 19.7/100
- National rank
- #8723
- State rank
- #99 of 139 in TN
Livability — Trenton
- Score
- 51/100
- State rank
- #408
- US rank
- #25391
Category grades
Schools grade is shown separately in the Schools card above.
Census & demographics
- Census place
- Trenton, TN
- Population (ZIP)
- 8,163
Population outlook (Gibson County) Hauer SSP2
- Today (2025)
- 48,793 people
- By 2030
- 48,221 · -1.2%
- By 2040
- 46,793 · -4.1%
- By 2050
- 44,909 · -8.0%
- By 2075
- 40,191 · -17.6%
- By 2100
- 33,574 · -31.2%
Race, ethnicity, and origin ACS 2023
- Neighborhood character
- Predominantly White (75%)
- Race & ethnicity
- White 75% Black 17% Two or more races 5% Hispanic / Latino 3%
- Common ancestry
- Italian 1% Portuguese 1% Slovak 1%
- Foreign-born
- 1% · Canada
- Languages at home
- 98% English-only · Spanish 1%
Political lean MEDSL · Gibson
- 2024 margin
- Solid R (+52.0) · D 23.6% · R 75.5%
- 2008→2024 swing
- -23.2pp toward R · 2008: -28.8pp · 2024: -52.0pp
- All cycles
- 2024: R+52.0 2020: R+47.0 2016: R+43.8 2012: R+32.1 2008: R+28.8
Not yet ingested
- Civics
- —
Market trends
- HPI YoY
- ▼ -30.72%
- Current HPI
- 188.1546
- Rent YoY
- —
- Metro
- —
- State GDP YoY
- ▲ 2.78%
- F500 in state
- 22
Industry mix (Fortune 500 HQ in TN)
| Industry | F500 HQs | Revenue |
|---|---|---|
| Healthcare | 3 | $91B |
|
||
| Retail | 3 | $72B |
|
||
| Transportation / Logistics | 1 | $88B |
|
||
| Paper / Packaging | 1 | $19B |
|
||
| Insurance | 1 | $13B |
|
||
| Energy | 1 | $12B |
|
||
Price history
+41.4% since first listed6 events — show timeline
- 2026-04-20 Price Changed $99,000 CWTAR
- 2026-03-04 Listed $109,900 CWTAR
- 2015-08-31 Sold (Public Records) $35,000 Public Records
- 2015-08-31 Sold (MLS) $35,000 CWTAR
- 2015-08-12 Listed $35,000 CWTAR
- 2001-01-06 Sold (Public Records) $70,000 Public Records
Property tax history
+3.8%/yrLatest (2025): $807 · +56.1% YoY. Source: county tax records.
Cash-flow waterfall
monthlySold comps — $/sqft
last 12 mo · ≤1 miLoading sold comps…