 Multi-family
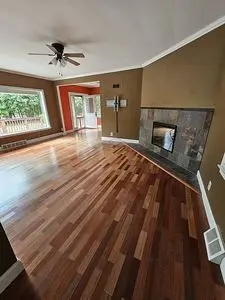
47 Franklin Ave · SUNY Oswego, NY
Flood risk 1/10 · Minimal
- FEMA flood zone
- X (unshaded)
- Chance of flooding over 30 yrs
- 0.0%
- Est. flood insurance / yr
- $507 – $1,088
Fire risk 2/10 · Minimal
- Est. fire insurance / yr
- $691 – $1,283
Heat risk 2/10 · Minimal
- Hot days now (above 93°F)
- 7 days/yr
- Hot days in 30 yrs
- 17 days/yr
Wind risk 1/10 · Minimal
- Chance of severe wind over 30 yrs
- 0.0%
Air-quality risk 2/10 · Minimal
- Unhealthy air days now
- 2 days/yr
- Unhealthy air days in 30 yrs
- 2 days/yr
Risk factors via First Street. Map © Google.
Why this score? — see what drove the B- grade
The composite is a weighted blend of 9 inputs, each scored 0–100. Each bar is that input's sub-score; the figure is the points it added to the 100-point composite (weight × sub-score).
- Cash flow +26.6/30.0
- DSCR +9.1/10.0
- ARV discount +7.5/15.0
- 1% rule +7.4/10.0
- Rent growth +5.0/5.0
- Appreciation +3.9/10.0
- Schools +3.8/10.0
- Livability +3.1/5.0
- Condition / age +2.5/5.0
$220,000
🖨 Deal sheet 📄 Offer letter ✓ Due diligence
Multi-family units
County records classify this as Multi-Family (2-4 Unit). Listing-text estimate: 1 unit. estimate disagrees with records
Listing remarks
Great location next to SUNY Oswego, walking distance to Lake Ontario. New Roof (Nov. 2025) Two rental units.
Key facts
- New roof
- Built 1960
- Listed 22 days
Tags
Neighborhood map
What this means for you Summary
Snapshot
- This is a 3-bed/2.0-bath multifamily listed at $220k.
Deal economics
- At list price, monthly cash flow is $588 ($7k/yr) — positive.
- The deal already cash-flows at list — no discount required.
- Meets the 1% rule at list price ($3k rent vs $220k).
- Recommended offer: $217k (1.5% below list) — sets the bar for market timing.
Location & tenants
- Location reads 61/100 on livability (#911 in NY) — a middle-class / working-renter tenant base. Strengths: commute A+, health & safety A+, crime A; Watch: amenities F, employment F, housing F.
- Oswego City School District (town): math 39% / reading 51% proficiency, ranked #465 of 590 in NY (top 79%) — families likely to look elsewhere, expect single-tenant / working-renter base with shorter leases.
- Market conditions: Rents rising fast (+19.2%/yr); 168 active listings in the ZIP; 20 comparable units currently listed for rent nearby; rentals leasing fast (median 14d on market — plan ~1-2 weeks tenant-placement turnaround); 172 units permitted in Oswego County in 2024 (27 in 5+ unit buildings).
- At $2,736/mo this rent would consume 50% of the median local household income ($65k/yr) (locally 1341% of renters already pay >50% of income on rent) — very limited rent-growth headroom before tenants either downsize or default.
Forward outlook
- Local home prices are declining (-2.2%/yr); year-one equity from $2k of loan paydown is wiped out by about $5k of value loss. Plan a longer hold.
- Oswego County population projected at -23% by 2050 — secular population decline; favor cash flow + early exit over multi-decade hold.
- At projected returns (-2.2% appreciation + 8.0% rent growth), your $62k cash investment doubles in ~7 years — after that, you're playing with house money.
Negotiation context
- It's been on market 22 days — a 2% lower offer ($217k) is reasonable based on typical stale-listing flexibility.
- Current owner paid $118k; list at $220k implies a 86% gain — meaningful room to come down on a strong offer.
Questions for the listing agent
- Built in 1960 — when were the roof, HVAC, electrical panel, plumbing, and water heater last replaced?
- Is there a deadline driving the sale (1031 exchange, divorce, estate, relocation)? That informs how much negotiation room exists.
- What's the average days-on-market for RENTAL listings here right now (not sales)? A rising rental-DOM trend means longer vacancies and softer asking-rent achievability than the comps imply.
- What's the recent tenant-quality profile in this submarket — average credit score on applications, eviction rate, late-payment / NSF rate, and stable-employment percentage? A property-management company in the area should have these aggregated.
- How much new apartment / multifamily construction is in the pipeline within 1–3 miles? Heavy new supply (>2% of stock underway) typically softens rents 12–24 months out; light construction supports rent growth.
Investment metrics
- 1% rule
- 1.24% ✓
- Cap rate
- 9.50%
- Cash-on-cash
- 11.46%
- DSCR
- 1.51
- GRM
- 6.7
CMA / ARV
No comps found within radius.
Projected returns pro-forma
-2.25% appreciation · 8.0% rent growth · sell at horizon
- IRR
- 8.7%
- Equity multiple
- 1.38×
- Total profit
- $23,306
- Equity at exit
- $40,194
- IRR
- 20.6%
- Equity multiple
- 3.29×
- Total profit
- $140,773
- Equity at exit
- $31,964
Cash invested: $61,600 (down + closing). Projections, not guarantees.
Landlord ↔ Tenant lean methodology
- Overall (STATE)
- 15 Strongly Tenant-Friendly
- State New York
- 15 Strongly Tenant-Friendly · D+10
- County
- — inherits STATE
- City
- — inherits STATE
ZIP-level market 13126
- Home prices YoY
- -0.8%
- Rents YoY
- 19.2%
- Active inventory
- 168
- Price-to-rent
- 13.4×
Monthly cashflow live
- Estimated rent
- $2,736 high interval (Pro) →
- Mortgage (P&I)
- −$1,154
- Tax from tax record
- −$328 /mo · $3,932/yr
- Insurance
- −$92
- HOA
- −$0
- Vacancy / Maint / Mgmt
- −$575
- Net cashflow
- $588
Break-even live
2-unit breakdown (identical units grouped — click to expand)
| Units | Beds | Baths | Est. rent |
|---|---|---|---|
| 2× units | 2 | 1 | $2,736 |
| #1 | 2 | 1 | $1,368 |
| #2 | 2 | 1 | $1,368 |
| Total (2 units) | $2,736 | ||
UW: 25.0% down · 7.5% · 30yr · 1.5% tax · 5.0% vac · 8.0% maint · 8.0% mgmt
Financing live
Cash to close
- Down payment
- $55,000
- Closing costs
- $6,600
- Reserves months
- —
- Total cash needed
- —
Loan-product check · same deal, 3 products live
Conventional
25% down · 7.5% · 30yr
- Down + closing
- —
- Monthly P&I
- —
- Monthly cashflow
- —
- DSCR
- —
- Eligible?
- —
Personal DTI + credit; lowest rate.
DSCR
20% down · 8.5% · 30yr
- Down + closing
- —
- Monthly P&I
- —
- Monthly cashflow
- —
- DSCR
- —
- Eligible?
- —
No personal income docs; deal must DSCR.
Hard money
10% down · 12.0% · 12mo
- Down + closing
- —
- Monthly P&I
- —
- Monthly cashflow
- —
- DSCR
- —
- Eligible?
- —
Short-term bridge; refi at stabilization.
Rent comps 20 comps
| Address | Beds | Baths | Sqft | Rent | $/sqft | DOM | Units | Dist |
|---|---|---|---|---|---|---|---|---|
| 120 Sheldon Ave Unit A Oswego, NY | 4.0 | 2.0 | 2100 | $2,480 | $1.18 | 13d | 1 | 0.21mi |
| 164 W Schuyler St Unit A Oswego, NY | 3.0 | 2.0 | 1400 | $1,755 | $1.25 | 13d | 1 | 0.80mi |
| 161 W Bridge St Unit A Oswego, NY | 4.0 | 2.0 | 1400 | $2,240 | $1.60 | 13d | 1 | 0.81mi |
| 153 W Bridge St Unit A Oswego, NY | 4.0 | 1.5 | 1800 | $2,340 | $1.30 | 13d | 1 | 0.84mi |
| 143 Liberty St Unit A Oswego, NY | 4.0 | 2.0 | 1700 | $2,480 | $1.46 | 13d | 1 | 0.85mi |
| 85 Liberty St Unit A Oswego, NY | 4.0 | 2.0 | 1800 | $2,500 | $1.39 | 13d | 1 | 0.87mi |
| 148 W Seneca St Unit A Oswego, NY | 4.0 | 2.0 | 1800 | $2,400 | $1.33 | 13d | 1 | 0.87mi |
| 144 W Bridge St Unit A Oswego, NY | 4.0 | 2.0 | 2000 | $2,400 | $1.20 | 13d | 1 | 0.88mi |
| 141 W Cayuga St Oswego, NY | 4.0 | 1.0 | 1311 | $2,100 | $1.60 | 13d | 1 | 0.89mi |
| 6 Lathrop St Oswego, NY | 3.0 | 1.0 | 1100 | $1,725 | $1.57 | 13d | 1 | 0.90mi |
| 138 W Cayuga St Unit A Oswego, NY | 4.0 | 2.0 | 2000 | $2,300 | $1.15 | 13d | 1 | 0.90mi |
| 136 W Cayuga St Unit A Oswego, NY | 4.0 | 2.0 | 1600 | $2,300 | $1.44 | 13d | 1 | 0.91mi |
| 9 Lathrop St Unit A Oswego, NY | 4.0 | 2.0 | 2100 | $2,500 | $1.19 | 13d | 1 | 0.92mi |
| 130 W Bridge St Unit A Oswego, NY | 4.0 | 2.0 | 1700 | $2,500 | $1.47 | 13d | 1 | 0.94mi |
| 135 W Mohawk St Oswego, NY | 3.0 | 1.0 | 1103 | $1,700 | $1.54 | 13d | 1 | 0.95mi |
| 23 NW 9th St Oswego, NY | 4.0 | 1.5 | 1700 | $2,300 | $1.35 | 13d | 1 | 1.01mi |
| 105 W Oneida St Unit A Oswego, NY | 4.0 | 2.0 | 1800 | $2,540 | $1.41 | 13d | 1 | 1.04mi |
| 103 W 8th St Unit A Oswego, NY | 4.0 | 2.0 | 1800 | $2,400 | $1.33 | 13d | 1 | 1.05mi |
| 39 W 6th St Unit 2-A Oswego, NY | 3.0 | 1.0 | 1500 | $1,725 | $1.15 | 13d | 1 | 1.17mi |
| 25 W Mohawk St Unit TH Oswego, NY | 3.0 | 1.0 | 1150 | $1,745 | $1.52 | 44d | 1 | 1.40mi |
Listing history 16 events
-
2026-06-18days on market $220,000 Active 22 DOM
-
2026-06-17days on market $220,000 Active 21 DOM
-
2026-06-16days on market $220,000 Active 20 DOM
-
2026-06-15days on market $220,000 Active 19 DOM
-
2026-06-14days on market $220,000 Active 17 DOM
-
2026-06-13days on market $220,000 Active 16 DOM
-
2026-06-10days on market $220,000 Active 14 DOM
-
2026-06-08days on market $220,000 Active 12 DOM
-
2026-06-07days on market $220,000 Active 11 DOM
-
2026-06-02days on market $220,000 Active 6 DOM
-
2026-06-01days on market $220,000 Active 5 DOM
-
2026-05-31days on market $220,000 Active 4 DOM
-
2026-05-30days on market $220,000 Active 3 DOM
-
2026-05-28$220,000 Active
-
2008-03-07soldstatus $118,000
-
2006-09-13soldstatus $69,400
ⓘ Source: listings_history table (triggers on properties + properties_extension) + one-shot
backfill from property_details.listing_events for pre-trigger history.
Tax reassessment forecast NY · Partial reset (capped growth)
- Current annual tax
- $3,932 · $328/mo
- Projected year-2 tax
- $3,932 · $328/mo
- Expected delta
- $0/yr ($0/mo · 0.0%)
ⓘ Screening estimate from a state-policy table — verify with the county assessor before closing.
Climate risk First Street
- Flood 1/10 Low FEMA zone X (unshaded) · 0% chance over 30 yrs
- Wildfire 2/10 Low
- Heat 2/10 Low 7 d/yr ≥93°F today · 17 d/yr by 30 yrs out
- Wind 1/10 Low 0% chance of damaging wind over 30 yrs
- Air quality 2/10 Low 2 unhealthy d/yr today · 2 by 30 yrs out
Nearby sold comps map
Loading sold comps map…
Walkable amenities ~0.75 mi
Loading nearby amenities…
Taxation est. · year 1
- Rental income
- $32,832
- − Mortgage interest
- −$12,323
- − Property taxes
- −$3,932
- − Insurance
- −$1,100
- − Repairs & maintenance
- −$2,627
- − Management
- −$2,627
- − Depreciation
- −$6,400
- Taxable income
- $3,823
- Est. tax owed @ 24.0%
- −$918
- After-tax cash flow
- $6,143/yr
For passive investors: Depreciation is non-cash, so a rental often shows a tax loss while cash-flowing — sheltering income. Rental losses are passive: they offset passive income freely, and up to $25,000/yr can offset ordinary (W-2) income if you actively participate and your MAGI is under $100k (phasing out to $0 by $150k); unused losses carry forward. On sale, claimed depreciation is recaptured at up to 25%, and gains may owe capital-gains tax (a 1031 exchange can defer both). Figures are a year-1 estimate at your 24.0% rate — not tax advice; consult a CPA.
Schools (NCES district)
- District
- Oswego City School District
- NCES district ID
- 3622050
- Math proficiency
- 39% ▼ -7.00%
- Reading proficiency
- 51% ▲ 9.00%
- Median HH income
- $45,835
- Composite
- 38.2/100
- National rank
- #4257
- State rank
- #465 of 590 in NY
Livability — SUNY Oswego
- Score
- 61/100
- State rank
- #911
- US rank
- #17822
Category grades
Schools grade is shown separately in the Schools card above.
Census & demographics
- County
- Oswego County · 36,495 people
- City population
- 36,495
- Metro
- Syracuse, NY
- Population (ZIP)
- 36,495
- Household income
- $65,346
- Rent vs Own
- Severe rent burden
- 1341.0
Population outlook (Oswego County) Hauer SSP2
- Today (2025)
- 114,465 people
- By 2030
- 109,968 · -3.9%
- By 2040
- 99,205 · -13.3%
- By 2050
- 87,979 · -23.1%
- By 2075
- 65,100 · -43.1%
- By 2100
- 47,117 · -58.8%
Race, ethnicity, and origin ACS 2023
- Neighborhood character
- Predominantly White (87%)
- Race & ethnicity
- White 87% Hispanic / Latino 5% Two or more races 5% Black 2% Asian 2%
- Hispanic origin (detail)
- Mexican 1% Puerto Rican 2%
- Common ancestry
- Romanian 6% Lithuanian 4% Italian 2%
- Foreign-born
- 3% · Canada
- Languages at home
- 93% English-only · Spanish 3% Other Asian/Pacific 1% Other Indo-European 1%
Political lean MEDSL · Oswego
- 2024 margin
- Strong R (+24.2) · D 37.9% · R 62.1%
- 2008→2024 swing
- -26.6pp toward R · 2008: 2.5pp · 2024: -24.2pp
- All cycles
- 2024: R+24.2 2020: R+20.2 2016: R+23.2 2012: D+7.9 2008: D+2.5
Not yet ingested
- Civics
- —
Market trends
- HPI YoY
- ▼ -2.25%
- Current HPI
- 295.5134
- Rent YoY
- ▲ 19.18%
- Metro
- Syracuse, NY
- State GDP YoY
- ▲ 2.60%
- F500 in state
- 92
Industry mix (Fortune 500 HQ in NY)
| Industry | F500 HQs | Revenue |
|---|---|---|
| Financial Services | 10 | $950B |
|
||
| Consumer Goods | 9 | $162B |
|
||
| Insurance | 4 | $225B |
|
||
| Telecommunications | 2 | $144B |
|
||
| Pharmaceuticals | 2 | $112B |
|
||
| Media / Entertainment | 2 | $69B |
|
||
Price history
+217.0% since first listed3 events — show timeline
- 2026-05-28 Listed $220,000 FSBO.com
- 2008-03-07 Sold (Public Records) $118,000 Public Records
- 2006-09-13 Sold (Public Records) $69,400 Public Records
Property tax history
+10.5%/yrLatest (2025): $3,932 · +7.3% YoY. Source: county tax records.
Cash-flow waterfall
monthlySold comps — $/sqft
last 12 mo · ≤1 miLoading sold comps…