187 William Cleary Rd · Mulberry, NC
Flood risk 1/10 · Minimal
- FEMA flood zone
- X (unshaded)
- Chance of flooding over 30 yrs
- 0.0%
- Est. flood insurance / yr
- $473 – $860
Fire risk 5/10 · Moderate
- Est. fire insurance / yr
- $906 – $1,684
Heat risk 2/10 · Minimal
- Hot days now (above 93°F)
- 6 days/yr
- Hot days in 30 yrs
- 16 days/yr
Wind risk 2/10 · Minimal
- Chance of severe wind over 30 yrs
- —
Air-quality risk 1/10 · Minimal
- Unhealthy air days now
- 0 days/yr
- Unhealthy air days in 30 yrs
- 0 days/yr
Risk factors via First Street. Map © Google.
Why this score? — see what drove the C- grade
The composite is a weighted blend of 9 inputs, each scored 0–100. Each bar is that input's sub-score; the figure is the points it added to the 100-point composite (weight × sub-score).
- Cash flow +15.0/30.0
- ARV discount +7.5/15.0
- 1% rule +5.0/10.0
- DSCR +5.0/10.0
- Appreciation +5.0/10.0
- Schools +4.3/10.0
- Livability +3.3/5.0
- Rent growth +2.5/5.0
- Condition / age +2.5/5.0
$19,900
🖨 Deal sheet (PDF) 📄 Offer letter ✓ Due diligence
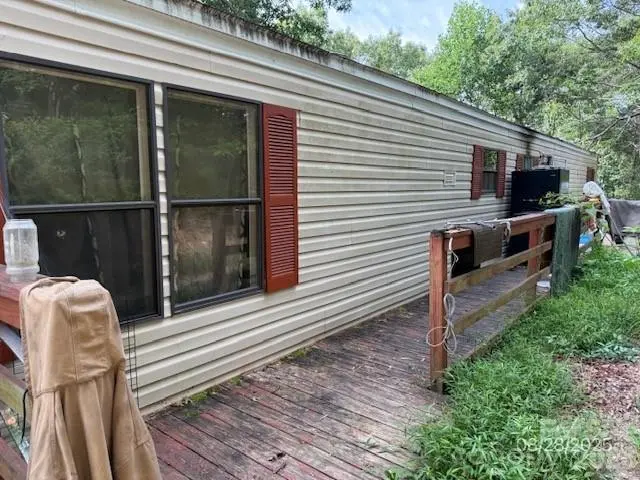
Listing remarks
Investment opportunity nestled again the Virginia State Line. Convenient to the Parkway and downtown Wilkesboro! Roll up your sleeves and bring your tool box! 30-day Freddie Mac First Look period ends on 6/28/2026
Key facts
- 1.07 acre lot
- Built 2001
- Listed 24 days
Property features AI
Finance
- Other: Lot size about 1.07 acres; Zoning: R (residential)
- HOA & community: No HOA
Exterior
- Parking: No main-level garage; Other parking features (see remarks)
- Utilities: Water: Other (see remarks); Sewer: Other (see remarks)
- Home design: Manufactured single-family residence; One level
- Construction: Manufactured construction; Construction materials: Other (see remarks); Foundation: Other (see remarks)
- Exterior features: Gravel road access; Private maintained road (and other - see remarks)
Interior
- Kitchen: Appliances: Other (see remarks)
- Bedrooms: 3 bedrooms on the main level
- Bathrooms: 1 full bathroom on the main level
- Heating & cooling: Heating: Other (see remarks); Cooling: Other (see remarks)
- Interior features: 5 total rooms; Other interior features (see remarks)
- Laundry & utility: Laundry features: Other (see remarks)
Neighborhood map
What this means for you Summary
Snapshot
- This is a 3-bed/1.0-bath manufactured listed at $20k.
Deal economics
- At list price, monthly cash flow is $621 ($7k/yr) — positive.
- The deal already cash-flows at list — no discount required.
- Meets the 1% rule at list price ($961 rent vs $20k).
- Recommended offer: $20k (1.5% below list) — sets the bar for market timing.
Location & tenants
- Location reads 66/100 on livability (#284 in NC) — a middle-class / working-renter tenant base. Strengths: crime A+, cost of living A+, housing A+; Watch: health & safety C-, schools F, amenities F.
- Wilkes County Schools (rural): math 55% / reading 50% proficiency, ranked #59 of 178 in NC (top 33%) — acceptable for families but not a draw, mixed tenant base, ~2y average lease.
- Market conditions: 42 active listings in the ZIP; 134 units permitted in Wilkes County in 2024 (0 in 5+ unit buildings).
Forward outlook
- In year one you build about $735 of equity ($138 loan paydown + $597 appreciation (3.0% local appreciation)).
- Wilkes County population projected at -18% by 2050 — secular population decline; favor cash flow + early exit over multi-decade hold.
- At projected returns (3.0% appreciation + 3.0% rent growth), your $6k cash investment doubles in ~1 year — after that, you're playing with house money.
Negotiation context
- It's been on market 24 days — a 2% lower offer ($20k) is reasonable based on typical stale-listing flexibility.
Risks & watch-outs
- Climate carrying-cost: moderate wildfire risk — expect insurance premiums to compound above CPI over the hold.
Questions for the listing agent
- Is there a deadline driving the sale (1031 exchange, divorce, estate, relocation)? That informs how much negotiation room exists.
- Schools are F-rated, which usually means shorter tenancies and higher turnover. Who's the typical renter profile here, and what's been the actual vacancy rate?
- What's the average days-on-market for RENTAL listings here right now (not sales)? A rising rental-DOM trend means longer vacancies and softer asking-rent achievability than the comps imply.
- What's the recent tenant-quality profile in this submarket — average credit score on applications, eviction rate, late-payment / NSF rate, and stable-employment percentage? A property-management company in the area should have these aggregated.
- How much new for-sale + rental construction is in the pipeline within 1–3 miles? Heavy new supply typically softens prices + rents 12–24 months out; constrained supply supports both.
Investment metrics
- 1% rule
- 4.83% ✓
- Cap rate
- 43.73%
- Cash-on-cash
- 133.70%
- DSCR
- 6.95
- GRM
- 1.7
CMA / ARV
No comps found within radius.
Projected returns pro-forma
3.0% appreciation · 3.0% rent growth · sell at horizon
- IRR
- —
- Equity multiple
- 8.53×
- Total profit
- $41,954
- Equity at exit
- $8,948
- IRR
- —
- Equity multiple
- 17.86×
- Total profit
- $93,959
- Equity at exit
- $13,790
Cash invested: $5,572 (down + closing). Projections, not guarantees.
Landlord ↔ Tenant lean methodology
- Overall (STATE)
- 85 Strongly Landlord-Friendly
- State North Carolina
- 85 Strongly Landlord-Friendly · R+3
- County
- — inherits STATE
- City
- — inherits STATE
ZIP-level market 28649
- Active inventory
- 42
- Price-to-rent
- 1.7×
Monthly cashflow live
- Estimated rent
- $961 medium interval (Pro) →
- Mortgage (P&I)
- −$104
- Tax from tax record
- −$26 /mo · $307/yr
- Insurance
- −$8
- HOA
- −$0
- Vacancy / Maint / Mgmt
- −$202
- Net cashflow
- $621
Break-even live
Sensitivity live
| Price | -10% $632 | -5% $626 | +0% $621 | +5% $615 | +10% $610 |
|---|---|---|---|---|---|
| Rent | -10% $545 | -5% $583 | +0% $621 | +5% $659 | +10% $697 |
| Rate | -1.0pp $631 | -0.5pp $626 | base $621 | +0.5pp $616 | +1.0pp $610 |
UW: 25.0% down · 7.5% · 30yr · 1.5% tax · 5.0% vac · 8.0% maint · 8.0% mgmt
Financing live
Cash to close
- Down payment
- $4,975
- Closing costs
- $597
- Reserves months
- —
- Total cash needed
- —
Loan-product check · same deal, 3 products live
Conventional
25% down · 7.5% · 30yr
- Down + closing
- —
- Monthly P&I
- —
- Monthly cashflow
- —
- DSCR
- —
- Eligible?
- —
Personal DTI + credit; lowest rate.
DSCR
20% down · 8.5% · 30yr
- Down + closing
- —
- Monthly P&I
- —
- Monthly cashflow
- —
- DSCR
- —
- Eligible?
- —
No personal income docs; deal must DSCR.
Hard money
10% down · 12.0% · 12mo
- Down + closing
- —
- Monthly P&I
- —
- Monthly cashflow
- —
- DSCR
- —
- Eligible?
- —
Short-term bridge; refi at stabilization.
Listing history 18 events
-
2026-06-21days on market $19,900 Active 24 DOM
-
2026-06-19days on market $19,900 Active 22 DOM
-
2026-06-18days on market $19,900 Active 21 DOM
-
2026-06-17days on market $19,900 Active 20 DOM
-
2026-06-16days on market $19,900 Active 19 DOM
-
2026-06-15days on market $19,900 Active 18 DOM
-
2026-06-14days on market $19,900 Active 16 DOM
-
2026-06-12remarks 214-char remark
-
2026-06-12days on market $19,900 Active 15 DOM
-
2026-06-09days on market $19,900 Active 12 DOM
-
2026-06-08days on market $19,900 Active 11 DOM
-
2026-06-07days on market $19,900 Active 10 DOM
-
2026-06-03days on market $19,900 Active 6 DOM
-
2026-06-02days on market $19,900 Active 5 DOM
-
2026-06-01days on market $19,900 Active 4 DOM
-
2026-05-31days on market $19,900 Active 3 DOM
-
2026-05-30days on market $19,900 Active 2 DOM
-
2026-05-28$19,900 Active
ⓘ Source: listings_history table (triggers on properties + properties_extension) + one-shot
backfill from property_details.listing_events for pre-trigger history.
Tax reassessment forecast NC · Resets to sale price
- Current annual tax
- $307 · $26/mo
- Projected year-2 tax
- $307 · $26/mo
- Expected delta
- $0/yr ($0/mo · 0.0%)
ⓘ Screening estimate from a state-policy table — verify with the county assessor before closing.
Climate risk First Street
- Flood 1/10 Low FEMA zone X (unshaded) · 0% chance over 30 yrs
- Wildfire 5/10 Major
- Heat 2/10 Low 6 d/yr ≥93°F today · 16 d/yr by 30 yrs out
- Wind 2/10 Low
- Air quality 1/10 Low 0 unhealthy d/yr today · 0 by 30 yrs out
Nearby sold comps map
Loading sold comps map…
Walkable amenities ~0.75 mi
Loading nearby amenities…
Taxation est. · year 1
- Rental income
- $11,530
- − Mortgage interest
- −$1,115
- − Property taxes
- −$307
- − Insurance
- −$100
- − Repairs & maintenance
- −$922
- − Management
- −$922
- − Depreciation
- −$579
- Taxable income
- $7,585
- Est. tax owed @ 24.0%
- −$1,820
- After-tax cash flow
- $5,630/yr
For passive investors: Depreciation is non-cash, so a rental often shows a tax loss while cash-flowing — sheltering income. Rental losses are passive: they offset passive income freely, and up to $25,000/yr can offset ordinary (W-2) income if you actively participate and your MAGI is under $100k (phasing out to $0 by $150k); unused losses carry forward. On sale, claimed depreciation is recaptured at up to 25%, and gains may owe capital-gains tax (a 1031 exchange can defer both). Figures are a year-1 estimate at your 24.0% rate — not tax advice; consult a CPA.
Schools (NCES district)
- District
- Wilkes County Schools
- NCES district ID
- 3704950
- Math proficiency
- 55% ▲ 13.00%
- Reading proficiency
- 50% ▲ 5.00%
- Median HH income
- $34,538
- Composite
- 43.41/100
- National rank
- #3017
- State rank
- #59 of 178 in NC
Livability — Mulberry
- Score
- 66/100
- State rank
- #284
- US rank
- #12144
Category grades
Schools grade is shown separately in the Schools card above.
Census & demographics
- Population (ZIP)
- 1,581
Population outlook (Wilkes County) Hauer SSP2
- Today (2025)
- 66,349 people
- By 2030
- 64,411 · -2.9%
- By 2040
- 59,800 · -9.9%
- By 2050
- 54,770 · -17.5%
- By 2075
- 45,211 · -31.9%
- By 2100
- 36,956 · -44.3%
Race, ethnicity, and origin ACS 2023
- Neighborhood character
- Predominantly White (100%)
- Race & ethnicity
- White 100%
Political lean MEDSL · Wilkes
- 2024 margin
- Solid R (+59.6) · D 19.9% · R 79.5%
- 2008→2024 swing
- -21.5pp toward R · 2008: -38.2pp · 2024: -59.6pp
- All cycles
- 2024: R+59.6 2020: R+56.6 2016: R+55.2 2012: R+42.7 2008: R+38.2
Not yet ingested
- Civics
- —
Market trends
- HPI YoY
- —
- Current HPI
- —
- Rent YoY
- —
- Metro
- —
- State GDP YoY
- ▲ 3.28%
- F500 in state
- 26
Industry mix (Fortune 500 HQ in NC)
| Industry | F500 HQs | Revenue |
|---|---|---|
| Financial Services | 2 | $213B |
|
||
| Retail | 2 | $95B |
|
||
| Industrial Conglomerate | 1 | $38B |
|
||
| Metals / Steel | 1 | $35B |
|
||
| Utilities | 1 | $30B |
|
||
| Industrial Machinery | 1 | $19B |
|
||
Price history
1 event — show timeline
- 2026-05-28 Listed $19,900 CANOPYMLS as Distributed by MLS Grid
Property tax history
+2.2%/yrLatest (2025): $307 · +48.8% YoY. Source: county tax records.
Cash-flow waterfall
monthlySold comps — $/sqft
last 12 mo · ≤1 miLoading sold comps…