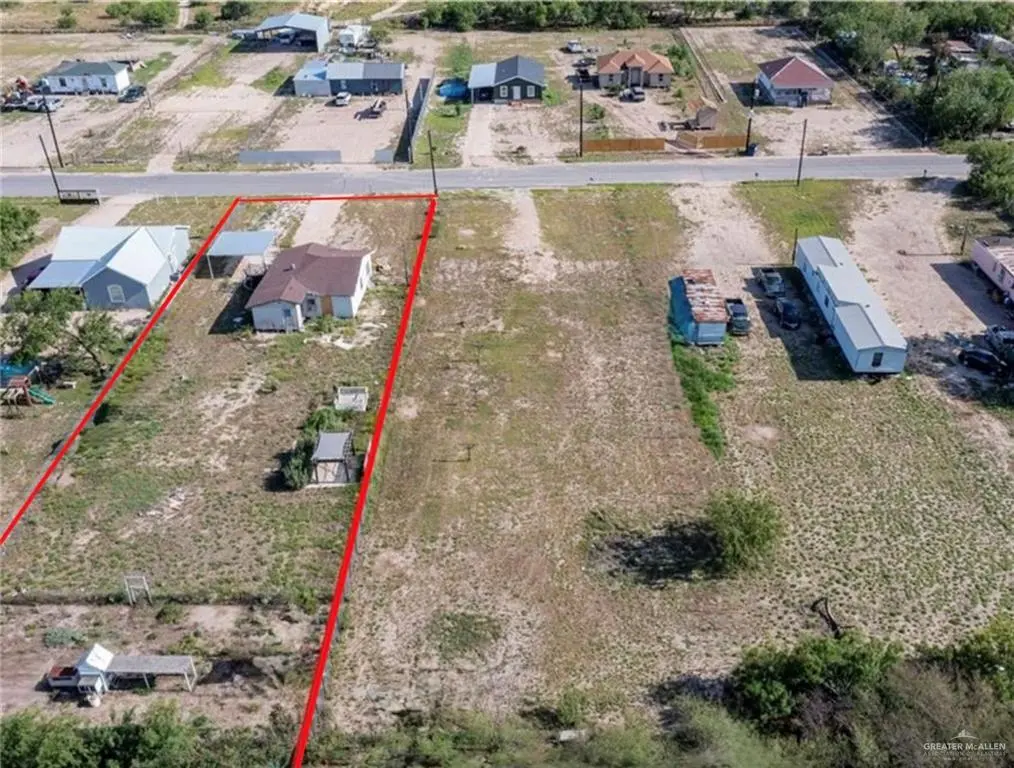
7026 Western Palm Dr · Citrus City, TX
Flood risk 1/10 · Minimal
- FEMA flood zone
- —
- Chance of flooding over 30 yrs
- 0.0%
- Est. flood insurance / yr
- —
Fire risk 8/10 · Major
- Est. fire insurance / yr
- $1,222 – $2,270
Heat risk 9/10 · Severe
- Hot days now (above 112°F)
- 7 days/yr
- Hot days in 30 yrs
- 22 days/yr
Wind risk 8/10 · Major
- Chance of severe wind over 30 yrs
- 96.0%
Air-quality risk 1/10 · Minimal
- Unhealthy air days now
- 0 days/yr
- Unhealthy air days in 30 yrs
- 0 days/yr
Risk factors via First Street. Map © Google.
Why this score? — see what drove the B grade
The composite is a weighted blend of 9 inputs, each scored 0–100. Each bar is that input's sub-score; the figure is the points it added to the 100-point composite (weight × sub-score).
- Cash flow +30.0/30.0
- ARV discount +15.0/15.0
- 1% rule +10.0/10.0
- DSCR +10.0/10.0
- Livability +2.8/5.0
- Rent growth +2.5/5.0
- Schools +1.9/10.0
- Condition / age +1.0/5.0
- Appreciation +0.0/10.0
$82,000
🖨 Deal sheet 📄 Offer letter ✓ Due diligence
Listing remarks
Calling all investors and visionaries! This 3-bedroom, 1-bathroom home sits on a generous half acre lot and offers incredible potential for customization. The home is currently unfinished, providing unique opportunity to complete the build-out to your style and needs. The property includes a detached 2-car carport and a charming gazebo, perfect for outdoor gatherings or relaxing evenings. with ample space and endless possibilities, this property is ready for your vision.
Key facts
- Charming gazebo
- Unfinished home
- Half acre lot
Tags
Property features AI
Finance
- HOA & community: No homeowners association
Exterior
- Parking: Detached carport with 2 covered spaces (2 total parking spaces)
- Utilities: Public water; Septic tank
- Home design: Single-story property; Living area source: HidalgoCAD
- Construction: Wood siding exterior; Pillar/post/pier foundation; Shingle roof; Building area 1,096 (source: listing)
- Exterior features: Chain link fence; Covered patio; Gazebo; Paved road access
Interior
- Kitchen: No conveying appliances
- Flooring: No flooring specified
- Bathrooms: 1 full bathroom
- Interior features: Laminate countertops; No window coverings; Laundry area
- Laundry & utility: Laundry area; Water heater not present
Neighborhood map
What this means for you Summary
Snapshot
- This is a 3-bed/1.0-bath single-family listed at $82k. Condition is rated poor.
Deal economics
- At list price, monthly cash flow is $778 ($9k/yr) — positive.
- The deal already cash-flows at list — no discount required.
- Meets the 1% rule at list price ($2k rent vs $82k).
- Recommended offer: $80k (3.0% below list) — sets the bar for market timing.
Location & tenants
- Location reads 55/100 on livability (#1,366 in TX) — a working-class tenant base; expect higher turnover. Strengths: cost of living A+, housing A, crime B; Watch: amenities F, commute F, employment F.
- La Joya ISD (suburban): math 18% / reading 29% proficiency, ranked #759 of 826 in TX (top 92%) — low school quality limits family demand, transient renter base, plan for 1-2y turnover.
- Zoned schools: Dr Maria Palmira Mendiola El (math 14% / reading 30%, grade F, #3,333 of 4,322 statewide, top 80%, 594 students, 98% FRL); Ann Richards Middle (math 21% / reading 30%, grade F, #1,236 of 1,662 statewide, top 76%, 729 students, 96% FRL); Juarez-Lincoln H S (math 10% / reading 20%, grade F, #1,507 of 1,632 statewide, top 93%, 2,062 students, 99% FRL) — zoned schools average 98% FRL vs 54% district-wide (44 pts higher); higher-poverty schools than district average — tighter screening recommended.
- Market conditions: 474 active listings in the ZIP; 7,378 units permitted in Hidalgo County in 2024 (641 in 5+ unit buildings).
- This rent runs 39% of the median local income ($52k/yr) — at the standard rent-burdened threshold; future hikes will face affordability resistance.
Forward outlook
- Local home prices are declining (-3.0%/yr); year-one equity from $567 of loan paydown is wiped out by about $2k of value loss. Plan a longer hold.
- Hidalgo County population projected at +28% by 2050 — long-run rental-demand tailwind backs the buy-and-hold thesis.
- At projected returns (-3.0% appreciation + 3.0% rent growth), your $23k cash investment doubles in ~3 years — after that, you're playing with house money.
Negotiation context
- It's been on market 55 days — a 3% lower offer ($80k) is reasonable based on typical stale-listing flexibility.
- 2 sale attempts with the ask held roughly flat each time — persistent listings suggest the price (not the market) is what's stuck; bring a comps-based counter.
Risks & watch-outs
- Climate carrying-cost: severe wind risk, 96% chance of damaging wind over 30y; severe wildfire risk; extreme-heat days projected 7→22/yr by 2055 (HVAC capex compounding) — expect insurance premiums to compound above CPI over the hold.
Questions for the listing agent
- It's been on market 55 days. Have you received any prior offers? Is the seller open to a 3% concession, seller financing, or rate buy-down credit?
- Have any recent inspections been done? Can we get a copy of the seller's disclosures and any deferred-maintenance estimates?
- Is there a deadline driving the sale (1031 exchange, divorce, estate, relocation)? That informs how much negotiation room exists.
- Schools are F-rated, which usually means shorter tenancies and higher turnover. Who's the typical renter profile here, and what's been the actual vacancy rate?
- What's the average days-on-market for RENTAL listings here right now (not sales)? A rising rental-DOM trend means longer vacancies and softer asking-rent achievability than the comps imply.
- What's the recent tenant-quality profile in this submarket — average credit score on applications, eviction rate, late-payment / NSF rate, and stable-employment percentage? A property-management company in the area should have these aggregated.
- How much new for-sale + rental construction is in the pipeline within 1–3 miles? Heavy new supply typically softens prices + rents 12–24 months out; constrained supply supports both.
Investment metrics
- 1% rule
- 2.08% ✓
- Cap rate
- 17.68%
- Cash-on-cash
- 40.67%
- DSCR
- 2.81
- GRM
- 4.0
CMA / ARV
- ARV (median comp)
- $131,248
- List price
- $82,000
- Delta
- -37.52%
- Verdict
- UNDERPRICED
- Comps
- 5 within 1.0 mi
Show comp detail 1 sale within ~0.75 mi
| Address | Dist | Beds/Ba | Sqft | Sold | Price | $/sf | Match |
|---|---|---|---|---|---|---|---|
| 7628 Durango St | 0.60mi | 3/3.0 | 1,240 (+13%) | 7mo | $214,999 | $173 | 36 |
Match score weights: distance 35% · size 25% · config 20% · recency 20%. Top-matched comps best support the ARV.
Projected returns pro-forma
-3.0% appreciation · 3.0% rent growth · sell at horizon
- IRR
- 37.1%
- Equity multiple
- 2.58×
- Total profit
- $36,293
- Equity at exit
- $12,226
- IRR
- 43.7%
- Equity multiple
- 5.16×
- Total profit
- $95,518
- Equity at exit
- $7,090
Cash invested: $22,960 (down + closing). Projections, not guarantees.
Landlord ↔ Tenant lean methodology
- Overall (STATE)
- 87 Strongly Landlord-Friendly
- State Texas
- 87 Strongly Landlord-Friendly · R+5
- County
- — inherits STATE
- City
- — inherits STATE
ZIP-level market 78574
- Home prices YoY
- -16.1%
- Active inventory
- 474
- Price-to-rent
- 4.0×
Monthly cashflow live
- Estimated rent
- $1,702 medium interval (Pro) →
- Mortgage (P&I)
- −$430
- Tax est. 1.5%
- −$102 /mo · $1,230/yr
- Insurance
- −$34
- HOA
- −$0
- Vacancy / Maint / Mgmt
- −$357
- Net cashflow
- $778
Break-even live
UW: 25.0% down · 7.5% · 30yr · 1.5% tax · 5.0% vac · 8.0% maint · 8.0% mgmt
Financing live
Cash to close
- Down payment
- $20,500
- Closing costs
- $2,460
- Reserves months
- —
- Total cash needed
- —
Loan-product check · same deal, 3 products live
Conventional
25% down · 7.5% · 30yr
- Down + closing
- —
- Monthly P&I
- —
- Monthly cashflow
- —
- DSCR
- —
- Eligible?
- —
Personal DTI + credit; lowest rate.
DSCR
20% down · 8.5% · 30yr
- Down + closing
- —
- Monthly P&I
- —
- Monthly cashflow
- —
- DSCR
- —
- Eligible?
- —
No personal income docs; deal must DSCR.
Hard money
10% down · 12.0% · 12mo
- Down + closing
- —
- Monthly P&I
- —
- Monthly cashflow
- —
- DSCR
- —
- Eligible?
- —
Short-term bridge; refi at stabilization.
Listing history 19 events
-
2026-06-18days on market $82,000 Active 55 DOM
-
2026-06-17days on market $82,000 Active 54 DOM
-
2026-06-16days on market $82,000 Active 53 DOM
-
2026-06-15days on market $82,000 Active 52 DOM
-
2026-06-14days on market $82,000 Active 50 DOM
-
2026-06-13days on market $82,000 Active 49 DOM
-
2026-06-10days on market $82,000 Active 47 DOM
-
2026-06-09days on market $82,000 Active 46 DOM
-
2026-06-08days on market $82,000 Active 45 DOM
-
2026-06-07days on market $82,000 Active 44 DOM
-
2026-06-05days on market $82,000 Active 41 DOM
-
2026-06-03days on market $82,000 Active 40 DOM
-
2026-06-02days on market $82,000 Active 39 DOM
-
2026-06-01days on market $82,000 Active 38 DOM
-
2026-05-31days on market $82,000 Active 37 DOM
-
2026-05-31days on market $82,000 Active 36 DOM
-
2026-04-24$82,000 Active 475-char remark
-
2026-03-03price $90,000
-
2026-02-21$105,000 Active
ⓘ Source: listings_history table (triggers on properties + properties_extension) + one-shot
backfill from property_details.listing_events for pre-trigger history.
Climate risk First Street
- Flood 1/10 Low 0% chance over 30 yrs
- Wildfire 8/10 Severe
- Heat 9/10 Extreme 7 d/yr ≥112°F today · 22 d/yr by 30 yrs out
- Wind 8/10 Severe 96% chance of damaging wind over 30 yrs
- Air quality 1/10 Low 0 unhealthy d/yr today · 0 by 30 yrs out
Nearby sold comps map
Loading sold comps map…
Walkable amenities ~0.75 mi
Loading nearby amenities…
Taxation est. · year 1
- Rental income
- $20,427
- − Mortgage interest
- −$4,593
- − Property taxes
- −$1,230
- − Insurance
- −$410
- − Repairs & maintenance
- −$1,634
- − Management
- −$1,634
- − Depreciation
- −$2,385
- Taxable income
- $8,540
- Est. tax owed @ 24.0%
- −$2,049
- After-tax cash flow
- $7,287/yr
For passive investors: Depreciation is non-cash, so a rental often shows a tax loss while cash-flowing — sheltering income. Rental losses are passive: they offset passive income freely, and up to $25,000/yr can offset ordinary (W-2) income if you actively participate and your MAGI is under $100k (phasing out to $0 by $150k); unused losses carry forward. On sale, claimed depreciation is recaptured at up to 25%, and gains may owe capital-gains tax (a 1031 exchange can defer both). Figures are a year-1 estimate at your 24.0% rate — not tax advice; consult a CPA.
Condition & rehab AI · 2 photos
This property requires extensive renovation and build-out to become move-in ready. Significant improvements in the kitchen, bathrooms, exterior, and landscaping will significantly increase its value.
Repairs flagged
- Major Foundation/structure — No visible foundation/structure
- Major HVAC/mechanicals — No visible HVAC/mechanicals
- Major Exterior/siding — No visible exterior/siding
- Major Windows — No visible windows
- Major Flooring — No visible flooring
- Major Interior walls/paint — No visible interior walls/paint
- Major Kitchen — No visible kitchen
- Major Bath — No visible bathroom
Value-add opportunities
- Both Complete build-out and renovation — This will make the property move-in ready and increase both resale and rental value
- Both Landscaping and curb appeal improvements — Enhances the property's visual appeal and can increase both resale and rental value
Renovation cost estimate screening
| Repair item | Severity | Est. cost |
|---|---|---|
| Foundation/structure · No visible foundation/structure | Major | $15,000–50,000 |
| HVAC/mechanicals · No visible HVAC/mechanicals | Major | $15,000–50,000 |
| Exterior/siding · No visible exterior/siding | Major | $15,000–50,000 |
| Windows · No visible windows | Major | $15,000–50,000 |
| Flooring · No visible flooring | Major | $15,000–50,000 |
| Interior walls/paint · No visible interior walls/paint | Major | $15,000–50,000 |
| Kitchen · No visible kitchen | Major | $15,000–50,000 |
| Bath · No visible bathroom | Major | $15,000–50,000 |
| Total estimated repair cost · 8 items | $120,000–400,000 |
Value-add ROI direction
- Both Complete build-out and renovation — This will make the property move-in ready and increase both resale and rental value ↑
- Both Landscaping and curb appeal improvements — Enhances the property's visual appeal and can increase both resale and rental value ↑
ⓘ Cost ranges are severity-bucket heuristics (US national rule-of-thumb). Get contractor quotes + a written scope before underwriting a rehab budget.
Schools (NCES district)
- District
- La Joya ISD
- NCES district ID
- 4826130
- Math proficiency
- 18% ▼ -35.00%
- Reading proficiency
- 29% ▼ -10.00%
- Median HH income
- $27,845
- Composite
- 18.65/100
- National rank
- #8891
- State rank
- #759 of 826 in TX
Livability — Citrus City
- Score
- 55/100
- State rank
- #1366
- US rank
- #23499
Category grades
Schools grade is shown separately in the Schools card above.
Census & demographics
- Census place
- Citrus City, TX
- County
- Hidalgo County · 623,128 people
- Metro
- McAllen-Edinburg-Mission, TX
- Population (ZIP)
- 62,456
- Household income
- $52,393
- Rent vs Own
- Severe rent burden
- 803.0
Population outlook (Hidalgo County) Hauer SSP2
- Today (2025)
- 955,232 people
- By 2030
- 1,009,774 · +5.7%
- By 2040
- 1,120,332 · +17.3%
- By 2050
- 1,225,036 · +28.2%
- By 2075
- 1,439,189 · +50.7%
- By 2100
- 1,533,429 · +60.5%
Race, ethnicity, and origin ACS 2023
- Neighborhood character
- Predominantly Hispanic (97%)
- Race & ethnicity
- Hispanic / Latino 97% Two or more races 62% White 2%
- Hispanic origin (detail)
- Mexican 93%
- Foreign-born
- 33% · Canada
- Languages at home
- 12% English-only · Spanish 87%
Political lean MEDSL · Hidalgo
- 2024 margin
- Toss-up / Even · D 48.1% · R 51.0%
- 2008→2024 swing
- -41.6pp toward R · 2008: 38.7pp · 2024: -2.9pp
- All cycles
- 2024: R+2.9 2020: D+17.1 2016: D+40.5 2012: D+41.8 2008: D+38.7
Not yet ingested
- Civics
- —
Market trends
- HPI YoY
- ▼ -44.13%
- Current HPI
- 230.3323
- Rent YoY
- —
- Metro
- McAllen-Edinburg-Mission, TX
- State GDP YoY
- ▲ 3.95%
- F500 in state
- 110
Industry mix (Fortune 500 HQ in TX)
| Industry | F500 HQs | Revenue |
|---|---|---|
| Energy | 16 | $1,198B |
|
||
| Technology | 5 | $198B |
|
||
| Engineering / Construction | 4 | $72B |
|
||
| Energy Services | 3 | $60B |
|
||
| Utilities | 3 | $41B |
|
||
| Healthcare | 2 | $330B |
|
||
Price history
-21.9% since first listed3 events — show timeline
- 2026-04-24 Listed $82,000 MCALLENMLS
- 2026-03-03 Price Changed $90,000 MCALLENMLS
- 2026-02-21 Listed $105,000 MCALLENMLS
Cash-flow waterfall
monthlySold comps — $/sqft
last 12 mo · ≤1 miLoading sold comps…