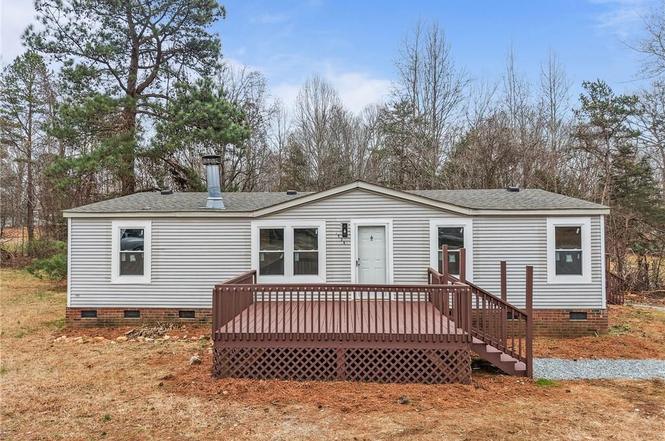
7934 Wood Hollow Trl · Liberty, NC
Flood risk 1/10 · Minimal
- FEMA flood zone
- X (unshaded)
- Chance of flooding over 30 yrs
- 0.0%
- Est. flood insurance / yr
- $507 – $1,088
Fire risk 4/10 · Minor
- Est. fire insurance / yr
- $906 – $1,684
Heat risk 5/10 · Moderate
- Hot days now (above 103°F)
- 7 days/yr
- Hot days in 30 yrs
- 17 days/yr
Wind risk 5/10 · Moderate
- Chance of severe wind over 30 yrs
- 22.0%
Air-quality risk 2/10 · Minimal
- Unhealthy air days now
- 2 days/yr
- Unhealthy air days in 30 yrs
- 2 days/yr
Risk factors via First Street. Map © Google.
Why this score? — see what drove the C- grade
The composite is a weighted blend of 9 inputs, each scored 0–100. Each bar is that input's sub-score; the figure is the points it added to the 100-point composite (weight × sub-score).
- Cash flow +20.2/30.0
- ARV discount +7.5/15.0
- DSCR +6.4/10.0
- 1% rule +4.3/10.0
- Livability +3.7/5.0
- Schools +3.0/10.0
- Rent growth +2.5/5.0
- Condition / age +2.5/5.0
- Appreciation +0.0/10.0
$192,500
🖨 Deal sheet 📄 Offer letter ✓ Due diligence
Listing remarks MLS
Reduced!!! Priced Nearly $20,000 Below Tax Value! Property Sold As-Is, All Info, Systems And Utilities To Be Verified By Buyer. All Info Based On Public Record And/Or Prior Mls And Unverified. Agents, Review Agent Remarks. Age, Sq Ftg Estimated.
Key facts
- Split floor plan
- Primary suite
- Standalone shower
Tags
Property features AI
Finance
- Other: Located in the Wood Hollow subdivision; Directions available to the property
- Financial info: $909 annual tax amount
- HOA & community: Association (Wood Hollow / Greensboro) with an annual fee of $150
Exterior
- Parking: Driveway parking; no garage
- Utilities: Well water; Septic tank; Electric water heater; Electric-powered systems
- Home design: Manufactured double-wide home; One story; Built in 2002; Existing structure
- Construction: Vinyl siding; Crawl space foundation; One fireplace located in the living room
- Exterior features: No fencing; Subdivision lot; Private maintained road
Interior
- Kitchen: Dishwasher; Free-standing range; Range hood
- Bedrooms: Multiple bedrooms on the main level (rooms with main-level dimensions listed)
- Flooring: Laminate flooring
- Bathrooms: Two full bathrooms
- Heating & cooling: Central air conditioning; Electric forced-air heating
- Interior features: Primary bedroom located on the main level; Solid surface countertops
- Laundry & utility: Washer hookup; Dryer connection on main level; Electric water heater
Neighborhood map
What this means for you Summary
Snapshot
- This is a 3-bed/2.0-bath manufactured listed at $192k.
Deal economics
- At list price, monthly cash flow is $241 ($3k/yr) — positive.
- The deal already cash-flows at list — no discount required.
- To meet the 1% rule (rent ≥ 1% of price), the offer needs to be $180k (6.6% below list).
- Recommended offer: $169k (12.0% below list) — sets the bar for market timing.
- Cap rate 7.8% vs local median 4.3% in Liberty — top-decile yield for the area; either an underpriced asset or a hidden risk that comps aren't pricing in. Stress-test before assuming the spread holds.
Location & tenants
- Location reads 74/100 on livability (#56 in NC, #4,472 nationally) — a middle-class / working-renter tenant base. Strengths: cost of living A+, housing A+, health & safety A+; Watch: amenities F, commute F, employment F.
- Alamance-Burlington Schools (rural): math 30% / reading 40% proficiency, ranked #133 of 178 in NC (top 75%) — families likely to look elsewhere, expect single-tenant / working-renter base with shorter leases.
- Zoned schools: Sylvan Elementary (math 32% / reading 42%, grade F, #771 of 1,410 statewide, top 57%, 291 students, 63% FRL); Southern Alamance Middle (math 34% / reading 44%, grade F, #238 of 475 statewide, top 51%, 685 students, 49% FRL); Southern Alamance High (math 69% / reading 54%, grade B-, #199 of 535 statewide, top 37%, 1,360 students, 43% FRL) — zoned schools at 52% FRL track the district average.
- Market conditions: 79 active listings in the ZIP; 2,466 units permitted in Alamance County in 2024 (403 in 5+ unit buildings).
Forward outlook
- Local home prices are declining (-3.0%/yr); year-one equity from $1k of loan paydown is wiped out by about $6k of value loss. Plan a longer hold.
- Alamance County population projected at +19% by 2050 — long-run rental-demand tailwind backs the buy-and-hold thesis.
Negotiation context
- It's been on market 142 days — a 12% lower offer ($169k) is reasonable based on typical stale-listing flexibility.
- 5 sale attempts since 18y ago with the ask held roughly flat each time — persistent listings suggest the price (not the market) is what's stuck; bring a comps-based counter.
- Current owner paid $68k; list at $192k implies a 183% gain — meaningful room to come down on a strong offer.
Risks & watch-outs
- Climate carrying-cost: moderate wind risk, 22% chance of damaging wind over 30y; extreme-heat days projected 7→17/yr by 2055 (HVAC capex compounding) — expect insurance premiums to compound above CPI over the hold.
Questions for the listing agent
- It's been on market 142 days. Have you received any prior offers? Is the seller open to a 12% concession, seller financing, or rate buy-down credit?
- What does the HOA fee cover, when was the last increase, and are there any pending special assessments or reserve-fund shortfalls?
- Why hasn't it sold? Are there any deal-killer items the seller is aware of (foundation, flood, title, zoning, code violations)?
- Is there a deadline driving the sale (1031 exchange, divorce, estate, relocation)? That informs how much negotiation room exists.
- Schools are F-rated, which usually means shorter tenancies and higher turnover. Who's the typical renter profile here, and what's been the actual vacancy rate?
- What's the average days-on-market for RENTAL listings here right now (not sales)? A rising rental-DOM trend means longer vacancies and softer asking-rent achievability than the comps imply.
- What's the recent tenant-quality profile in this submarket — average credit score on applications, eviction rate, late-payment / NSF rate, and stable-employment percentage? A property-management company in the area should have these aggregated.
- How much new for-sale + rental construction is in the pipeline within 1–3 miles? Heavy new supply typically softens prices + rents 12–24 months out; constrained supply supports both.
Investment metrics
- 1% rule
- 0.93% ✗
- Cap rate
- 7.80%
- Cash-on-cash
- 5.38%
- DSCR
- 1.24
- GRM
- 8.9
CMA / ARV
No comps found within radius.
Projected returns pro-forma
-3.0% appreciation · 3.0% rent growth · sell at horizon
- IRR
- -8.0%
- Equity multiple
- 0.71×
- Total profit
- $-15,879
- Equity at exit
- $28,702
- IRR
- 1.5%
- Equity multiple
- 1.11×
- Total profit
- $5,709
- Equity at exit
- $16,644
Cash invested: $53,900 (down + closing). Projections, not guarantees.
Landlord ↔ Tenant lean methodology
- Overall (STATE)
- 85 Strongly Landlord-Friendly
- State North Carolina
- 85 Strongly Landlord-Friendly · R+3
- County
- — inherits STATE
- City
- — inherits STATE
ZIP-level market 27298
- Home prices YoY
- -12.8%
- Active inventory
- 79
- Price-to-rent
- 8.9×
Monthly cashflow live
- Estimated rent
- $1,797 medium interval (Pro) →
- Mortgage (P&I)
- −$1,009
- Tax from tax record
- −$76 /mo · $909/yr
- Insurance
- −$80
- HOA
- −$13
- Vacancy / Maint / Mgmt
- −$377
- Net cashflow
- $241
Break-even live
UW: 25.0% down · 7.5% · 30yr · 1.5% tax · 5.0% vac · 8.0% maint · 8.0% mgmt
Financing live
Cash to close
- Down payment
- $48,125
- Closing costs
- $5,775
- Reserves months
- —
- Total cash needed
- —
Loan-product check · same deal, 3 products live
Conventional
25% down · 7.5% · 30yr
- Down + closing
- —
- Monthly P&I
- —
- Monthly cashflow
- —
- DSCR
- —
- Eligible?
- —
Personal DTI + credit; lowest rate.
DSCR
20% down · 8.5% · 30yr
- Down + closing
- —
- Monthly P&I
- —
- Monthly cashflow
- —
- DSCR
- —
- Eligible?
- —
No personal income docs; deal must DSCR.
Hard money
10% down · 12.0% · 12mo
- Down + closing
- —
- Monthly P&I
- —
- Monthly cashflow
- —
- DSCR
- —
- Eligible?
- —
Short-term bridge; refi at stabilization.
HOA detail
- Monthly dues
- $13 · $156/yr
Listing history 24 events
-
2026-06-07statusdays on market $192,500 Pending 142 DOM
-
2026-06-05days on market $192,500 Due Diligence Period 141 DOM
-
2026-06-02days on market $192,500 Due Diligence Period 139 DOM
-
2026-06-01days on market $192,500 Due Diligence Period 138 DOM
-
2026-05-31days on market $192,500 Due Diligence Period 137 DOM
-
2026-05-30days on market $192,500 Due Diligence Period 136 DOM
-
2026-05-15historical Due Diligence Period
-
2026-05-14price $192,500
-
2026-04-30status Active
-
2026-04-21historical Due Diligence Period
-
2026-04-02price $195,000
-
2026-03-19price $197,900
-
2026-02-12price $198,900
-
2026-01-14$200,000 Active
-
2025-07-29soldstatus $68,000
-
2016-10-21soldstatus $70,000
-
2014-05-15soldstatus $35,000
-
2012-06-25historical
-
2012-03-23$57,500
-
2008-11-11soldstatus $29,900 245-char remark
Show marketing remark (245 chars)
Reduced!!! Priced Nearly $20,000 Below Tax Value! Property Sold As-Is, All Info, Systems And Utilities To Be Verified By Buyer. All Info Based On Public Record And/Or Prior Mls And Unverified. Agents, Review Agent Remarks. Age, Sq Ftg Estimated.
-
2008-07-24$44,900 245-char remark
Show marketing remark (245 chars)
Reduced!!! Priced Nearly $20,000 Below Tax Value! Property Sold As-Is, All Info, Systems And Utilities To Be Verified By Buyer. All Info Based On Public Record And/Or Prior Mls And Unverified. Agents, Review Agent Remarks. Age, Sq Ftg Estimated.
-
2001-10-22soldstatus $15,000
ⓘ Source: listings_history table (triggers on properties + properties_extension) + one-shot
backfill from property_details.listing_events for pre-trigger history.
Tax reassessment forecast NC · Resets to sale price
- Current annual tax
- $909 · $76/mo
- Projected year-2 tax
- $1,579 · $132/mo
- Expected delta
- +$670/yr (+$56/mo · 73.7%)
ⓘ Screening estimate from a state-policy table — verify with the county assessor before closing.
Climate risk First Street
- Flood 1/10 Low FEMA zone X (unshaded) · 0% chance over 30 yrs
- Wildfire 4/10 Moderate
- Heat 5/10 Major 7 d/yr ≥103°F today · 17 d/yr by 30 yrs out
- Wind 5/10 Major 22% chance of damaging wind over 30 yrs
- Air quality 2/10 Low 2 unhealthy d/yr today · 2 by 30 yrs out
Nearby sold comps map
Loading sold comps map…
Walkable amenities ~0.75 mi
Loading nearby amenities…
Taxation est. · year 1
- Rental income
- $21,568
- − Mortgage interest
- −$10,783
- − Property taxes
- −$909
- − Insurance
- −$962
- − Repairs & maintenance
- −$1,725
- − Management
- −$1,725
- − HOA
- −$156
- − Depreciation
- −$5,600
- Taxable loss
- −$293
- Est. tax savings @ 24.0%
- +$70
- After-tax cash flow
- $2,968/yr
For passive investors: Depreciation is non-cash, so a rental often shows a tax loss while cash-flowing — sheltering income. Rental losses are passive: they offset passive income freely, and up to $25,000/yr can offset ordinary (W-2) income if you actively participate and your MAGI is under $100k (phasing out to $0 by $150k); unused losses carry forward. On sale, claimed depreciation is recaptured at up to 25%, and gains may owe capital-gains tax (a 1031 exchange can defer both). Figures are a year-1 estimate at your 24.0% rate — not tax advice; consult a CPA.
Schools (NCES district)
- District
- Alamance-Burlington Schools
- NCES district ID
- 3700030
- Math proficiency
- 30% ▼ -6.00%
- Reading proficiency
- 40% ▲ 2.00%
- Median HH income
- $43,359
- Composite
- 29.68/100
- National rank
- #6460
- State rank
- #133 of 178 in NC
Livability — Liberty
- Score
- 74/100
- State rank
- #56
- US rank
- #4472
Category grades
Schools grade is shown separately in the Schools card above.
Census & demographics
- Population (ZIP)
- 10,507
Population outlook (Alamance County) Hauer SSP2
- Today (2025)
- 173,381 people
- By 2030
- 180,609 · +4.2%
- By 2040
- 194,327 · +12.1%
- By 2050
- 206,158 · +18.9%
- By 2075
- 235,665 · +35.9%
- By 2100
- 258,626 · +49.2%
Race, ethnicity, and origin ACS 2023
- Neighborhood character
- Predominantly White (76%)
- Race & ethnicity
- White 76% Hispanic / Latino 15% Two or more races 10% Black 7%
- Hispanic origin (detail)
- Mexican 12%
- Common ancestry
- Slovak 4% Lithuanian 2% Serbian 1%
- Foreign-born
- 7% · Canada
- Languages at home
- 90% English-only · Spanish 9% French/Haitian/Cajun 1%
Political lean MEDSL · Alamance
- 2024 margin
- Lean R (+8.2) · D 45.4% · R 53.5% · Other 1.1%
- 2008→2024 swing
- +1.1pp toward D · 2008: -9.2pp · 2024: -8.2pp
- All cycles
- 2024: R+8.2 2020: R+8.4 2016: R+12.9 2012: R+14.1 2008: R+9.2
Not yet ingested
- Civics
- —
Market trends
- HPI YoY
- ▼ -37.90%
- Current HPI
- 257.7834
- Rent YoY
- —
- Metro
- —
- State GDP YoY
- ▲ 3.28%
- F500 in state
- 26
Industry mix (Fortune 500 HQ in NC)
| Industry | F500 HQs | Revenue |
|---|---|---|
| Financial Services | 2 | $213B |
|
||
| Retail | 2 | $95B |
|
||
| Industrial Conglomerate | 1 | $38B |
|
||
| Metals / Steel | 1 | $35B |
|
||
| Utilities | 1 | $30B |
|
||
| Industrial Machinery | 1 | $19B |
|
||
Price history
+1183.3% since first listed18 events — show timeline
- 2026-05-15 Contingent — Triad MLS
- 2026-05-14 Price Changed $192,500 Triad MLS
- 2026-04-30 Relisted — Triad MLS
- 2026-04-21 Contingent — Triad MLS
- 2026-04-02 Price Changed $195,000 Triad MLS
- 2026-03-19 Price Changed $197,900 Triad MLS
- 2026-02-12 Price Changed $198,900 Triad MLS
- 2026-01-14 Listed $200,000 Triad MLS
- 2025-07-29 Sold (Public Records) $68,000 Public Records
- 2016-10-21 Sold (Public Records) $70,000 Public Records
- 2014-05-15 Sold (Public Records) $35,000 Public Records
- 2012-06-25 Listing Removed — TMLS
- 2012-03-23 Listed $57,500 TMLS
- 2008-11-11 Sold (MLS) $29,900 TMLS
- 2008-11-11 Sold (MLS) $29,900 AMLSNC
- 2008-07-24 Listed $44,900 TMLS
- 2008-07-24 Listed $44,900 AMLSNC
- 2001-10-22 Sold (Public Records) $15,000 Public Records
Property tax history
+5.9%/yrLatest (2025): $909 · +6.8% YoY. Source: county tax records.
Cash-flow waterfall
monthlySold comps — $/sqft
last 12 mo · ≤1 miLoading sold comps…