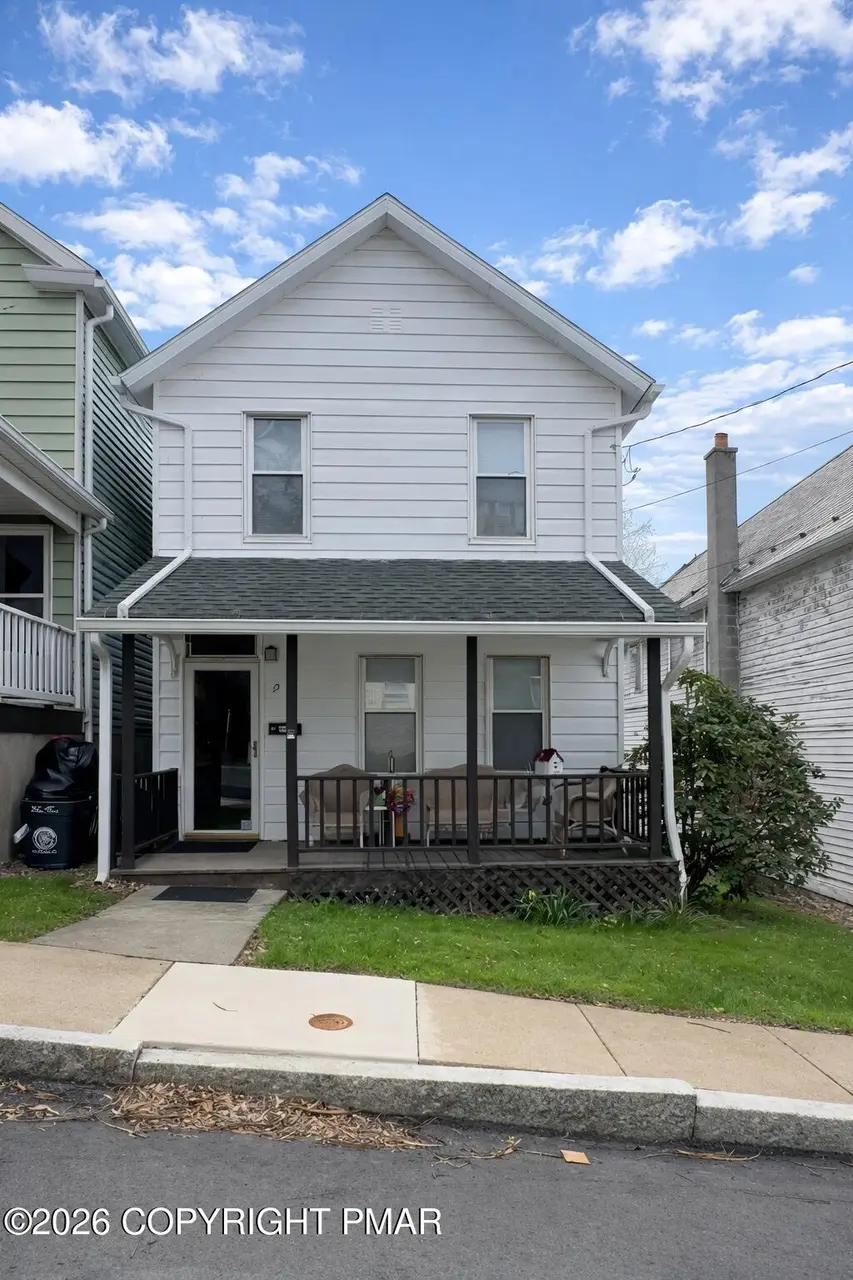
13 Priestly St · Wilkes-Barre, PA
Flood risk 1/10 · Minimal
- FEMA flood zone
- X (unshaded)
- Chance of flooding over 30 yrs
- 0.0%
- Est. flood insurance / yr
- $507 – $1,088
Fire risk 2/10 · Minimal
- Est. fire insurance / yr
- $511 – $949
Heat risk 4/10 · Minor
- Hot days now (above 95°F)
- 7 days/yr
- Hot days in 30 yrs
- 16 days/yr
Wind risk 3/10 · Minor
- Chance of severe wind over 30 yrs
- 5.0%
Air-quality risk 3/10 · Minor
- Unhealthy air days now
- 2 days/yr
- Unhealthy air days in 30 yrs
- 4 days/yr
Risk factors via First Street. Map © Google.
Why this score? — see what drove the C+ grade
The composite is a weighted blend of 9 inputs, each scored 0–100. Each bar is that input's sub-score; the figure is the points it added to the 100-point composite (weight × sub-score).
- Cash flow +25.0/30.0
- ARV discount +12.8/15.0
- DSCR +8.2/10.0
- 1% rule +6.5/10.0
- Rent growth +4.2/5.0
- Livability +2.5/5.0
- Condition / age +2.5/5.0
- Schools +2.1/10.0
- Appreciation +0.0/10.0
$129,000
🖨 Deal sheet 📄 Offer letter ✓ Due diligence
Listing remarks
Welcome to 13 Priestley Street in Wilkes-Barre. This three-bedroom, one-bath home is located on a quiet dead-end street with minimal traffic. The home offers a functional layout with comfortable living space and nicely sized bedrooms. There is a backyard for outdoor use, whether for relaxing or entertaining. Please note, the photos were taken when the home was vacant. The property is currently owner-occupied. A great opportunity for a buyer or investor looking for a solid property in a convenient location.
Key facts
- Convenient location
- 2,178 sq ft lot
- Built 1900
Tags
Property features AI
Exterior
- Utilities: Public sewer
- Home design: Single family house; One-story (above grade finished area listed)
- Construction: 1 common wall
- Exterior features: Residential zoning; Subdivision: None
Interior
- Bathrooms: 1 full bathroom
- Heating & cooling: Forced air heating; Natural gas heating
- Interior features: Unfurnished; 6 total rooms
Neighborhood map
What this means for you Summary
Snapshot
- This is a 3-bed/1.0-bath single-family listed at $129k.
Deal economics
- At list price, monthly cash flow is $282 ($3k/yr) — positive.
- The deal already cash-flows at list — no discount required.
- Meets the 1% rule at list price ($1k rent vs $129k).
- Cap rate 8.9% vs local median 5.7% in Wilkes-Barre — top-decile yield for the area; either an underpriced asset or a hidden risk that comps aren't pricing in. Stress-test before assuming the spread holds.
Location & tenants
- Location reads: area grade C — affects rentability + tenant quality, not the cash-flow math above.
- Wilkes-Barre Area SD (urban): math 19% / reading 32% proficiency, ranked #469 of 539 in PA (top 87%) — low school quality limits family demand, transient renter base, plan for 1-2y turnover; 61% free/reduced lunch — lower-income household profile, screen leases tightly.
- Market conditions: Rents rising fast (+6.8%/yr); 221 active listings in the ZIP; 40 comparable units currently listed for rent nearby; rentals at typical pace (median 21d on market — plan ~3-4 weeks tenant-placement turnaround); 42% of comp listings sitting > 30 days — soft ceiling on asking rent; 349 units permitted in Luzerne County in 2024 (16 in 5+ unit buildings).
- This rent runs 32% of the median local income ($56k/yr) — at the standard rent-burdened threshold; future hikes will face affordability resistance.
Forward outlook
- Local home prices are declining (-3.0%/yr); year-one equity from $892 of loan paydown is wiped out by about $4k of value loss. Plan a longer hold.
- Luzerne County population projected at +4% by 2050 — modest demand growth; plan on rents tracking national, not racing it.
- At projected returns (-3.0% appreciation + 6.8% rent growth), your $36k cash investment doubles in ~8 years — after that, you're playing with house money.
Negotiation context
- Only 12 days on market — expect competitive offers; lowballing is unlikely to land.
- 2 sale attempts since 6y ago with the ask held roughly flat each time — persistent listings suggest the price (not the market) is what's stuck; bring a comps-based counter.
- Current owner paid $72k; list at $129k implies a 78% gain — meaningful room to come down on a strong offer.
Risks & watch-outs
- Watch-outs: built in 1900 — expect roof / HVAC / electrical / plumbing capex.
Questions for the listing agent
- Built in 1900 — when were the roof, HVAC, electrical panel, plumbing, and water heater last replaced?
- Is there a deadline driving the sale (1031 exchange, divorce, estate, relocation)? That informs how much negotiation room exists.
- What's the average days-on-market for RENTAL listings here right now (not sales)? A rising rental-DOM trend means longer vacancies and softer asking-rent achievability than the comps imply.
- What's the recent tenant-quality profile in this submarket — average credit score on applications, eviction rate, late-payment / NSF rate, and stable-employment percentage? A property-management company in the area should have these aggregated.
- How much new for-sale + rental construction is in the pipeline within 1–3 miles? Heavy new supply typically softens prices + rents 12–24 months out; constrained supply supports both.
Investment metrics
- 1% rule
- 1.15% ✓
- Cap rate
- 8.91%
- Cash-on-cash
- 9.36%
- DSCR
- 1.42
- GRM
- 7.2
CMA / ARV
- ARV (on-the-fly)
- $146,262
- Comps found
- 12
Show comp detail 12 sales within ~0.75 mi
| Address | Dist | Beds/Ba | Sqft | Sold | Price | $/sf | Match |
|---|---|---|---|---|---|---|---|
| 124 Wyoming St | 0.38mi | 3/1.0 | 1,274 (-1%) | 0mo | $130,000 | $102 | 81 |
| 116 Darling St | 0.12mi | 3/1.0 | 1,428 (+11%) | 1mo | $170,000 | $119 | 75 |
| 334 Main St | 0.26mi | 3/1.5 | 1,224 (-5%) | 8mo | $120,000 | $98 | 72 |
| 59 Bowman St | 0.60mi | 3/1.0 | 1,300 (+1%) | 3mo | $176,000 | $135 | 68 |
| 34 Kidder St | 0.62mi | 3/1.0 | 1,235 (-4%) | 2mo | $140,000 | $113 | 63 |
| 16 Ralph St | 0.67mi | 3/1.5 | 1,280 (-0%) | 5mo | $137,000 | $107 | 62 |
| 121 Gates Ave | 0.69mi | 3/1.5 | 1,300 (+1%) | 2mo | $185,000 | $142 | 62 |
| 97 Kidder St | 0.69mi | 3/1.0 | 1,214 (-5%) | 8mo | $135,000 | $111 | 52 |
| 43 Kidder St | 0.65mi | 3/1.5 | 1,400 (+9%) | 2mo | $160,000 | $114 | 51 |
| 400 Madison St | 0.65mi | 3/1.0 | 1,155 (-10%) | 8mo | $135,204 | $117 | 47 |
| 35 John St | 0.61mi | 3/2.0 | 1,161 (-10%) | 8mo | $184,000 | $158 | 45 |
| 27 Harry St | 0.70mi | 3/1.0 | 1,460 (+14%) | 6mo | $138,500 | $95 | 39 |
Match score weights: distance 35% · size 25% · config 20% · recency 20%. Top-matched comps best support the ARV.
Projected returns pro-forma
-3.0% appreciation · 6.84% rent growth · sell at horizon
- IRR
- 2.1%
- Equity multiple
- 1.08×
- Total profit
- $3,017
- Equity at exit
- $19,234
- IRR
- 15.1%
- Equity multiple
- 2.45×
- Total profit
- $52,285
- Equity at exit
- $11,154
Cash invested: $36,120 (down + closing). Projections, not guarantees.
Landlord ↔ Tenant lean methodology
- Overall (STATE)
- 62 Landlord-Friendly
- State Pennsylvania
- 62 Landlord-Friendly · EVEN
- County
- — inherits STATE
- City
- — inherits STATE
ZIP-level market 18702
- Rents YoY
- 6.8%
- Active inventory
- 221
- Price-to-rent
- 7.2×
Monthly cashflow live
- Estimated rent
- $1,485 high interval (Pro) →
- Mortgage (P&I)
- −$676
- Tax est. 1.5%
- −$161 /mo · $1,935/yr
- Insurance
- −$54
- HOA
- −$0
- Vacancy / Maint / Mgmt
- −$312
- Net cashflow
- $282
Break-even live
UW: 25.0% down · 7.5% · 30yr · 1.5% tax · 5.0% vac · 8.0% maint · 8.0% mgmt
Financing live
Cash to close
- Down payment
- $32,250
- Closing costs
- $3,870
- Reserves months
- —
- Total cash needed
- —
Loan-product check · same deal, 3 products live
Conventional
25% down · 7.5% · 30yr
- Down + closing
- —
- Monthly P&I
- —
- Monthly cashflow
- —
- DSCR
- —
- Eligible?
- —
Personal DTI + credit; lowest rate.
DSCR
20% down · 8.5% · 30yr
- Down + closing
- —
- Monthly P&I
- —
- Monthly cashflow
- —
- DSCR
- —
- Eligible?
- —
No personal income docs; deal must DSCR.
Hard money
10% down · 12.0% · 12mo
- Down + closing
- —
- Monthly P&I
- —
- Monthly cashflow
- —
- DSCR
- —
- Eligible?
- —
Short-term bridge; refi at stabilization.
Rent comps 40 comps
| Address | Beds | Baths | Sqft | Rent | $/sqft | DOM | Units | Dist |
|---|---|---|---|---|---|---|---|---|
| 301 N Main St Unit 2 Wilkes-Barre, PA | 3.0 | 1.0 | 1050 | $1,300 | $1.24 | 21d | 1 | 0.24mi |
| 261 N Washington St Wilkes Barre, PA | 3.0 | 1.0 | 1050 | $1,400 | $1.33 | 43d | 1 | 0.33mi |
| 98 N Franklin St Unit 2 Wilkes-Barre, PA | 2.0 | 2.0 | 1254 | $1,650 | $1.32 | 13d | 1 | 0.37mi |
| 100 Parkway Blvd Kingston, PA | 2.0 | 1.0 | 650 | $1,400 | $2.15 | 13d | 1 | 0.37mi |
| 37 Wyoming St Wilkes Barre, PA | 4.0 | 1.0 | 1300 | $2,200 | $1.69 | 21d | 1 | 0.38mi |
| 535 N Franklin St Wilkes Barre, PA | 3.0 | 1.0 | 1148 | $1,359 | $1.18 | 21d | 1 | 0.49mi |
| 19 N River St Unit 308 Wilkes-Barre, PA | 2.0 | 1.5 | 910 | $1,600 | $1.76 | 13d | 1 | 0.50mi |
| 115 1st Ave Unit 115 Kingston, PA | 3.0 | 1.0 | 1200 | $1,495 | $1.25 | 13d | 1 | 0.52mi |
| 572 N Franklin St Wilkes Barre, PA | 2.0 | 1.0 | 1042 | $1,050 | $1.01 | 21d | 1 | 0.54mi |
| 572 N Franklin St Wilkes Barre, PA | 2.0 | 1.0 | 1042 | $1,100 | $1.06 | 43d | 1 | 0.54mi |
| 40 N Dawes Ave Kingston, PA | 3.0 | 1.5 | 1450 | $1,800 | $1.24 | 21d | 1 | 0.54mi |
| 38 W Market St Unit 3 Wilkes-Barre, PA | 2.0 | 1.0 | 1388 | $1,295 | $0.93 | 13d | 1 | 0.55mi |
| 73 2nd Ave Kingston, PA | 2.0 | 1.0 | 1200 | $950 | $0.79 | 21d | 1 | 0.61mi |
| 67-69 Public Sq Wilkes-Barre, PA | 2.0 | 1.0 | 910 | $1,875 | $2.06 | 43d | 1 | 0.61mi |
| 67-69 Public Sq #1203 Wilkes Barre, PA | 2.0 | 1.0 | 875 | $1,825 | $2.09 | 43d | 1 | 0.62mi |
| 131 Scott St Wilkes-Barre Township, PA | 2.0 | 1.0 | 1144 | $1,300 | $1.14 | 43d | 1 | 0.62mi |
| 400 N Gates Ave Unit 1 Kingston, PA | 2.0 | 2.0 | 1198 | $1,300 | $1.09 | 43d | 1 | 0.65mi |
| 51 S Welles St Wilkes Barre, PA | 4.0 | 1.0 | 1344 | $1,600 | $1.19 | 43d | 1 | 0.88mi |
| 27 S Gates Ave Kingston, PA | 3.0 | 2.0 | 1200 | $1,750 | $1.46 | 21d | 1 | 0.88mi |
| 746 N Washington St Unit 1 Wilkes-Barre, PA | 3.0 | 2.0 | 1573 | $1,500 | $0.95 | 21d | 1 | 0.88mi |
| 13 E Chestnut St Unit 1 Wilkes-Barre, PA | 3.0 | 1.0 | 900 | $1,195 | $1.33 | 43d | 1 | 0.89mi |
| 423 Scott St Apt 1 Wilkes-Barre, PA | 3.0 | 1.0 | 1100 | $1,450 | $1.32 | 43d | 1 | 0.97mi |
| 20 N Loveland Ave Kingston, PA | 3.0 | 2.0 | 1400 | $1,775 | $1.27 | 13d | 1 | 0.99mi |
| 2 N Diamond St Wilkes-Barre, PA | 3.0 | 1.0 | 1000 | $1,500 | $1.50 | 21d | 1 | 1.04mi |
| 36 Logan St Wilkes-Barre, PA | 3.0 | 1.0 | 1200 | $1,125 | $0.94 | 43d | 1 | 1.10mi |
| 11 Holiday Dr Kingston, PA | 1.0–3.0 | 1.0–2.5 | 1083 | $2,639 | $2.44 | 13d | 14 | 1.10mi |
| 200 Gateway Dr Kingston, PA | 1.0–3.0 | 1.0–2.0 | 1130 | $3,219 | $2.85 | 13d | 1 | 1.15mi |
| 266 Rutter Ave Unit 2 Kingston, PA | 2.0 | 1.0 | 875 | $1,270 | $1.45 | 43d | 1 | 1.17mi |
| 238 Rutter Ave Kingston, PA | 2.0 | 1.0 | 1200 | $1,050 | $0.88 | 43d | 1 | 1.18mi |
| 157 E Walnut St Kingston, PA | 2.0 | 1.0 | 900 | $1,000 | $1.11 | 13d | 1 | 1.20mi |
| 151 E Walnut St Kingston, PA | 2.0 | 1.0 | 900 | $1,000 | $1.11 | 13d | 1 | 1.21mi |
| 155 W River St Wilkes Barre, PA | 3.0 | 2.0 | 1100 | $1,425 | $1.30 | 43d | 1 | 1.24mi |
| 26 Stanley St Wilkes Barre, PA | 2.0 | 1.0 | 950 | $1,650 | $1.74 | 43d | 1 | 1.28mi |
| 403 S Franklin St Wilkes Barre, PA | 2.0 | 1.0 | 900 | $1,050 | $1.17 | 21d | 1 | 1.30mi |
| 131 Academy St Wilkes Barre, PA | 3.0 | 1.0 | 1300 | $1,500 | $1.15 | 43d | 1 | 1.31mi |
| 98 E Walnut St Kingston, PA | 3.0 | 1.0 | 1280 | $1,500 | $1.17 | 21d | 1 | 1.31mi |
| 41 Main St Kingston, PA | 3.0 | 1.0 | 1350 | $1,400 | $1.04 | 21d | 1 | 1.33mi |
| 365 N Maple Ave Kingston, PA | 3.0 | 1.0 | 1600 | $1,400 | $0.88 | 21d | 1 | 1.33mi |
| 6 Magnolia St Wilkes Barre, PA | 3.0 | 2.5 | 1700 | $1,450 | $0.85 | 43d | 1 | 1.34mi |
| 47 Price St Apt 2 Kingston, PA | 2.0 | 1.0 | 1200 | $1,200 | $1.00 | 43d | 1 | 1.38mi |
Listing history 4 events
-
2026-05-01status Pending
-
2026-04-19$129,000 Active
-
2021-11-30soldstatus $72,500
-
2020-09-09$70,000
ⓘ Source: listings_history table (triggers on properties + properties_extension) + one-shot
backfill from property_details.listing_events for pre-trigger history.
Climate risk First Street
- Flood 1/10 Low FEMA zone X (unshaded) · 0% chance over 30 yrs
- Wildfire 2/10 Low
- Heat 4/10 Moderate 7 d/yr ≥95°F today · 16 d/yr by 30 yrs out
- Wind 3/10 Moderate 5% chance of damaging wind over 30 yrs
- Air quality 3/10 Moderate 2 unhealthy d/yr today · 4 by 30 yrs out
Nearby sold comps map
Loading sold comps map…
Walkable amenities ~0.75 mi
Loading nearby amenities…
Taxation est. · year 1
- Rental income
- $17,820
- − Mortgage interest
- −$7,226
- − Property taxes
- −$1,935
- − Insurance
- −$645
- − Repairs & maintenance
- −$1,426
- − Management
- −$1,426
- − Depreciation
- −$3,753
- Taxable income
- $1,410
- Est. tax owed @ 24.0%
- −$338
- After-tax cash flow
- $3,042/yr
For passive investors: Depreciation is non-cash, so a rental often shows a tax loss while cash-flowing — sheltering income. Rental losses are passive: they offset passive income freely, and up to $25,000/yr can offset ordinary (W-2) income if you actively participate and your MAGI is under $100k (phasing out to $0 by $150k); unused losses carry forward. On sale, claimed depreciation is recaptured at up to 25%, and gains may owe capital-gains tax (a 1031 exchange can defer both). Figures are a year-1 estimate at your 24.0% rate — not tax advice; consult a CPA.
Schools (NCES district)
- District
- Wilkes-Barre Area SD
- NCES district ID
- 4226300
- Math proficiency
- 19% ▼ -2.00%
- Reading proficiency
- 32% ▼ -9.00%
- Median HH income
- $37,420
- Composite
- 21.22/100
- National rank
- #8409
- State rank
- #469 of 539 in PA
Livability — Wilkes-Barre
No livability data for this city. (Only ~50 U.S. cities are tracked.)
Census & demographics
- Census place
- Wilkes-Barre, PA
- County
- Luzerne County · 118,885 people
- City population
- 73,981
- Metro
- Scranton--Wilkes-Barre, PA
- Population (ZIP)
- 41,970
- Household income
- $56,378
- Rent vs Own
- Severe rent burden
- 1632.0
Population outlook (Luzerne County) Hauer SSP2
- Today (2025)
- 319,505 people
- By 2030
- 319,943 · +0.1%
- By 2040
- 322,643 · +1.0%
- By 2050
- 330,817 · +3.5%
- By 2075
- 379,145 · +18.7%
- By 2100
- 431,908 · +35.2%
Race, ethnicity, and origin ACS 2023
- Neighborhood character
- Diverse neighborhood (Simpson 0.59)
- Race & ethnicity
- White 58% Hispanic / Latino 25% Black 12% Two or more races 11% Asian 2%
- Hispanic origin (detail)
- Mexican 6% Puerto Rican 6% Dominican 9%
- Common ancestry
- Romanian 14% Scotch-Irish 2% Iranian 1%
- Foreign-born
- 13% · Canada, Jamaica
- Languages at home
- 79% English-only · Spanish 17% Other Asian/Pacific 1% Other Indo-European 1%
Political lean MEDSL · Luzerne
- 2024 margin
- R (+19.2) · D 40.0% · R 59.2%
- 2008→2024 swing
- -27.6pp toward R · 2008: 8.4pp · 2024: -19.2pp
- All cycles
- 2024: R+19.2 2020: R+14.4 2016: R+19.6 2012: D+4.8 2008: D+8.4
Not yet ingested
- Civics
- —
Market trends
- HPI YoY
- ▼ -156.99%
- Current HPI
- 216.9373
- Rent YoY
- ▲ 6.84%
- Metro
- Scranton--Wilkes-Barre, PA
- State GDP YoY
- ▲ 1.68%
- F500 in state
- 34
Industry mix (Fortune 500 HQ in PA)
| Industry | F500 HQs | Revenue |
|---|---|---|
| Healthcare | 2 | $309B |
|
||
| Insurance | 2 | $27B |
|
||
| Telecommunications / Media | 1 | $124B |
|
||
| Industrial Distribution | 1 | $22B |
|
||
| Financial Services | 1 | $20B |
|
||
| Chemicals / Materials | 1 | $18B |
|
||
Price history
+84.3% since first listed4 events — show timeline
- 2026-05-01 Pending — PMAR
- 2026-04-19 Listed $129,000 PMAR
- 2021-11-30 Sold (Public Records) $72,500 Public Records
- 2020-09-09 Listed $70,000 LCAR
Property tax history
+20.4%/yrLatest (2026): $9,325 · +0.1% YoY. Source: county tax records.
Cash-flow waterfall
monthlySold comps — $/sqft
last 12 mo · ≤1 miLoading sold comps…