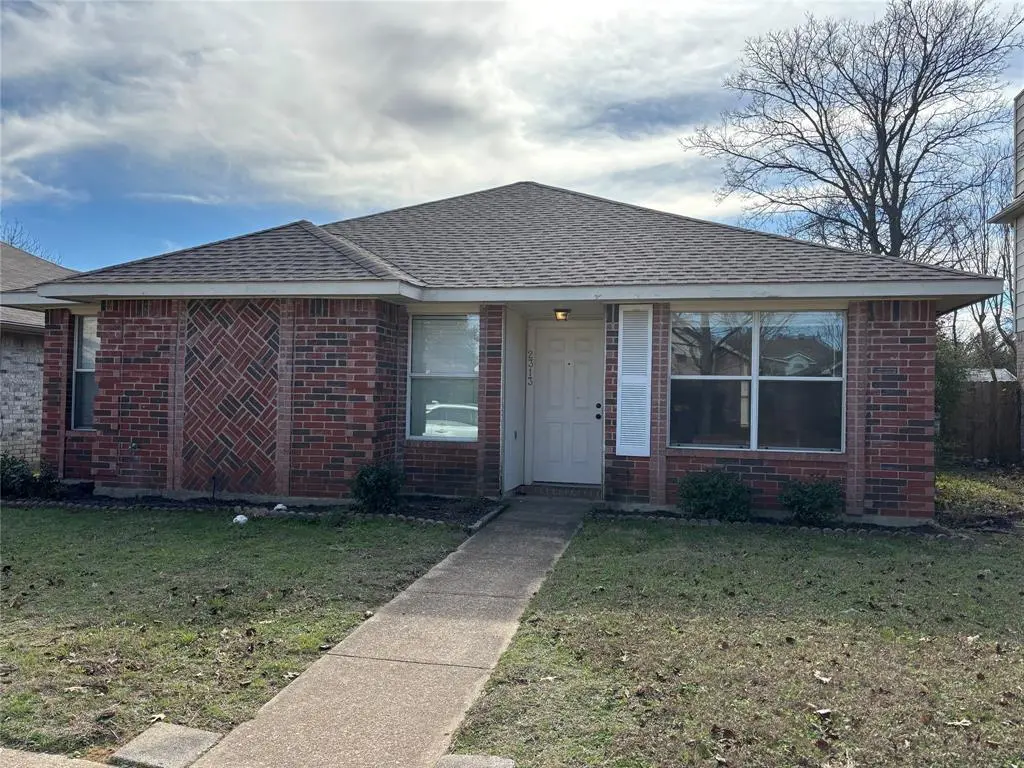
2313 Foothill Rd · McKinney, TX
Flood risk 1/10 · Minimal
- FEMA flood zone
- X (unshaded)
- Chance of flooding over 30 yrs
- 0.0%
- Est. flood insurance / yr
- $507 – $1,088
Fire risk 2/10 · Minimal
- Est. fire insurance / yr
- $1,222 – $2,270
Heat risk 8/10 · Major
- Hot days now (above 110°F)
- 7 days/yr
- Hot days in 30 yrs
- 24 days/yr
Wind risk 5/10 · Moderate
- Chance of severe wind over 30 yrs
- 26.0%
Air-quality risk 3/10 · Minor
- Unhealthy air days now
- 3 days/yr
- Unhealthy air days in 30 yrs
- 3 days/yr
Risk factors via First Street. Map © Google.
Why this score? — see what drove the D grade
The composite is a weighted blend of 9 inputs, each scored 0–100. Each bar is that input's sub-score; the figure is the points it added to the 100-point composite (weight × sub-score).
- ARV discount +14.4/15.0
- Cash flow +8.5/30.0
- Schools +5.0/10.0
- Livability +3.8/5.0
- 1% rule +3.1/10.0
- Condition / age +2.5/5.0
- DSCR +2.3/10.0
- Rent growth +2.0/5.0
- Appreciation +0.0/10.0
$259,990
🖨 Deal sheet (PDF) 📄 Offer letter ✓ Due diligence
Listing remarks MLS
Realtors welcome! Great location! New shower and toilets. Well maintained small home on quiet interior lot with extra attached storage. Easy access to US-75 and Hwy 121. 3 bedrooms, Jack-n-Jill bath, tile on living-hall, wood-look vinyl floor on kitchen, baths, and bedrooms. Nice yard for quality time and cookout. Close to town, Lake McKinney, soccer fields, Cinemark Movies 14, shopping, and more!
Key facts
- Quiet interior lot
- Close to town
- Great location
Tags
Neighborhood map
What this means for you Summary
Snapshot
- This is a 3-bed/1.5-bath single-family listed at $260k.
Deal economics
- At list price, monthly cash flow is $-229 ($-3k/yr) — negative.
- To cash-flow at today's rent, offer at most $220k (15.5% below list).
- To meet the 1% rule (rent ≥ 1% of price), the offer needs to be $210k (19.3% below list).
- Recommended offer: $210k (19.3% below list) — sets the bar for 1% rule.
- Cap rate 5.2% vs local median 2.5% in McKinney — top-decile yield for the area; either an underpriced asset or a hidden risk that comps aren't pricing in. Stress-test before assuming the spread holds.
Location & tenants
- Location reads 76/100 on livability (#115 in TX, #3,716 nationally) — a middle-class / working-renter tenant base. Strengths: crime A+, employment A+, housing A+; Watch: cost of living C-, amenities F, commute F.
- Mckinney ISD (suburban): math 54% / reading 58% proficiency, ranked #72 of 826 in TX (top 9%) — acceptable for families but not a draw, mixed tenant base, ~2y average lease.
- Market conditions: Rents soft (-1.8%/yr); 399 active listings in the ZIP; 39 comparable units currently listed for rent nearby; rentals leasing fast (median 6d on market — plan ~1-2 weeks tenant-placement turnaround); high-income renter base; 19,194 units permitted in Collin County in 2024 (3,988 in 5+ unit buildings).
- This rent is only 15% of the median local income ($166k/yr) — well below the 30% rent-burden line; pricing power to push rent on renewal without tenant pushback.
Forward outlook
- Local home prices are declining (-3.0%/yr); year-one equity from $2k of loan paydown is wiped out by about $8k of value loss. Plan a longer hold.
- Collin County population projected at +60% by 2050 — long-run rental-demand tailwind backs the buy-and-hold thesis.
Negotiation context
- It's been on market 92 days — a 9% lower offer ($237k) is reasonable based on typical stale-listing flexibility.
- 3 sale attempts since 12y ago with the ask held roughly flat each time — persistent listings suggest the price (not the market) is what's stuck; bring a comps-based counter.
Risks & watch-outs
- Climate carrying-cost: moderate wind risk, 26% chance of damaging wind over 30y; extreme-heat days projected 7→24/yr by 2055 (HVAC capex compounding) — expect insurance premiums to compound above CPI over the hold.
Questions for the listing agent
- What do current leases actually rent for vs. the listed asking? Can we see a recent rent roll and the last 12 months of T-12 income?
- It's been on market 92 days. Have you received any prior offers? Is the seller open to a 19% concession, seller financing, or rate buy-down credit?
- Why hasn't it sold? Are there any deal-killer items the seller is aware of (foundation, flood, title, zoning, code violations)?
- Is there a deadline driving the sale (1031 exchange, divorce, estate, relocation)? That informs how much negotiation room exists.
- Schools are B-rated — typically a magnet for longer-tenancy family renters. What's the average tenant stay here, and is there a school-zone premium baked into asking?
- The area grade is low — what's the realistic commute time and amenity access for the typical tenant pool here? Any planned neighborhood developments (good or bad) we should know about?
- What's the average days-on-market for RENTAL listings here right now (not sales)? A rising rental-DOM trend means longer vacancies and softer asking-rent achievability than the comps imply.
- What's the recent tenant-quality profile in this submarket — average credit score on applications, eviction rate, late-payment / NSF rate, and stable-employment percentage? A property-management company in the area should have these aggregated.
- How much new for-sale + rental construction is in the pipeline within 1–3 miles? Heavy new supply typically softens prices + rents 12–24 months out; constrained supply supports both.
Investment metrics
- 1% rule
- 0.81% ✗
- Cap rate
- 5.24%
- Cash-on-cash
- -3.77%
- DSCR
- 0.83
- GRM
- 10.3
CMA / ARV
- ARV (median comp)
- $306,950
- List price
- $259,990
- Delta
- -15.30%
- Verdict
- UNDERPRICED
- Comps
- 20 within 1.0 mi
Show comp detail 12 sales within ~0.75 mi
| Address | Dist | Beds/Ba | Sqft | Sold | Price | $/sf | Match |
|---|---|---|---|---|---|---|---|
| 2312 Park Row | 0.07mi | 3/2.0 | 1,176 (-1%) | 1mo | $305,000 | $259 | 93 |
| 2316 Park Row | 0.08mi | 3/2.0 | 1,190 (+0%) | 5mo | $299,000 | $251 | 89 |
| 2335 Cuesta Ln | 0.12mi | 3/2.0 | 1,153 (-3%) | 1mo | $308,900 | $268 | 87 |
| 803 Park View Ave | 0.09mi | 3/2.0 | 1,256 (+6%) | 7mo | $317,900 | $253 | 78 |
| 906 Park Row Cir | 0.12mi | 3/2.0 | 1,271 (+7%) | 4mo | $315,000 | $248 | 77 |
| 712 Inland Ln | 0.13mi | 3/2.0 | 1,252 (+6%) | 13mo | $317,500 | $254 | 72 |
| 2312 Brookview Dr | 0.03mi | 3/2.0 | 1,354 (+14%) | 4mo | $325,000 | $240 | 69 |
| 623 Blue Ridge St | 0.22mi | 3/2.0 | 1,252 (+6%) | 14mo | $318,999 | $255 | 67 |
| 607 Dogwood Trl | 0.35mi | 3/1.5 | 1,266 (+7%) | 8mo | $299,000 | $236 | 65 |
| 2204 Brookview Dr | 0.18mi | 2/2.0 (-1) | 1,119 (-6%) | 17mo | $315,000 | $282 | 62 |
| 2311 Park Row | 0.10mi | 3/2.0 | 1,063 (-10%) | 23mo | $300,000 | $282 | 57 |
| 811 Inland Ln | 0.13mi | 3/2.0 | 1,354 (+14%) | 18mo | $350,000 | $258 | 53 |
Match score weights: distance 35% · size 25% · config 20% · recency 20%. Top-matched comps best support the ARV.
Projected returns pro-forma
-3.0% appreciation · 0.0% rent growth · sell at horizon
- IRR
- -26.2%
- Equity multiple
- 0.14×
- Total profit
- $-62,752
- Equity at exit
- $38,765
- IRR
- -38.4%
- Equity multiple
- -0.33×
- Total profit
- $-96,802
- Equity at exit
- $22,479
Cash invested: $72,797 (down + closing). Projections, not guarantees.
Landlord ↔ Tenant lean methodology
- Overall (STATE)
- 87 Strongly Landlord-Friendly
- State Texas
- 87 Strongly Landlord-Friendly · R+5
- County
- — inherits STATE
- City
- — inherits STATE
ZIP-level market 75072
- Home prices YoY
- -26.5%
- Rents YoY
- -1.8%
- Active inventory
- 399
- Price-to-rent
- 10.3×
Monthly cashflow live
- Estimated rent
- $2,098 high interval (Pro) →
- Mortgage (P&I)
- −$1,363
- Tax from tax record
- −$414 /mo · $4,971/yr
- Insurance
- −$108
- HOA
- −$0
- Vacancy / Maint / Mgmt
- −$441
- Net cashflow
- $-229
Break-even live
Sensitivity live
| Price | -10% $-81 | -5% $-155 | +0% $-229 | +5% $-302 | +10% $-376 |
|---|---|---|---|---|---|
| Rent | -10% $-394 | -5% $-311 | +0% $-229 | +5% $-146 | +10% $-63 |
| Rate | -1.0pp $-98 | -0.5pp $-162 | base $-229 | +0.5pp $-296 | +1.0pp $-365 |
UW: 25.0% down · 7.5% · 30yr · 1.5% tax · 5.0% vac · 8.0% maint · 8.0% mgmt
Financing live
Cash to close
- Down payment
- $64,998
- Closing costs
- $7,800
- Reserves months
- —
- Total cash needed
- —
Loan-product check · same deal, 3 products live
Conventional
25% down · 7.5% · 30yr
- Down + closing
- —
- Monthly P&I
- —
- Monthly cashflow
- —
- DSCR
- —
- Eligible?
- —
Personal DTI + credit; lowest rate.
DSCR
20% down · 8.5% · 30yr
- Down + closing
- —
- Monthly P&I
- —
- Monthly cashflow
- —
- DSCR
- —
- Eligible?
- —
No personal income docs; deal must DSCR.
Hard money
10% down · 12.0% · 12mo
- Down + closing
- —
- Monthly P&I
- —
- Monthly cashflow
- —
- DSCR
- —
- Eligible?
- —
Short-term bridge; refi at stabilization.
Rent comps 39 comps
| Address | Beds | Baths | Sqft | Rent | $/sqft | DOM | Units | Dist |
|---|---|---|---|---|---|---|---|---|
| 701 Park View Ave McKinney, TX | 3.0 | 2.0 | 1455 | $2,265 | $1.56 | 17d | 1 | 0.09mi |
| 901 Wilson Creek Pkwy Unit 934 McKinney, TX | 3.0 | 2.0 | 1175 | $1,543 | $1.31 | 1d | 1 | 0.44mi |
| 901 Wilson Creek Pkwy Unit 958 McKinney, TX | 2.0 | 2.0 | 1026 | $1,384 | $1.35 | 45d | 1 | 0.44mi |
| 901 Wilson Creek Pkwy Unit 3121 McKinney, TX | 3.0 | 2.0 | 1175 | $1,594 | $1.36 | 1d | 1 | 0.44mi |
| 901 Wilson Creek Pkwy Unit 2121 McKinney, TX | 2.0 | 2.0 | 1026 | $1,343 | $1.31 | 1d | 1 | 0.44mi |
| 1703 Rockhill Rd McKinney, TX | 1.0–3.0 | 1.0–2.0 | 1068 | $2,241 | $2.10 | 1d | 25 | 0.50mi |
| 106 N West Park Dr Unit 106 McKinney, TX | 2.0 | 2.0 | 1311 | $1,675 | $1.28 | 6d | 1 | 0.51mi |
| 2700 N Brook Dr McKinney, TX | 1.0–2.0 | 1.0–2.0 | 815 | $1,625 | $1.99 | 1d | 7 | 0.53mi |
| 600 S Graves St McKinney, TX | 1.0–2.0 | 1.0–2.0 | 900 | $1,668 | $1.85 | 0d | 15 | 0.55mi |
| 2521 Wolford St McKinney, TX | 1.0–2.0 | 1.0–2.0 | 813 | $1,517 | $1.87 | 5d | 5 | 0.59mi |
| 123 Wilson Creek Blvd McKinney, TX | 1.0–2.0 | 1.0–2.0 | 821 | $1,482 | $1.81 | 4d | 10 | 0.60mi |
| 2703 Rockhill Rd McKinney, TX | 1.0–3.0 | 1.0–2.0 | 1165 | $2,799 | $2.40 | 1d | 7 | 0.63mi |
| 205 McCarley Pl McKinney, TX | 2.0 | 1.5 | 1244 | $1,825 | $1.47 | 14d | 1 | 0.66mi |
| 2770 N Brook Dr Unit 2807 McKinney, TX | 2.0 | 2.0 | 960 | $1,769 | $1.84 | 1d | 1 | 0.68mi |
| 311 Gwendola Dr McKinney, TX | 3.0 | 2.0 | 1466 | $2,650 | $1.81 | 4d | 1 | 0.78mi |
| 2312 Gabriel Dr McKinney, TX | 3.0 | 2.0 | 1440 | $2,075 | $1.44 | 9d | 1 | 0.90mi |
| 2312 Gabriel Dr McKinney, TX | 3.0 | 2.0 | 1440 | $2,075 | $1.44 | 17d | 1 | 0.90mi |
| 206 N Graves St McKinney, TX | 2.0 | 1.0 | 896 | $1,595 | $1.78 | 26d | 1 | 0.90mi |
| 2324 Stoneleigh Pl McKinney, TX | 3.0 | 2.5 | 1476 | $2,050 | $1.39 | 6d | 1 | 0.93mi |
| 1701 Park Central Dr Unit 2118 McKinney, TX | 2.0 | 2.0 | 1090 | $1,480 | $1.36 | 1d | 1 | 1.01mi |
| 1701 Park Central Dr Unit 3118 McKinney, TX | 3.0 | 2.0 | 1370 | $2,075 | $1.51 | 1d | 1 | 1.01mi |
| 1701 Park Central Dr Unit 1734 McKinney, TX | 3.0 | 2.0 | 1370 | $2,126 | $1.55 | 45d | 1 | 1.01mi |
| 1701 Park Central Dr Unit 2121 McKinney, TX | 2.0 | 2.0 | 1090 | $1,521 | $1.40 | 1d | 1 | 1.01mi |
| 1701 Park Central Dr Unit 1758 McKinney, TX | 2.0 | 2.0 | 1090 | $1,516 | $1.39 | 45d | 1 | 1.01mi |
| 1300 Eldorado Pkwy McKinney, TX | 1.0–3.0 | 1.0–2.0 | 895 | $2,041 | $2.28 | 1d | 18 | 1.02mi |
| 804 Cedar St McKinney, TX | 2.0 | 1.0 | 1322 | $1,900 | $1.44 | 20d | 1 | 1.04mi |
| 2301 W White Ave McKinney, TX | 1.0–3.0 | 1.0–2.0 | 836 | $1,705 | $2.04 | 1d | 12 | 1.06mi |
| 602 N Morris St Unit B McKinney, TX | 2.0 | 1.0 | 900 | $1,900 | $2.11 | 26d | 1 | 1.14mi |
| 901 W Virginia St McKinney, TX | 3.0 | 1.5 | 1247 | $2,000 | $1.60 | 26d | 1 | 1.15mi |
| 708 W Largent St McKinney, TX | 2.0 | 1.0 | 1150 | $1,795 | $1.56 | 45d | 1 | 1.18mi |
| 1500 Eldorado Pkwy McKinney, TX | 1.0–2.0 | 1.0–2.0 | 821 | $1,505 | $1.83 | 1d | 38 | 1.21mi |
| 1212 Community Ave McKinney, TX | 1.0–3.0 | 1.0–2.0 | 949 | $5,614 | $5.92 | 0d | 1 | 1.23mi |
| 304 Oak St McKinney, TX | 2.0 | 1.0 | 775 | $1,495 | $1.93 | 45d | 1 | 1.26mi |
| 1807 W Josephine St McKinney, TX | 3.0 | 1.5 | 1228 | $2,400 | $1.95 | 45d | 1 | 1.27mi |
| 307 N Bradley St Unit A McKinney, TX | 2.0 | 1.0 | 794 | $1,795 | $2.26 | 19d | 1 | 1.28mi |
| 1904 W White Ave McKinney, TX | 1.0–2.0 | 1.0–2.0 | 787 | $2,000 | $2.54 | 1d | 6 | 1.44mi |
| 1106 Lock Rdg McKinney, TX | 3.0 | 2.0 | 1451 | $2,200 | $1.52 | 45d | 1 | 1.45mi |
| 411 S Benge St McKinney, TX | 3.0 | 2.0 | 1158 | $2,375 | $2.05 | 45d | 1 | 1.46mi |
| 1311 N Morris St McKinney, TX | 2.0 | 1.0 | 850 | $1,600 | $1.88 | 45d | 1 | 1.49mi |
Listing history 14 events
-
2026-06-02statusdays on market $259,990 Pending 92 DOM
-
2026-06-01days on market $259,990 Active Option Contract 91 DOM
-
2026-05-31days on market $259,990 Active Option Contract 90 DOM
-
2026-03-12status Active 400-char remark
Show marketing remark (400 chars)
Realtors welcome! Great location! New shower and toilets. Well maintained small home on quiet interior lot with extra attached storage. Easy access to US-75 and Hwy 121. 3 bedrooms, Jack-n-Jill bath, tile on living-hall, wood-look vinyl floor on kitchen, baths, and bedrooms. Nice yard for quality time and cookout. Close to town, Lake McKinney, soccer fields, Cinemark Movies 14, shopping, and more!
-
2026-01-13$259,990 Active 400-char remark
Show marketing remark (400 chars)
Realtors welcome! Great location! New shower and toilets. Well maintained small home on quiet interior lot with extra attached storage. Easy access to US-75 and Hwy 121. 3 bedrooms, Jack-n-Jill bath, tile on living-hall, wood-look vinyl floor on kitchen, baths, and bedrooms. Nice yard for quality time and cookout. Close to town, Lake McKinney, soccer fields, Cinemark Movies 14, shopping, and more!
-
2026-01-12soldstatus
-
2017-07-06soldstatus
-
2017-03-29soldstatus
-
2016-05-10soldstatus
-
2014-12-04soldstatus
-
2014-12-02soldstatus Sold 361-char remark
Show marketing remark (361 chars)
Realtors welcome! Great location! Lovely impeccably maintained small home on quiet interior lot. Easy access to US-75 and Hwy 121. 3 bedrooms, Jack-n-Jill bath, tile on living-hall, wood-look vinyl floor on kitchen, baths, and bedrooms. Nice yard for quality time and cookout. Close to town, Lake McKinney, soccer fields, Cinemark Movies 14, shopping, and more!
-
2014-11-17historical Active Option Contract 361-char remark
Show marketing remark (361 chars)
Realtors welcome! Great location! Lovely impeccably maintained small home on quiet interior lot. Easy access to US-75 and Hwy 121. 3 bedrooms, Jack-n-Jill bath, tile on living-hall, wood-look vinyl floor on kitchen, baths, and bedrooms. Nice yard for quality time and cookout. Close to town, Lake McKinney, soccer fields, Cinemark Movies 14, shopping, and more!
-
2014-11-10$137,500 Active 361-char remark
Show marketing remark (361 chars)
Realtors welcome! Great location! Lovely impeccably maintained small home on quiet interior lot. Easy access to US-75 and Hwy 121. 3 bedrooms, Jack-n-Jill bath, tile on living-hall, wood-look vinyl floor on kitchen, baths, and bedrooms. Nice yard for quality time and cookout. Close to town, Lake McKinney, soccer fields, Cinemark Movies 14, shopping, and more!
-
1998-10-21soldstatus
ⓘ Source: listings_history table (triggers on properties + properties_extension) + one-shot
backfill from property_details.listing_events for pre-trigger history.
Tax reassessment forecast TX · Resets to sale price
- Current annual tax
- $4,971 · $414/mo
- Projected year-2 tax
- $4,971 · $414/mo
- Expected delta
- $0/yr ($0/mo · 0.0%)
ⓘ Screening estimate from a state-policy table — verify with the county assessor before closing.
Climate risk First Street
- Flood 1/10 Low FEMA zone X (unshaded) · 0% chance over 30 yrs
- Wildfire 2/10 Low
- Heat 8/10 Severe 7 d/yr ≥110°F today · 24 d/yr by 30 yrs out
- Wind 5/10 Major 26% chance of damaging wind over 30 yrs
- Air quality 3/10 Moderate 3 unhealthy d/yr today · 3 by 30 yrs out
Nearby sold comps map
Loading sold comps map…
Walkable amenities ~0.75 mi
Loading nearby amenities…
Taxation est. · year 1
- Rental income
- $25,175
- − Mortgage interest
- −$14,563
- − Property taxes
- −$4,971
- − Insurance
- −$1,300
- − Repairs & maintenance
- −$2,014
- − Management
- −$2,014
- − Depreciation
- −$7,563
- Taxable loss
- −$7,251
- Est. tax savings @ 24.0%
- +$1,740
- After-tax cash flow
- $-1,003/yr
For passive investors: Depreciation is non-cash, so a rental often shows a tax loss while cash-flowing — sheltering income. Rental losses are passive: they offset passive income freely, and up to $25,000/yr can offset ordinary (W-2) income if you actively participate and your MAGI is under $100k (phasing out to $0 by $150k); unused losses carry forward. On sale, claimed depreciation is recaptured at up to 25%, and gains may owe capital-gains tax (a 1031 exchange can defer both). Figures are a year-1 estimate at your 24.0% rate — not tax advice; consult a CPA.
Schools (NCES district)
- District
- Mckinney ISD
- NCES district ID
- 4829850
- Math proficiency
- 54% ▼ -9.00%
- Reading proficiency
- 58% ▼ -2.00%
- Median HH income
- $78,283
- Composite
- 50.46/100
- National rank
- #1862
- State rank
- #72 of 826 in TX
Livability — McKinney
- Score
- 76/100
- State rank
- #115
- US rank
- #3716
Category grades
Schools grade is shown separately in the Schools card above.
Census & demographics
- Census place
- McKinney, TX
- County
- Collin County · 1,159,394 people
- City population
- 232,161
- Metro
- Dallas-Fort Worth-Arlington, TX
- Population (ZIP)
- 55,087
- Household income
- $165,682
- Rent vs Own
- Severe rent burden
- 671.0
Population outlook (Collin County) Hauer SSP2
- Today (2025)
- 1,210,074 people
- By 2030
- 1,358,201 · +12.2%
- By 2040
- 1,654,061 · +36.7%
- By 2050
- 1,937,359 · +60.1%
- By 2075
- 2,567,039 · +112.1%
- By 2100
- 2,952,048 · +144.0%
Race, ethnicity, and origin ACS 2023
- Neighborhood character
- Diverse neighborhood (Simpson 0.57)
- Race & ethnicity
- White 63% Asian 12% Hispanic / Latino 11% Two or more races 10% Black 8%
- Hispanic origin (detail)
- Mexican 6%
- Common ancestry
- Lithuanian 3% Slovak 2% Italian 2%
- Foreign-born
- 16% · Canada, China, Vietnam
- Languages at home
- 80% English-only · Spanish 6% Other Indo-European 5% Other Asian/Pacific 3%
Political lean MEDSL · Collin
- 2024 margin
- R (+11.1) · D 43.1% · R 54.3% · Other 2.6%
- 2008→2024 swing
- +14.4pp toward D · 2008: -25.6pp · 2024: -11.1pp
- All cycles
- 2024: R+11.1 2020: R+4.3 2016: R+17.0 2012: R+31.6 2008: R+25.6
Not yet ingested
- Civics
- —
Market trends
- HPI YoY
- ▼ -57.96%
- Current HPI
- 161.081
- Rent YoY
- ▼ -1.82%
- Metro
- Dallas-Fort Worth-Arlington, TX
- State GDP YoY
- ▲ 3.95%
- F500 in state
- 110
Industry mix (Fortune 500 HQ in TX)
| Industry | F500 HQs | Revenue |
|---|---|---|
| Energy | 16 | $1,198B |
|
||
| Technology | 5 | $198B |
|
||
| Engineering / Construction | 4 | $72B |
|
||
| Energy Services | 3 | $60B |
|
||
| Utilities | 3 | $41B |
|
||
| Healthcare | 2 | $330B |
|
||
Price history
+89.1% since first listed11 events — show timeline
- 2026-03-12 Relisted — NTREIS
- 2026-01-13 Listed $259,990 NTREIS
- 2026-01-12 Sold (Public Records) — Public Records
- 2017-07-06 Sold (Public Records) — Public Records
- 2017-03-29 Sold (Public Records) — Public Records
- 2016-05-10 Sold (Public Records) — Public Records
- 2014-12-04 Sold (Public Records) — Public Records
- 2014-12-02 Sold (MLS) — NTREIS
- 2014-11-17 Contingent — NTREIS
- 2014-11-10 Listed $137,500 NTREIS
- 1998-10-21 Sold (Public Records) — Public Records
Property tax history
+4.4%/yrLatest (2025): $4,971 · -6.7% YoY. Source: county tax records.
Cash-flow waterfall
monthlySold comps — $/sqft
last 12 mo · ≤1 miLoading sold comps…