1809 9th St · Brownwood, TX
Flood risk 1/10 · Minimal
- FEMA flood zone
- X (unshaded)
- Chance of flooding over 30 yrs
- 0.0%
- Est. flood insurance / yr
- $507 – $1,088
Fire risk 6/10 · Moderate
- Est. fire insurance / yr
- $1,222 – $2,270
Heat risk 7/10 · Major
- Hot days now (above 107°F)
- 7 days/yr
- Hot days in 30 yrs
- 23 days/yr
Wind risk 6/10 · Moderate
- Chance of severe wind over 30 yrs
- 27.0%
Air-quality risk 1/10 · Minimal
- Unhealthy air days now
- 0 days/yr
- Unhealthy air days in 30 yrs
- 0 days/yr
Risk factors via First Street. Map © Google.
Why this score? — see what drove the C+ grade
The composite is a weighted blend of 9 inputs, each scored 0–100. Each bar is that input's sub-score; the figure is the points it added to the 100-point composite (weight × sub-score).
- Cash flow +22.4/30.0
- ARV discount +13.0/15.0
- DSCR +7.2/10.0
- 1% rule +6.0/10.0
- Schools +3.6/10.0
- Livability +3.2/5.0
- Rent growth +2.5/5.0
- Condition / age +2.5/5.0
- Appreciation +0.0/10.0
$119,500
🖨 Deal sheet 📄 Offer letter ✓ Due diligence
Listing remarks MLS
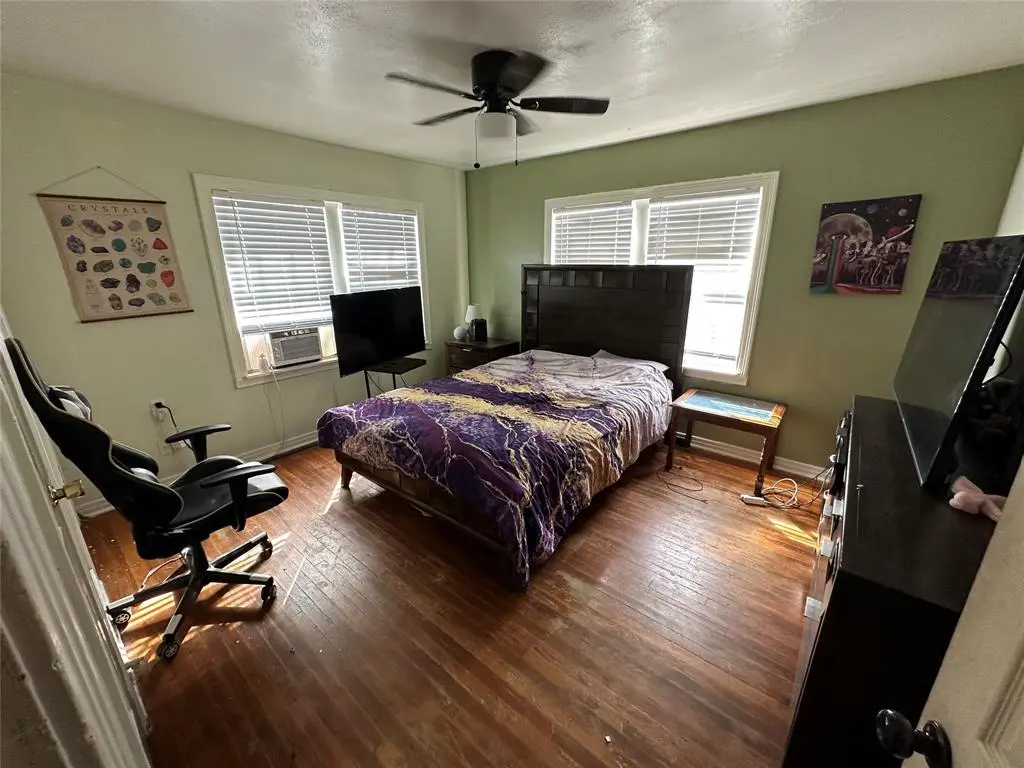
This charming two-bedroom, one-bath home features beautiful original hardwood floors and a spacious backyard perfect for outdoor fun. Located in a peaceful neighborhood, it offers a great retreat from the hustle and bustle. Plus, it comes equipped with solar panels, making it eco-friendly and energy-efficient. You'll enjoy the convenience of being not far from all the amenities that Brownwood has to offer, ensuring you have everything you need within easy reach. This home is a wonderful blend of comfort and practicality.
Key facts
- Spacious backyard
- Solar panels
- Close to amenities
Tags
Neighborhood map
What this means for you Summary
Snapshot
- This is a 2-bed/1.0-bath single-family listed at $120k.
Deal economics
- At list price, monthly cash flow is $199 ($2k/yr) — positive.
- The deal already cash-flows at list — no discount required.
- Meets the 1% rule at list price ($1k rent vs $120k).
- Recommended offer: $105k (12.0% below list) — sets the bar for market timing.
- Cap rate 8.3% vs local median 3.7% in Brownwood — top-decile yield for the area; either an underpriced asset or a hidden risk that comps aren't pricing in. Stress-test before assuming the spread holds.
Location & tenants
- Location reads 64/100 on livability (#781 in TX) — a middle-class / working-renter tenant base. Strengths: cost of living A+, housing A+; Watch: crime D+, health & safety D+, schools F.
- Brownwood ISD (town): math 45% / reading 41% proficiency, ranked #344 of 826 in TX (top 42%) — families likely to look elsewhere, expect single-tenant / working-renter base with shorter leases.
- Market conditions: 377 active listings in the ZIP; 3 comparable units currently listed for rent nearby; rentals lingering (median 44d on market — plan ~5-8 weeks vacancy on turnover, expect pricing pressure); 100% of comp listings sitting > 30 days — soft ceiling on asking rent; 142 units permitted in Brown County in 2024 (0 in 5+ unit buildings).
Forward outlook
- Local home prices are declining (-3.0%/yr); year-one equity from $826 of loan paydown is wiped out by about $4k of value loss. Plan a longer hold.
Negotiation context
- It's been on market 162 days — a 12% lower offer ($105k) is reasonable based on typical stale-listing flexibility.
- 10 sale attempts since 18y ago with the ask held roughly flat each time — persistent listings suggest the price (not the market) is what's stuck; bring a comps-based counter.
Risks & watch-outs
- Climate carrying-cost: major wind risk, 27% chance of damaging wind over 30y; major wildfire risk; extreme-heat days projected 7→23/yr by 2055 (HVAC capex compounding) — expect insurance premiums to compound above CPI over the hold.
Questions for the listing agent
- It's been on market 162 days. Have you received any prior offers? Is the seller open to a 12% concession, seller financing, or rate buy-down credit?
- Why hasn't it sold? Are there any deal-killer items the seller is aware of (foundation, flood, title, zoning, code violations)?
- Is there a deadline driving the sale (1031 exchange, divorce, estate, relocation)? That informs how much negotiation room exists.
- Schools are F-rated, which usually means shorter tenancies and higher turnover. Who's the typical renter profile here, and what's been the actual vacancy rate?
- Crime grade is D in this area — have there been break-ins, vandalism, or insurance claims at this property in the last 3 years? What carrier currently insures it and at what premium?
- What's the average days-on-market for RENTAL listings here right now (not sales)? A rising rental-DOM trend means longer vacancies and softer asking-rent achievability than the comps imply.
- What's the recent tenant-quality profile in this submarket — average credit score on applications, eviction rate, late-payment / NSF rate, and stable-employment percentage? A property-management company in the area should have these aggregated.
- How much new for-sale + rental construction is in the pipeline within 1–3 miles? Heavy new supply typically softens prices + rents 12–24 months out; constrained supply supports both.
Investment metrics
- 1% rule
- 1.10% ✓
- Cap rate
- 8.29%
- Cash-on-cash
- 7.12%
- DSCR
- 1.32
- GRM
- 7.6
CMA / ARV
- ARV (median comp)
- $136,109
- List price
- $119,500
- Delta
- -12.20%
- Verdict
- UNDERPRICED
- Comps
- 20 within 1.0 mi
Show comp detail 12 sales within ~0.75 mi
| Address | Dist | Beds/Ba | Sqft | Sold | Price | $/sf | Match |
|---|---|---|---|---|---|---|---|
| 1611 3rd St | 0.46mi | 2/1.0 | 1,146 (-4%) | 7mo | $139,000 | $121 | 65 |
| 2302 Berkley St | 0.49mi | 3/1.0 (+1) | 1,276 (+6%) | 1mo | $178,000 | $139 | 61 |
| 2204 Berkley St | 0.43mi | 3/1.0 (+1) | 1,128 (-6%) | 6mo | $134,900 | $120 | 60 |
| 1801 6th St | 0.25mi | 3/1.0 (+1) | 1,363 (+14%) | 2mo | $143,500 | $105 | 59 |
| 2103 9th St | 0.25mi | 3/2.0 (+1) | 1,062 (-12%) | 2mo | $185,000 | $174 | 59 |
| 1215 Avenue J | 0.64mi | 2/1.0 | 1,160 (-3%) | 7mo | $54,999 | $47 | 58 |
| 1410 13th St | 0.28mi | 3/2.0 (+1) | 1,349 (+12%) | 7mo | $232,500 | $172 | 51 |
| 1609 2nd St | 0.56mi | 3/2.0 (+1) | 1,300 (+8%) | 4mo | $220,000 | $169 | 48 |
| 1201 8th St | 0.44mi | 3/2.0 (+1) | 1,372 (+14%) | 1mo | $129,850 | $95 | 46 |
| 2206 8th St | 0.36mi | 3/2.0 (+1) | 1,363 (+14%) | 8mo | $239,900 | $176 | 45 |
| 2503 Belmeade St | 0.68mi | 3/1.0 (+1) | 1,072 (-11%) | 3mo | $135,000 | $126 | 43 |
| 2501 Greenway Dr | 0.59mi | 3/2.0 (+1) | 1,363 (+14%) | 2mo | $209,000 | $153 | 39 |
Match score weights: distance 35% · size 25% · config 20% · recency 20%. Top-matched comps best support the ARV.
Projected returns pro-forma
-3.0% appreciation · 3.0% rent growth · sell at horizon
- IRR
- -5.4%
- Equity multiple
- 0.80×
- Total profit
- $-6,690
- Equity at exit
- $17,818
- IRR
- 4.3%
- Equity multiple
- 1.32×
- Total profit
- $10,577
- Equity at exit
- $10,332
Cash invested: $33,460 (down + closing). Projections, not guarantees.
Landlord ↔ Tenant lean methodology
- Overall (STATE)
- 87 Strongly Landlord-Friendly
- State Texas
- 87 Strongly Landlord-Friendly · R+5
- County
- — inherits STATE
- City
- — inherits STATE
ZIP-level market 76801
- Active inventory
- 377
- Price-to-rent
- 7.6×
Monthly cashflow live
- Estimated rent
- $1,317 medium interval (Pro) →
- Mortgage (P&I)
- −$627
- Tax from tax record
- −$165 /mo · $1,984/yr
- Insurance
- −$50
- HOA
- −$0
- Vacancy / Maint / Mgmt
- −$277
- Net cashflow
- $199
Break-even live
UW: 25.0% down · 7.5% · 30yr · 1.5% tax · 5.0% vac · 8.0% maint · 8.0% mgmt
Financing live
Cash to close
- Down payment
- $29,875
- Closing costs
- $3,585
- Reserves months
- —
- Total cash needed
- —
Loan-product check · same deal, 3 products live
Conventional
25% down · 7.5% · 30yr
- Down + closing
- —
- Monthly P&I
- —
- Monthly cashflow
- —
- DSCR
- —
- Eligible?
- —
Personal DTI + credit; lowest rate.
DSCR
20% down · 8.5% · 30yr
- Down + closing
- —
- Monthly P&I
- —
- Monthly cashflow
- —
- DSCR
- —
- Eligible?
- —
No personal income docs; deal must DSCR.
Hard money
10% down · 12.0% · 12mo
- Down + closing
- —
- Monthly P&I
- —
- Monthly cashflow
- —
- DSCR
- —
- Eligible?
- —
Short-term bridge; refi at stabilization.
Rent comps 3 comps
| Address | Beds | Baths | Sqft | Rent | $/sqft | DOM | Units | Dist |
|---|---|---|---|---|---|---|---|---|
| 2411 13th St Brownwood, TX | 3.0 | 2.0 | 1466 | $1,800 | $1.23 | 43d | 1 | 0.60mi |
| 2001 Brady Ave Unit Booker 703 Brownwood, TX | 2.0 | 1.0 | 1247 | $1,045 | $0.84 | 43d | 1 | 0.70mi |
| 2001 Brady Ave Unit 1705 Austin-A Brownwood, TX | 2.0 | 1.0 | 1070 | $1,095 | $1.02 | 43d | 1 | 0.70mi |
Listing history 37 events
-
2026-06-18days on market $119,500 Active 162 DOM
-
2026-06-17days on market $119,500 Active 161 DOM
-
2026-06-16days on market $119,500 Active 160 DOM
-
2026-06-15days on market $119,500 Active 159 DOM
-
2026-06-13days on market $119,500 Active 157 DOM
-
2026-06-12days on market $119,500 Active 156 DOM
-
2026-06-09days on market $119,500 Active 153 DOM
-
2026-06-08days on market $119,500 Active 152 DOM
-
2026-06-08days on market $119,500 Active 151 DOM
-
2026-06-07days on market $119,500 Active 150 DOM
-
2026-06-03days on market $119,500 Active 147 DOM
-
2026-06-02days on market $119,500 Active 146 DOM
-
2026-06-01days on market $119,500 Active 145 DOM
-
2026-05-31days on market $119,500 Active 144 DOM
-
2026-01-07$119,500 Active 526-char remark
Show marketing remark (526 chars)
This charming two-bedroom, one-bath home features beautiful original hardwood floors and a spacious backyard perfect for outdoor fun. Located in a peaceful neighborhood, it offers a great retreat from the hustle and bustle. Plus, it comes equipped with solar panels, making it eco-friendly and energy-efficient. You'll enjoy the convenience of being not far from all the amenities that Brownwood has to offer, ensuring you have everything you need within easy reach. This home is a wonderful blend of comfort and practicality.
-
2025-12-31historical
-
2025-01-17$119,500 Active
-
2024-12-31historical
-
2024-09-04status Active
-
2024-08-26historical Active Option Contract
-
2024-07-16$135,000 Active
-
2024-05-09price $99,000
-
2024-05-01$990,000 Active
-
2021-07-09soldstatus Sold
-
2021-07-09soldstatus
-
2021-03-09historical Active Option Contract
-
2021-03-05$70,000 Active
-
2014-10-07historical
-
2014-05-09$64,900 Active
-
2011-11-28historical
-
2011-11-26historical
-
2011-05-25$59,500
-
2011-05-25$59,500
-
2008-09-19soldstatus
-
2008-09-19soldstatus
-
2008-08-06historical
-
2008-07-16$48,000
ⓘ Source: listings_history table (triggers on properties + properties_extension) + one-shot
backfill from property_details.listing_events for pre-trigger history.
Tax reassessment forecast TX · Resets to sale price
- Current annual tax
- $1,984 · $165/mo
- Projected year-2 tax
- $2,187 · $182/mo
- Expected delta
- +$203/yr (+$17/mo · 10.2%)
ⓘ Screening estimate from a state-policy table — verify with the county assessor before closing.
Climate risk First Street
- Flood 1/10 Low FEMA zone X (unshaded) · 0% chance over 30 yrs
- Wildfire 6/10 Major
- Heat 7/10 Severe 7 d/yr ≥107°F today · 23 d/yr by 30 yrs out
- Wind 6/10 Major 27% chance of damaging wind over 30 yrs
- Air quality 1/10 Low 0 unhealthy d/yr today · 0 by 30 yrs out
Nearby sold comps map
Loading sold comps map…
Walkable amenities ~0.75 mi
Loading nearby amenities…
Taxation est. · year 1
- Rental income
- $15,803
- − Mortgage interest
- −$6,694
- − Property taxes
- −$1,984
- − Insurance
- −$598
- − Repairs & maintenance
- −$1,264
- − Management
- −$1,264
- − Depreciation
- −$3,476
- Taxable income
- $522
- Est. tax owed @ 24.0%
- −$125
- After-tax cash flow
- $2,257/yr
For passive investors: Depreciation is non-cash, so a rental often shows a tax loss while cash-flowing — sheltering income. Rental losses are passive: they offset passive income freely, and up to $25,000/yr can offset ordinary (W-2) income if you actively participate and your MAGI is under $100k (phasing out to $0 by $150k); unused losses carry forward. On sale, claimed depreciation is recaptured at up to 25%, and gains may owe capital-gains tax (a 1031 exchange can defer both). Figures are a year-1 estimate at your 24.0% rate — not tax advice; consult a CPA.
Schools (NCES district)
- District
- Brownwood ISD
- NCES district ID
- 4811700
- Math proficiency
- 45% ▲ 4.00%
- Reading proficiency
- 41% ▲ 1.00%
- Median HH income
- $37,395
- Composite
- 35.8/100
- National rank
- #4833
- State rank
- #344 of 826 in TX
Livability — Brownwood
- Score
- 64/100
- State rank
- #781
- US rank
- #14230
Category grades
Schools grade is shown separately in the Schools card above.
Census & demographics
- Census place
- Brownwood, TX
- Population (ZIP)
- 25,152
Population outlook (Brown County) Hauer SSP2
- Today (2025)
- 38,381 people
- By 2030
- 38,288 · -0.2%
- By 2040
- 38,120 · -0.7%
- By 2050
- 38,227 · -0.4%
- By 2075
- 39,362 · +2.6%
- By 2100
- 39,171 · +2.1%
Race, ethnicity, and origin ACS 2023
- Neighborhood character
- Predominantly White (66%)
- Race & ethnicity
- White 66% Hispanic / Latino 26% Two or more races 15% Black 4%
- Hispanic origin (detail)
- Mexican 23%
- Common ancestry
- Italian 12% Slovak 2% Lithuanian 1%
- Foreign-born
- 4% · Canada
- Languages at home
- 82% English-only · Spanish 17%
Political lean MEDSL · Brown
- 2024 margin
- Solid R (+73.9) · D 12.7% · R 86.6%
- 2008→2024 swing
- -12.5pp toward R · 2008: -61.5pp · 2024: -73.9pp
- All cycles
- 2024: R+73.9 2020: R+72.6 2016: R+74.5 2012: R+71.7 2008: R+61.5
Not yet ingested
- Civics
- —
Market trends
- HPI YoY
- ▼ -121.52%
- Current HPI
- 164.0992
- Rent YoY
- —
- Metro
- —
- State GDP YoY
- ▲ 3.95%
- F500 in state
- 110
Industry mix (Fortune 500 HQ in TX)
| Industry | F500 HQs | Revenue |
|---|---|---|
| Energy | 16 | $1,198B |
|
||
| Technology | 5 | $198B |
|
||
| Engineering / Construction | 4 | $72B |
|
||
| Energy Services | 3 | $60B |
|
||
| Utilities | 3 | $41B |
|
||
| Healthcare | 2 | $330B |
|
||
Price history
+149.0% since first listed23 events — show timeline
- 2026-01-07 Listed $119,500 NTREIS
- 2025-12-31 Listing Removed — NTREIS
- 2025-01-17 Listed $119,500 NTREIS
- 2024-12-31 Listing Removed — NTREIS
- 2024-09-04 Relisted — NTREIS
- 2024-08-26 Contingent — NTREIS
- 2024-07-16 Listed $135,000 NTREIS
- 2024-05-09 Price Changed $99,000 NTREIS
- 2024-05-01 Listed $990,000 NTREIS
- 2021-07-09 Sold (Public Records) — Public Records
- 2021-07-09 Sold (MLS) — NTREIS
- 2021-03-09 Contingent — NTREIS
- 2021-03-05 Listed $70,000 NTREIS
- 2014-10-07 Listing Removed — NTREIS
- 2014-05-09 Listed $64,900 NTREIS
- 2011-11-28 Listing Removed — NTREIS
- 2011-11-26 Listing Removed — NTREIS
- 2011-05-25 Listed $59,500 NTREIS
- 2011-05-25 Listed $59,500 NTREIS
- 2008-09-19 Sold (Public Records) — Public Records
- 2008-09-19 Sold (MLS) — NTREIS
- 2008-08-06 Listing Removed — NTREIS
- 2008-07-16 Listed $48,000 NTREIS
Property tax history
+2.9%/yrLatest (2025): $1,984 · +0.8% YoY. Source: county tax records.
Cash-flow waterfall
monthlySold comps — $/sqft
last 12 mo · ≤1 miLoading sold comps…