6507 Mississippi 311 · Mount Pleasant, MS
Flood risk 1/10 · Minimal
- FEMA flood zone
- X (unshaded)
- Chance of flooding over 30 yrs
- 0.0%
- Est. flood insurance / yr
- $507 – $1,088
Fire risk 4/10 · Minor
- Est. fire insurance / yr
- $1,241 – $2,305
Heat risk 6/10 · Moderate
- Hot days now (above 108°F)
- 7 days/yr
- Hot days in 30 yrs
- 21 days/yr
Wind risk 4/10 · Minor
- Chance of severe wind over 30 yrs
- 18.0%
Air-quality risk 2/10 · Minimal
- Unhealthy air days now
- 2 days/yr
- Unhealthy air days in 30 yrs
- 2 days/yr
Risk factors via First Street. Map © Google.
Why this score? — see what drove the D grade
The composite is a weighted blend of 9 inputs, each scored 0–100. Each bar is that input's sub-score; the figure is the points it added to the 100-point composite (weight × sub-score).
- Cash flow +13.0/30.0
- ARV discount +7.5/15.0
- Appreciation +5.0/10.0
- DSCR +3.9/10.0
- 1% rule +3.1/10.0
- Rent growth +2.5/5.0
- Livability +2.5/5.0
- Condition / age +2.5/5.0
- Schools +1.8/10.0
$175,000
🖨 Deal sheet (PDF) 📄 Offer letter ✓ Due diligence
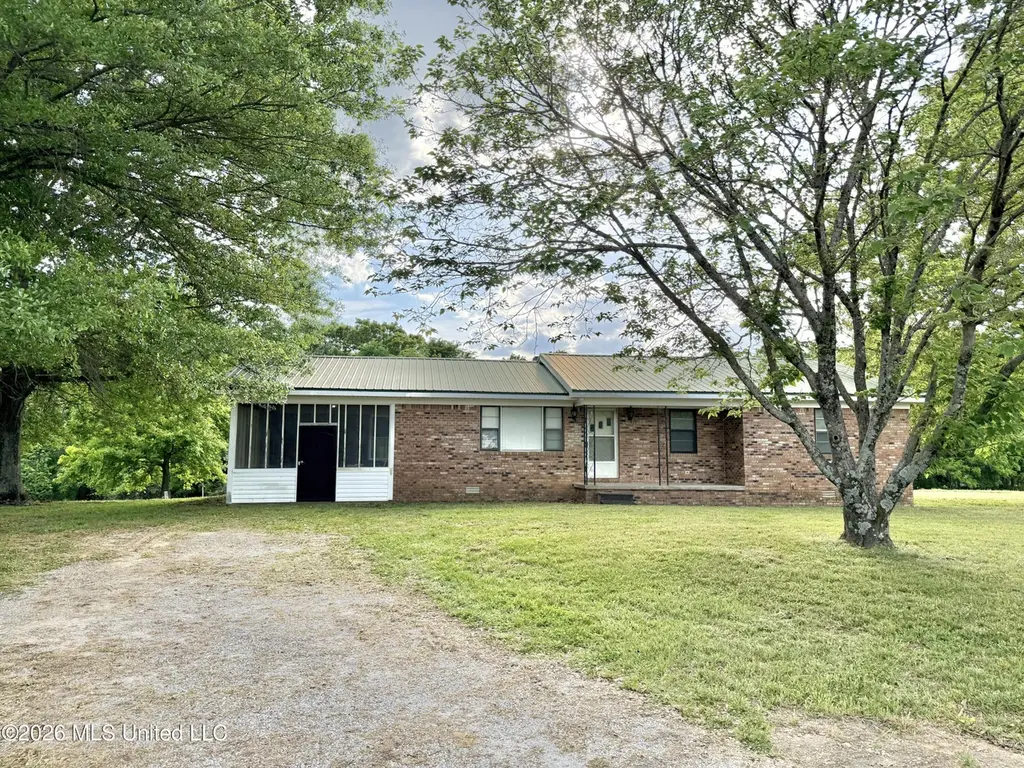
Listing remarks
Welcome to peaceful country living just off Highway 311 in Holly Springs. Situated on approximately 2 acres, this well-maintained 3-bedroom, 1-bath home offers 1,596 square feet of comfortable living space with plenty of room to enjoy privacy and open surroundings. You'll appreciate the quiet setting and spacious feel this property provides, surrounded by open land and a peaceful rural atmosphere. Conveniently located just about 15 minutes from Collierville, approximately 25 minutes from Olive Branch, and about 40 minutes from downtown Memphis, this property offers the perfect balance of rural living with easy access to shopping, dining, and major employment centers. Move-in ready and full
Key facts
- Open land
- Move-in ready
- Modern upgrades
Tags
Property features AI
Finance
- Other: Property type: Single Family Residence; Address: 6507 Mississippi 311, Holly Springs, MS 38635; Directions: From Holly Springs, proceed North on MS-311 for approximately 9.6 miles and the property is on the left.
Exterior
- Parking: Private gravel driveway
- Utilities: Well water; Septic tank; Electricity connected; Propane connected; Water connected; Sewer connected
- Home design: Single-family house; One story; 2 acres
- Construction: Brick construction; Metal roof; Concrete perimeter foundation; Originally measured at 1,596 living area (appraiser)
- Exterior features: Screened porch; Front yard; Few trees; Rectangular lot
Interior
- Flooring: Carpet; Vinyl
- Bathrooms: 1 full bathroom
- Heating & cooling: Electric forced-air heating; Central air conditioning
- Interior features: Electric water heater; Crawl space basement
Neighborhood map
What this means for you Summary
Snapshot
- This is a 3-bed/1.0-bath single-family listed at $175k.
Deal economics
- At list price, monthly cash flow is $-10 ($-122/yr) — negative.
- To cash-flow at today's rent, offer at most $173k (1.0% below list).
- To meet the 1% rule (rent ≥ 1% of price), the offer needs to be $143k (18.5% below list).
- Recommended offer: $143k (18.5% below list) — sets the bar for 1% rule.
- Cap rate 6.2% vs local median 3.0% in Mount Pleasant — top-decile yield for the area; either an underpriced asset or a hidden risk that comps aren't pricing in. Stress-test before assuming the spread holds.
Location & tenants
- Location reads: area grade D — affects rentability + tenant quality, not the cash-flow math above.
- Marshall County School District (rural): math 18% / reading 25% proficiency, ranked #87 of 130 in MS (top 67%) — low school quality limits family demand, transient renter base, plan for 1-2y turnover; 84% free/reduced lunch — lower-income household profile, screen leases tightly.
- Zoned schools: Byhalia Middle School (5-8) (math 18% / reading 24%, grade F, #112 of 179 statewide, top 64%, 444 students, 100% FRL) — zoned schools average 100% FRL vs 84% district-wide (16 pts higher); higher-poverty schools than district average — tighter screening recommended.
- Market conditions: 147 active listings in the ZIP; 310 units permitted in Marshall County in 2024 (0 in 5+ unit buildings).
Forward outlook
- In year one you build about $1k of equity ($1k loan paydown + $-18 appreciation (-0.0% local appreciation)).
- Marshall County population projected at -24% by 2050 — secular population decline; favor cash flow + early exit over multi-decade hold.
Negotiation context
- It's been on market 15 days — a 2% lower offer ($172k) is reasonable based on typical stale-listing flexibility.
Risks & watch-outs
- Climate carrying-cost: extreme-heat days projected 7→21/yr by 2055 (HVAC capex compounding) — expect insurance premiums to compound above CPI over the hold.
Questions for the listing agent
- What do current leases actually rent for vs. the listed asking? Can we see a recent rent roll and the last 12 months of T-12 income?
- Built in 1974 — when were the roof, HVAC, electrical panel, plumbing, and water heater last replaced?
- Is there a deadline driving the sale (1031 exchange, divorce, estate, relocation)? That informs how much negotiation room exists.
- The area grade is low — what's the realistic commute time and amenity access for the typical tenant pool here? Any planned neighborhood developments (good or bad) we should know about?
- What's the average days-on-market for RENTAL listings here right now (not sales)? A rising rental-DOM trend means longer vacancies and softer asking-rent achievability than the comps imply.
- What's the recent tenant-quality profile in this submarket — average credit score on applications, eviction rate, late-payment / NSF rate, and stable-employment percentage? A property-management company in the area should have these aggregated.
- How much new for-sale + rental construction is in the pipeline within 1–3 miles? Heavy new supply typically softens prices + rents 12–24 months out; constrained supply supports both.
Investment metrics
- 1% rule
- 0.81% ✗
- Cap rate
- 6.22%
- Cash-on-cash
- -0.25%
- DSCR
- 0.99
- GRM
- 10.2
CMA / ARV
No comps found within radius.
Projected returns pro-forma
-0.01% appreciation · 3.0% rent growth · sell at horizon
- IRR
- -2.5%
- Equity multiple
- 0.88×
- Total profit
- $-5,872
- Equity at exit
- $50,727
- IRR
- 3.2%
- Equity multiple
- 1.34×
- Total profit
- $16,825
- Equity at exit
- $60,907
Cash invested: $49,000 (down + closing). Projections, not guarantees.
Landlord ↔ Tenant lean methodology
- Overall (STATE)
- 90 Strongly Landlord-Friendly
- State Mississippi
- 90 Strongly Landlord-Friendly · R+11
- County
- — inherits STATE
- City
- — inherits STATE
ZIP-level market 38635
- Home prices YoY
- -0.0%
- Active inventory
- 147
- Price-to-rent
- 10.2×
Monthly cashflow live
- Estimated rent
- $1,426 medium interval (Pro) →
- Mortgage (P&I)
- −$918
- Tax from tax record
- −$146 /mo · $1,751/yr
- Insurance
- −$73
- HOA
- −$0
- Vacancy / Maint / Mgmt
- −$299
- Net cashflow
- $-10
Break-even live
Sensitivity live
| Price | -10% $89 | -5% $39 | +0% $-10 | +5% $-60 | +10% $-109 |
|---|---|---|---|---|---|
| Rent | -10% $-123 | -5% $-66 | +0% $-10 | +5% $46 | +10% $102 |
| Rate | -1.0pp $78 | -0.5pp $34 | base $-10 | +0.5pp $-56 | +1.0pp $-102 |
UW: 25.0% down · 7.5% · 30yr · 1.5% tax · 5.0% vac · 8.0% maint · 8.0% mgmt
Financing live
Cash to close
- Down payment
- $43,750
- Closing costs
- $5,250
- Reserves months
- —
- Total cash needed
- —
Loan-product check · same deal, 3 products live
Conventional
25% down · 7.5% · 30yr
- Down + closing
- —
- Monthly P&I
- —
- Monthly cashflow
- —
- DSCR
- —
- Eligible?
- —
Personal DTI + credit; lowest rate.
DSCR
20% down · 8.5% · 30yr
- Down + closing
- —
- Monthly P&I
- —
- Monthly cashflow
- —
- DSCR
- —
- Eligible?
- —
No personal income docs; deal must DSCR.
Hard money
10% down · 12.0% · 12mo
- Down + closing
- —
- Monthly P&I
- —
- Monthly cashflow
- —
- DSCR
- —
- Eligible?
- —
Short-term bridge; refi at stabilization.
Listing history 6 events
-
2026-06-21days on market $175,000 Active 15 DOM
-
2026-06-18days on market $175,000 Active 12 DOM
-
2026-06-17days on market $175,000 Active 11 DOM
-
2026-06-16days on market $175,000 Active 10 DOM
-
2026-06-15statusdays on market $175,000 Active 9 DOM
-
2026-05-16$175,000 Active
ⓘ Source: listings_history table (triggers on properties + properties_extension) + one-shot
backfill from property_details.listing_events for pre-trigger history.
Tax reassessment forecast MS · Resets to sale price
- Current annual tax
- $1,751 · $146/mo
- Projected year-2 tax
- $1,751 · $146/mo
- Expected delta
- $0/yr ($0/mo · -0.0%)
ⓘ Screening estimate from a state-policy table — verify with the county assessor before closing.
Climate risk First Street
- Flood 1/10 Low FEMA zone X (unshaded) · 0% chance over 30 yrs
- Wildfire 4/10 Moderate
- Heat 6/10 Major 7 d/yr ≥108°F today · 21 d/yr by 30 yrs out
- Wind 4/10 Moderate 18% chance of damaging wind over 30 yrs
- Air quality 2/10 Low 2 unhealthy d/yr today · 2 by 30 yrs out
Nearby sold comps map
Loading sold comps map…
Walkable amenities ~0.75 mi
Loading nearby amenities…
Taxation est. · year 1
- Rental income
- $17,110
- − Mortgage interest
- −$9,803
- − Property taxes
- −$1,751
- − Insurance
- −$875
- − Repairs & maintenance
- −$1,369
- − Management
- −$1,369
- − Depreciation
- −$5,091
- Taxable loss
- −$3,147
- Est. tax savings @ 24.0%
- +$755
- After-tax cash flow
- $633/yr
For passive investors: Depreciation is non-cash, so a rental often shows a tax loss while cash-flowing — sheltering income. Rental losses are passive: they offset passive income freely, and up to $25,000/yr can offset ordinary (W-2) income if you actively participate and your MAGI is under $100k (phasing out to $0 by $150k); unused losses carry forward. On sale, claimed depreciation is recaptured at up to 25%, and gains may owe capital-gains tax (a 1031 exchange can defer both). Figures are a year-1 estimate at your 24.0% rate — not tax advice; consult a CPA.
Schools (NCES district)
- District
- Marshall County School District
- NCES district ID
- 2802850
- Math proficiency
- 18% ▼ -14.00%
- Reading proficiency
- 25% ▼ -8.00%
- Median HH income
- $39,333
- Composite
- 18.11/100
- National rank
- #8970
- State rank
- #87 of 130 in MS
Livability — Mount Pleasant
No livability data for this city. (Only ~50 U.S. cities are tracked.)
Census & demographics
- Population (ZIP)
- 15,312
Population outlook (Marshall County) Hauer SSP2
- Today (2025)
- 33,542 people
- By 2030
- 31,983 · -4.6%
- By 2040
- 28,556 · -14.9%
- By 2050
- 25,352 · -24.4%
- By 2075
- 20,032 · -40.3%
- By 2100
- 16,738 · -50.1%
Race, ethnicity, and origin ACS 2023
- Neighborhood character
- Majority Black (64%)
- Race & ethnicity
- Black 64% White 29% Two or more races 5%
- Common ancestry
- Serbian 1% English 1%
- Foreign-born
- 3%
- Languages at home
- 97% English-only · Spanish 1%
Political lean MEDSL · Marshall
- 2024 margin
- Lean R (+7.3) · D 46.0% · R 53.2%
- 2008→2024 swing
- -25.5pp toward R · 2008: 18.2pp · 2024: -7.3pp
- All cycles
- 2024: R+7.3 2020: D+3.1 2016: D+9.7 2012: D+19.4 2008: D+18.2
Not yet ingested
- Civics
- —
Market trends
- HPI YoY
- ▬ -0.01%
- Current HPI
- 245.68
- Rent YoY
- —
- Metro
- —
- State GDP YoY
- —
- F500 in state
- 0
Price history
1 event — show timeline
- 2026-05-16 Listed $175,000 MLSU
Property tax history
+51.0%/yrLatest (2025): $1,751 · +1794.7% YoY. Source: county tax records.
Cash-flow waterfall
monthlySold comps — $/sqft
last 12 mo · ≤1 miLoading sold comps…