 🏗️ New Construction
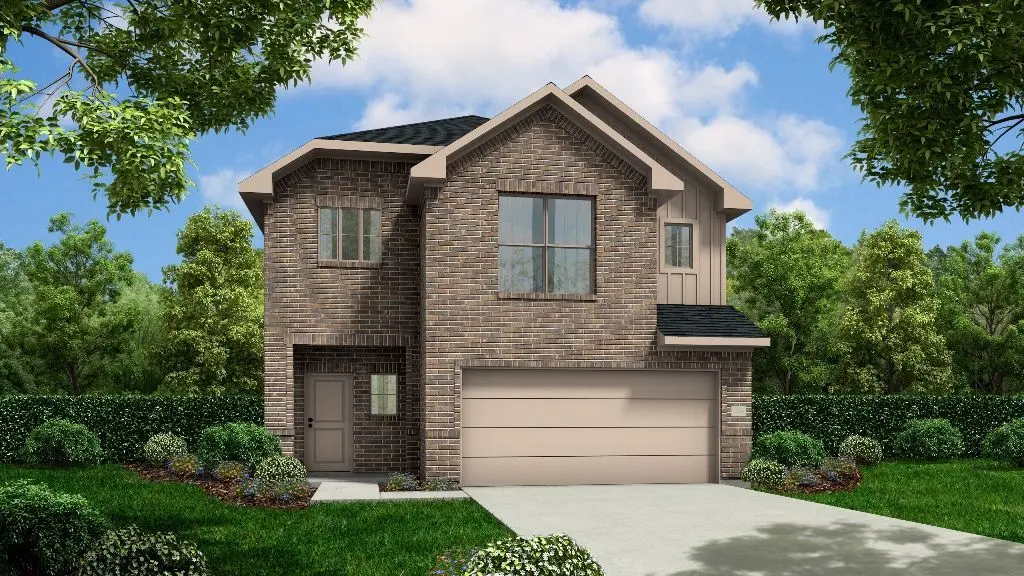
The Oriole Plan · Magnolia, TX
Flood risk No data
- FEMA flood zone
- —
- Chance of flooding over 30 yrs
- —
- Est. flood insurance / yr
- —
Fire risk No data
- Est. fire insurance / yr
- —
Heat risk No data
- Hot days now (above threshold)
- —
- Hot days in 30 yrs
- —
Wind risk No data
- Chance of severe wind over 30 yrs
- —
Air-quality risk No data
- Unhealthy air days now
- —
- Unhealthy air days in 30 yrs
- —
Risk factors via First Street. Map © Google.
Why this score? — see what drove the D grade
The composite is a weighted blend of 9 inputs, each scored 0–100. Each bar is that input's sub-score; the figure is the points it added to the 100-point composite (weight × sub-score).
- Appreciation +10.0/10.0
- Cash flow +7.7/30.0
- ARV discount +7.5/15.0
- Condition / age +4.8/5.0
- Schools +3.9/10.0
- Livability +3.7/5.0
- Rent growth +2.6/5.0
- 1% rule +2.3/10.0
- DSCR +1.8/10.0
$274,990
🖨 Deal sheet 📄 Offer letter ✓ Due diligence
Listing remarks MLS
The beautiful Oriole plan makes great use of space with all bedrooms situated on the second floor leaving the first floor open for the whole family. The formal entryway leads into the spacious family room that also opens to the breezy kitchen/dining area. The generous second story game room is the perfect play space for adults and kids alike and can be converted into a fourth bedroom. A private third bathroom on the second floor extends the third bedroom and creates a second en-suite, if desired. Choose from two different sized covered patios for all of your outdoor gatherings.
Key facts
- 2 garage spots
- Listed 918 days
Neighborhood map
What this means for you Summary
Snapshot
- This is a 3-bed/2.5-bath single-family listed at $275k. Condition is rated excellent.
Deal economics
- At list price, monthly cash flow is $-370 ($-4k/yr) — negative.
- To cash-flow at today's rent, offer at most $272k (1.2% below list).
- To meet the 1% rule (rent ≥ 1% of price), the offer needs to be $238k (13.5% below list).
- Recommended offer: $238k (13.5% below list) — sets the bar for 1% rule.
- Cap rate 4.9% vs local median 3.4% in Magnolia — top-decile yield for the area; either an underpriced asset or a hidden risk that comps aren't pricing in. Stress-test before assuming the spread holds.
Location & tenants
- Location reads 73/100 on livability (#222 in TX) — a middle-class / working-renter tenant base. Strengths: crime A+, cost of living A+, housing A+; Watch: schools D+, amenities F, commute F.
- Magnolia ISD (rural): math 42% / reading 45% proficiency, ranked #247 of 826 in TX (top 30%) — families likely to look elsewhere, expect single-tenant / working-renter base with shorter leases.
- Market conditions: Rents flat; 1604 active listings in the ZIP; 7 comparable units currently listed for rent nearby; rentals at typical pace (median 25d on market — plan ~3-4 weeks tenant-placement turnaround); 43% of comp listings sitting > 30 days — soft ceiling on asking rent; high-income renter base; 13,259 units permitted in Montgomery County in 2024 (1,402 in 5+ unit buildings).
Forward outlook
- In year one you build about $35k of equity ($2k loan paydown + $33k appreciation (10.0% local appreciation)).
- Montgomery County population projected at +65% by 2050 — long-run rental-demand tailwind backs the buy-and-hold thesis.
- By year 2, paydown + projected appreciation supports a ~$56k cash-out refi (75% LTV) — recoverable capital for the next deal without selling this one.
Negotiation context
- It's been on market 919 days — a 12% lower offer ($242k) is reasonable based on typical stale-listing flexibility.
Questions for the listing agent
- What do current leases actually rent for vs. the listed asking? Can we see a recent rent roll and the last 12 months of T-12 income?
- It's been on market 919 days. Have you received any prior offers? Is the seller open to a 14% concession, seller financing, or rate buy-down credit?
- Why hasn't it sold? Are there any deal-killer items the seller is aware of (foundation, flood, title, zoning, code violations)?
- Is there a deadline driving the sale (1031 exchange, divorce, estate, relocation)? That informs how much negotiation room exists.
- Schools are D-rated, which usually means shorter tenancies and higher turnover. Who's the typical renter profile here, and what's been the actual vacancy rate?
- The area grade is low — what's the realistic commute time and amenity access for the typical tenant pool here? Any planned neighborhood developments (good or bad) we should know about?
- What's the average days-on-market for RENTAL listings here right now (not sales)? A rising rental-DOM trend means longer vacancies and softer asking-rent achievability than the comps imply.
- What's the recent tenant-quality profile in this submarket — average credit score on applications, eviction rate, late-payment / NSF rate, and stable-employment percentage? A property-management company in the area should have these aggregated.
- How much new for-sale + rental construction is in the pipeline within 1–3 miles? Heavy new supply typically softens prices + rents 12–24 months out; constrained supply supports both.
Investment metrics
- 1% rule
- 0.73% ✗
- Cap rate
- 4.93%
- Cash-on-cash
- -4.87%
- DSCR
- 0.78
- GRM
- 11.4
CMA / ARV
- ARV (median comp)
- $325,238
- List price
- $274,990
- Delta
- -15.45%
- Verdict
- UNDERPRICED
- Comps
- 20 within 1.0 mi
Show comp detail 12 sales within ~0.75 mi
| Address | Dist | Beds/Ba | Sqft | Sold | Price | $/sf | Match |
|---|---|---|---|---|---|---|---|
| 15206 N Heron Heights Way | 0.21mi | 4/3.0 (+1) | 1,997 (-3%) | 1mo | $335,000 | $168 | 77 |
| 40734 Barley Straw Dr | 0.31mi | 4/3.0 (+1) | 2,041 (-1%) | 0mo | $314,990 | $154 | 76 |
| 14707 Band Tailed Pigeon Ct | 0.30mi | 3/2.0 | 1,984 (-4%) | 6mo | $394,900 | $199 | 73 |
| 14910 Slough View Ct | 0.39mi | 4/3.0 (+1) | 2,049 (-1%) | 6mo | $452,900 | $221 | 69 |
| 14898 Whistling Duck Ln | 0.33mi | 4/3.0 (+1) | 1,942 (-6%) | 5mo | $369,900 | $190 | 63 |
| 14735 Band Tailed Pigeon Ct | 0.35mi | 4/3.0 (+1) | 2,180 (+6%) | 5mo | $399,900 | $183 | 63 |
| 15307 Mountain Plover Pl | 0.71mi | 4/2.5 (+1) | 2,064 (+0%) | 1mo | $314,900 | $153 | 61 |
| 15443 Park Perch Pl | 0.69mi | 4/2.5 (+1) | 2,064 (+0%) | 2mo | $327,900 | $159 | 61 |
| 15459 Park Perch Pl | 0.73mi | 4/2.5 (+1) | 2,061 (-0%) | 2mo | $309,990 | $150 | 60 |
| 15019 Baikal Teal Ter | 0.65mi | 3/2.0 | 1,931 (-6%) | 0mo | $317,900 | $165 | 57 |
| 14522 Montclair Way | 0.67mi | 4/2.5 (+1) | 2,261 (+10%) | 2mo | $285,000 | $126 | 46 |
| 14805 Prickly Pear Cv | 0.75mi | 4/2.0 (+1) | 1,934 (-6%) | 3mo | $295,000 | $153 | 46 |
Match score weights: distance 35% · size 25% · config 20% · recency 20%. Top-matched comps best support the ARV.
Projected returns pro-forma
10.0% appreciation · 0.32% rent growth · sell at horizon
- IRR
- 20.1%
- Equity multiple
- 2.62×
- Total profit
- $147,386
- Equity at exit
- $293,000
- IRR
- 17.8%
- Equity multiple
- 5.85×
- Total profit
- $441,279
- Equity at exit
- $631,866
Cash invested: $91,067 (down + closing). Projections, not guarantees.
Landlord ↔ Tenant lean methodology
- Overall (STATE)
- 87 Strongly Landlord-Friendly
- State Texas
- 87 Strongly Landlord-Friendly · R+5
- County
- — inherits STATE
- City
- — inherits STATE
ZIP-level market 77354
- Home prices YoY
- 2.4%
- Rents YoY
- 0.3%
- Active inventory
- 1604
- Price-to-rent
- 9.6×
Monthly cashflow live
- Estimated rent
- $2,377 high interval (Pro) →
- Mortgage (P&I)
- −$1,706
- Tax est. 1.5%
- −$407 /mo · $4,879/yr
- Insurance
- −$136
- HOA
- −$0
- Vacancy / Maint / Mgmt
- −$499
- Net cashflow
- $-370
Break-even live
UW: 25.0% down · 7.5% · 30yr · 1.5% tax · 5.0% vac · 8.0% maint · 8.0% mgmt
Financing live
Cash to close
- Down payment
- $81,309
- Closing costs
- $9,757
- Reserves months
- —
- Total cash needed
- —
Loan-product check · same deal, 3 products live
Conventional
25% down · 7.5% · 30yr
- Down + closing
- —
- Monthly P&I
- —
- Monthly cashflow
- —
- DSCR
- —
- Eligible?
- —
Personal DTI + credit; lowest rate.
DSCR
20% down · 8.5% · 30yr
- Down + closing
- —
- Monthly P&I
- —
- Monthly cashflow
- —
- DSCR
- —
- Eligible?
- —
No personal income docs; deal must DSCR.
Hard money
10% down · 12.0% · 12mo
- Down + closing
- —
- Monthly P&I
- —
- Monthly cashflow
- —
- DSCR
- —
- Eligible?
- —
Short-term bridge; refi at stabilization.
Rent comps 7 comps
| Address | Beds | Baths | Sqft | Rent | $/sqft | DOM | Units | Dist |
|---|---|---|---|---|---|---|---|---|
| 39899 Mill Creek Rd Magnolia, TX | 1.0–3.0 | 1.0–2.0 | 1104 | $2,726 | $2.47 | 1d | 40 | 0.05mi |
| 40547 Berylline Ln Magnolia, TX | 4.0 | 2.0 | 1753 | $2,300 | $1.31 | 44d | 1 | 0.16mi |
| 40558 Berylline Ln Unit NA Magnolia, TX | 3.0 | 2.0 | 1499 | $2,150 | $1.43 | 24d | 1 | 0.18mi |
| 14727 Band Tailed Pigeon Ct Magnolia, TX | 4.0 | 3.0 | 1942 | $2,700 | $1.39 | 44d | 1 | 0.32mi |
| 14983 Clay Harvest Rdg Magnolia, TX | 4.0 | 3.0 | 2173 | $2,375 | $1.09 | 44d | 1 | 0.83mi |
| 15128 Lavender Mist Ct Magnolia, TX | 4.0 | 3.0 | 2561 | $2,800 | $1.09 | 20d | 1 | 1.02mi |
| 948 Oak Mist Ln Magnolia, TX | 3.0 | 2.0 | 1470 | $2,000 | $1.36 | 24d | 1 | 1.45mi |
Listing history 15 events
-
2026-06-18days on market $274,990 Active 919 DOM
-
2026-06-17days on market $274,990 Active 918 DOM
-
2026-06-16days on market $274,990 Active 917 DOM
-
2026-06-15days on market $274,990 Active 916 DOM
-
2026-06-13days on market $274,990 Active 914 DOM
-
2026-06-09days on market $274,990 Active 910 DOM
-
2026-06-08days on market $274,990 Active 909 DOM
-
2026-06-07days on market $274,990 Active 908 DOM
-
2026-06-04days on market $274,990 Active 905 DOM
-
2026-06-03days on market $274,990 Active 904 DOM
-
2026-06-02days on market $274,990 Active 903 DOM
-
2026-06-01days on market $274,990 Active 902 DOM
-
2026-05-31days on market $274,990 Active 901 DOM
-
2024-03-04price $274,990 584-char remark
Show marketing remark (584 chars)
The beautiful Oriole plan makes great use of space with all bedrooms situated on the second floor leaving the first floor open for the whole family. The formal entryway leads into the spacious family room that also opens to the breezy kitchen/dining area. The generous second story game room is the perfect play space for adults and kids alike and can be converted into a fourth bedroom. A private third bathroom on the second floor extends the third bedroom and creates a second en-suite, if desired. Choose from two different sized covered patios for all of your outdoor gatherings.
-
2023-12-13$269,990 Active 584-char remark
Show marketing remark (584 chars)
The beautiful Oriole plan makes great use of space with all bedrooms situated on the second floor leaving the first floor open for the whole family. The formal entryway leads into the spacious family room that also opens to the breezy kitchen/dining area. The generous second story game room is the perfect play space for adults and kids alike and can be converted into a fourth bedroom. A private third bathroom on the second floor extends the third bedroom and creates a second en-suite, if desired. Choose from two different sized covered patios for all of your outdoor gatherings.
ⓘ Source: listings_history table (triggers on properties + properties_extension) + one-shot
backfill from property_details.listing_events for pre-trigger history.
Nearby sold comps map
Loading sold comps map…
Walkable amenities ~0.75 mi
Loading nearby amenities…
Taxation est. · year 1
- Rental income
- $28,527
- − Mortgage interest
- −$18,218
- − Property taxes
- −$4,879
- − Insurance
- −$1,626
- − Repairs & maintenance
- −$2,282
- − Management
- −$2,282
- − Depreciation
- −$9,461
- Taxable loss
- −$10,222
- Est. tax savings @ 24.0%
- +$2,453
- After-tax cash flow
- $-1,982/yr
For passive investors: Depreciation is non-cash, so a rental often shows a tax loss while cash-flowing — sheltering income. Rental losses are passive: they offset passive income freely, and up to $25,000/yr can offset ordinary (W-2) income if you actively participate and your MAGI is under $100k (phasing out to $0 by $150k); unused losses carry forward. On sale, claimed depreciation is recaptured at up to 25%, and gains may owe capital-gains tax (a 1031 exchange can defer both). Figures are a year-1 estimate at your 24.0% rate — not tax advice; consult a CPA.
Condition & rehab AI · 7 photos
This home is in excellent condition with no visible repairs needed. It offers a great layout and curb appeal, making it an excellent investment for both resale and rental.
Value-add opportunities
- Both Paint exterior and interior — Enhances curb appeal and interior aesthetics
- Both Replace landscaping with drought-tolerant plants — Reduces maintenance and enhances curb appeal
- Both Install smart home security system — Improves safety and adds modern amenities
Renovation cost estimate screening
Value-add ROI direction
- Both Paint exterior and interior — Enhances curb appeal and interior aesthetics ↑
- Both Replace landscaping with drought-tolerant plants — Reduces maintenance and enhances curb appeal ↑
- Both Install smart home security system — Improves safety and adds modern amenities ↑
ⓘ Cost ranges are severity-bucket heuristics (US national rule-of-thumb). Get contractor quotes + a written scope before underwriting a rehab budget.
Schools (NCES district)
- District
- Magnolia ISD
- NCES district ID
- 4828740
- Math proficiency
- 42% ▼ -7.00%
- Reading proficiency
- 45% ▼ -4.00%
- Median HH income
- $71,692
- Composite
- 39.46/100
- National rank
- #3958
- State rank
- #247 of 826 in TX
Livability — Magnolia
- Score
- 73/100
- State rank
- #222
- US rank
- #5442
Category grades
Schools grade is shown separately in the Schools card above.
Census & demographics
- County
- Montgomery County · 663,713 people
- City population
- 32,847
- Metro
- Houston-The Woodlands-Sugar Land, TX
- Population (ZIP)
- 44,900
- Household income
- $112,504
- Rent vs Own
- Severe rent burden
- 586.0
Population outlook (Montgomery County) Hauer SSP2
- Today (2025)
- 713,896 people
- By 2030
- 805,263 · +12.8%
- By 2040
- 992,708 · +39.1%
- By 2050
- 1,179,590 · +65.2%
- By 2075
- 1,628,084 · +128.1%
- By 2100
- 1,937,880 · +171.5%
Race, ethnicity, and origin ACS 2023
- Neighborhood character
- Predominantly White (66%)
- Race & ethnicity
- White 66% Hispanic / Latino 25% Two or more races 18% Black 3% Asian 1%
- Hispanic origin (detail)
- Mexican 14% Puerto Rican 1%
- Common ancestry
- Lithuanian 4% Slovak 2% Italian 2%
- Foreign-born
- 11% · Canada, Vietnam
- Languages at home
- 83% English-only · Spanish 15% Other Indo-European 1% German/W. Germanic 1%
Political lean MEDSL · Montgomery
- 2024 margin
- Solid R (+45.5) · D 26.8% · R 72.3%
- 2008→2024 swing
- +7.2pp toward D · 2008: -52.7pp · 2024: -45.5pp
- All cycles
- 2024: R+45.5 2020: R+43.8 2016: R+51.4 2012: R+60.7 2008: R+52.7
Not yet ingested
- Civics
- —
Market trends
- HPI YoY
- ▲ 12.09%
- Current HPI
- 512.87
- Rent YoY
- ▲ 0.32%
- Metro
- Houston-The Woodlands-Sugar Land, TX
- State GDP YoY
- ▲ 3.95%
- F500 in state
- 110
Industry mix (Fortune 500 HQ in TX)
| Industry | F500 HQs | Revenue |
|---|---|---|
| Energy | 16 | $1,198B |
|
||
| Technology | 5 | $198B |
|
||
| Engineering / Construction | 4 | $72B |
|
||
| Energy Services | 3 | $60B |
|
||
| Utilities | 3 | $41B |
|
||
| Healthcare | 2 | $330B |
|
||
Price history
+1.9% since first listed2 events — show timeline
- 2024-03-04 Price Changed $274,990 Zillow
- 2023-12-13 Listed $269,990 Zillow
Cash-flow waterfall
monthlySold comps — $/sqft
last 12 mo · ≤1 miLoading sold comps…