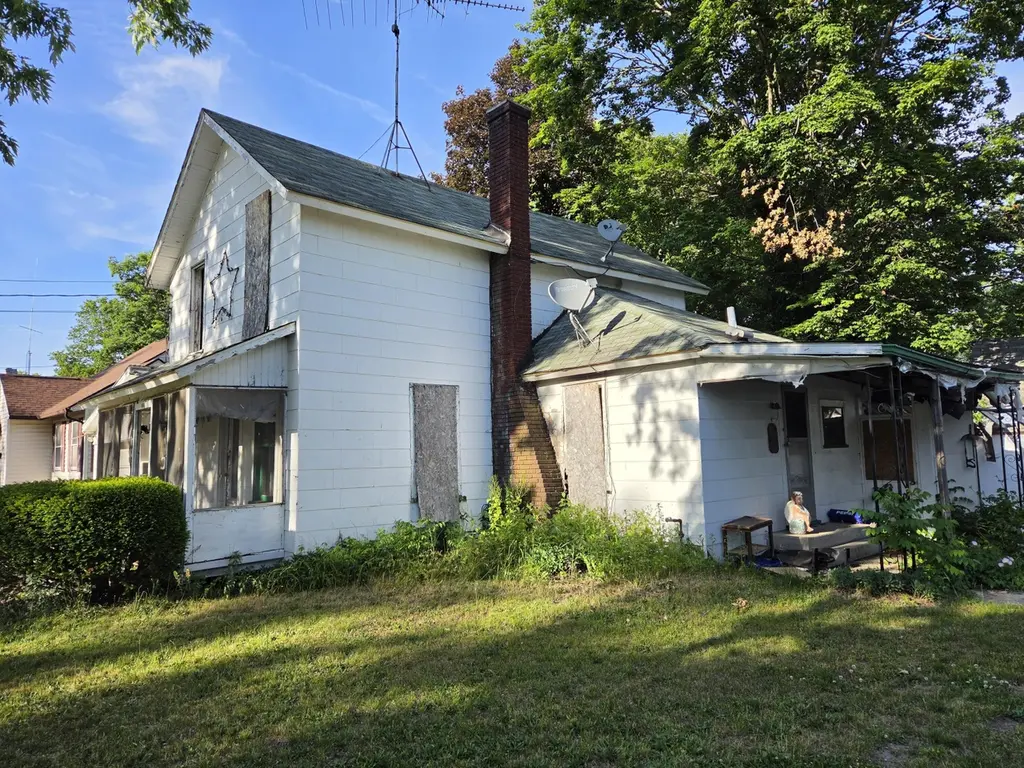
404 Mcomber St · Dowagiac, MI
Flood risk 1/10 · Minimal
- FEMA flood zone
- X (unshaded)
- Chance of flooding over 30 yrs
- 0.0%
- Est. flood insurance / yr
- $473 – $860
Fire risk 1/10 · Minimal
- Est. fire insurance / yr
- $784 – $1,456
Heat risk 2/10 · Minimal
- Hot days now (above 99°F)
- 7 days/yr
- Hot days in 30 yrs
- 16 days/yr
Wind risk 2/10 · Minimal
- Chance of severe wind over 30 yrs
- —
Air-quality risk 2/10 · Minimal
- Unhealthy air days now
- 1 days/yr
- Unhealthy air days in 30 yrs
- 2 days/yr
Risk factors via First Street. Map © Google.
Why this score? — see what drove the D grade
The composite is a weighted blend of 9 inputs, each scored 0–100. Each bar is that input's sub-score; the figure is the points it added to the 100-point composite (weight × sub-score).
- Cash flow +15.0/30.0
- ARV discount +7.5/15.0
- 1% rule +5.0/10.0
- DSCR +5.0/10.0
- Livability +3.6/5.0
- Rent growth +2.5/5.0
- Condition / age +2.5/5.0
- Schools +2.1/10.0
- Appreciation +0.0/10.0
$20,000
🖨 Deal sheet 📄 Offer letter ✓ Due diligence
Listing remarks MLS
Rehab project or raze and rebuild 1.5 story house in Dowagiac that endured fire damage. House is situated on a 69' X 61' lot and utilizes public water & sewer. May be a good fit for CASH buyers' next rehab project. Close to schools, restaurants, employment, and Southwestern Michigan College.
Key facts
- Close to schools
- Close to restaurants
- Public sewer
Tags
Property features AI
Exterior
- Parking: Attached garage (1-car)
- Utilities: Public water
- Home design: Traditional single-family home; One or more stories (exact count not provided); Built in 1930
- Construction: Wood siding; Asphalt roof; Crawl space/partial basement
- Exterior features: Paved road access; Lot approximately 0.1 acre
Interior
- Kitchen: Kitchen
- Bedrooms: Primary bedroom; Secondary bedroom; Third bedroom
- Bathrooms: One full bathroom (primary bathroom listed)
- Interior features: Six total rooms; Crawl space/partial basement
Neighborhood map
What this means for you Summary
Snapshot
- This is a 3-bed/1.0-bath single-family listed at $20k.
Deal economics
- At list price, monthly cash flow is $961 ($12k/yr) — positive.
- The deal already cash-flows at list — no discount required.
- Meets the 1% rule at list price ($1k rent vs $20k).
- Cap rate 63.9% vs local median 4.8% in Dowagiac — top-decile yield for the area; either an underpriced asset or a hidden risk that comps aren't pricing in. Stress-test before assuming the spread holds.
Location & tenants
- Location reads 72/100 on livability (#243 in MI) — a middle-class / working-renter tenant base. Strengths: cost of living A+, housing A+, health & safety A+; Watch: commute D, schools F, crime F.
- Dowagiac Union School District (town): math 19% / reading 31% proficiency, ranked #430 of 540 in MI (top 80%) — low school quality limits family demand, transient renter base, plan for 1-2y turnover; 66% free/reduced lunch — lower-income household profile, screen leases tightly.
- Market conditions: 85 active listings in the ZIP; 128 units permitted in Cass County in 2024 (0 in 5+ unit buildings).
Forward outlook
- Local home prices are declining (-3.0%/yr); year-one equity from $138 of loan paydown is wiped out by about $600 of value loss. Plan a longer hold.
- Cass County population projected at -20% by 2050 — secular population decline; favor cash flow + early exit over multi-decade hold.
- At projected returns (-3.0% appreciation + 3.0% rent growth), your $6k cash investment doubles in ~1 year — after that, you're playing with house money.
Negotiation context
- Only 5 days on market — expect competitive offers; lowballing is unlikely to land.
- 3 sale attempts with the ask held roughly flat each time — persistent listings suggest the price (not the market) is what's stuck; bring a comps-based counter.
Risks & watch-outs
- Watch-outs: property tax is 2.8% of price; built in 1930 — expect roof / HVAC / electrical / plumbing capex.
Questions for the listing agent
- Built in 1930 — when were the roof, HVAC, electrical panel, plumbing, and water heater last replaced?
- Property tax is high relative to price — has the assessment been appealed recently, and will the sale trigger a re-assessment?
- Is there a deadline driving the sale (1031 exchange, divorce, estate, relocation)? That informs how much negotiation room exists.
- Schools are F-rated, which usually means shorter tenancies and higher turnover. Who's the typical renter profile here, and what's been the actual vacancy rate?
- Crime grade is F in this area — have there been break-ins, vandalism, or insurance claims at this property in the last 3 years? What carrier currently insures it and at what premium?
- The area grade is low — what's the realistic commute time and amenity access for the typical tenant pool here? Any planned neighborhood developments (good or bad) we should know about?
- What's the average days-on-market for RENTAL listings here right now (not sales)? A rising rental-DOM trend means longer vacancies and softer asking-rent achievability than the comps imply.
- What's the recent tenant-quality profile in this submarket — average credit score on applications, eviction rate, late-payment / NSF rate, and stable-employment percentage? A property-management company in the area should have these aggregated.
- How much new for-sale + rental construction is in the pipeline within 1–3 miles? Heavy new supply typically softens prices + rents 12–24 months out; constrained supply supports both.
Investment metrics
- 1% rule
- 7.09% ✓
- Cap rate
- 63.94%
- Cash-on-cash
- 205.87%
- DSCR
- 10.16
- GRM
- 1.2
CMA / ARV
- ARV (on-the-fly)
- $175,000
- Comps found
- 12
Show comp detail 12 sales within ~0.75 mi
| Address | Dist | Beds/Ba | Sqft | Sold | Price | $/sf | Match |
|---|---|---|---|---|---|---|---|
| 206 E Wayne St | 0.05mi | 3/1.0 | 1,320 (+6%) | 2mo | $102,000 | $77 | 87 |
| 406 Oak Street St | 0.21mi | 3/1.0 | 1,241 (-1%) | 8mo | $180,000 | $145 | 83 |
| 322 Oak St | 0.17mi | 3/1.0 | 1,286 (+3%) | 7mo | $151,000 | $117 | 81 |
| 706 N Front St | 0.24mi | 3/1.0 | 1,376 (+10%) | 5mo | $193,000 | $140 | 68 |
| 315 Mcomber St | 0.08mi | 2/1.0 (-1) | 1,072 (-14%) | 2mo | $42,000 | $39 | 66 |
| 55146 M 51 N | 0.44mi | 2/1.0 (-1) | 1,188 (-5%) | 9mo | $185,500 | $156 | 59 |
| 403 Orchard St | 0.23mi | 4/2.0 (+1) | 1,391 (+11%) | 7mo | $230,000 | $165 | 55 |
| 414 E Division St | 0.49mi | 3/2.0 | 1,152 (-8%) | 8mo | $185,000 | $161 | 53 |
| 517 Colby St | 0.65mi | 3/1.0 | 1,152 (-8%) | 4mo | $180,000 | $156 | 53 |
| 703 Main St | 0.75mi | 3/1.5 | 1,400 (+12%) | 4mo | $138,500 | $99 | 40 |
| 104 S Lowe St | 0.75mi | 3/1.0 | 1,394 (+12%) | 9mo | $157,999 | $113 | 39 |
| 527 Main St | 0.67mi | 4/2.0 (+1) | 1,409 (+13%) | 2mo | $159,000 | $113 | 37 |
Match score weights: distance 35% · size 25% · config 20% · recency 20%. Top-matched comps best support the ARV.
Projected returns pro-forma
-3.0% appreciation · 3.0% rent growth · sell at horizon
- IRR
- —
- Equity multiple
- 11.35×
- Total profit
- $57,982
- Equity at exit
- $2,982
- IRR
- —
- Equity multiple
- 24.11×
- Total profit
- $129,420
- Equity at exit
- $1,729
Cash invested: $5,600 (down + closing). Projections, not guarantees.
Landlord ↔ Tenant lean methodology
- Overall (STATE)
- 62 Landlord-Friendly
- State Michigan
- 62 Landlord-Friendly · EVEN
- County
- — inherits STATE
- City
- — inherits STATE
ZIP-level market 49047
- Active inventory
- 85
- Price-to-rent
- 1.2×
Monthly cashflow live
- Estimated rent
- $1,418 medium interval (Pro) →
- Mortgage (P&I)
- −$105
- Tax from tax record
- −$46 /mo · $556/yr
- Insurance
- −$8
- HOA
- −$0
- Vacancy / Maint / Mgmt
- −$298
- Net cashflow
- $961
Break-even live
UW: 25.0% down · 7.5% · 30yr · 1.5% tax · 5.0% vac · 8.0% maint · 8.0% mgmt
Financing live
Cash to close
- Down payment
- $5,000
- Closing costs
- $600
- Reserves months
- —
- Total cash needed
- —
Loan-product check · same deal, 3 products live
Conventional
25% down · 7.5% · 30yr
- Down + closing
- —
- Monthly P&I
- —
- Monthly cashflow
- —
- DSCR
- —
- Eligible?
- —
Personal DTI + credit; lowest rate.
DSCR
20% down · 8.5% · 30yr
- Down + closing
- —
- Monthly P&I
- —
- Monthly cashflow
- —
- DSCR
- —
- Eligible?
- —
No personal income docs; deal must DSCR.
Hard money
10% down · 12.0% · 12mo
- Down + closing
- —
- Monthly P&I
- —
- Monthly cashflow
- —
- DSCR
- —
- Eligible?
- —
Short-term bridge; refi at stabilization.
Listing history 5 events
-
2026-06-13statusdays on market $20,000 Pending 5 DOM
-
2026-06-12remarks 400-char remark
-
2026-06-12days on market $20,000 Active 4 DOM
-
2026-06-09remarks 294-char remark
-
2026-06-09$20,000 Active 1 DOM
ⓘ Source: listings_history table (triggers on properties + properties_extension) + one-shot
backfill from property_details.listing_events for pre-trigger history.
Tax reassessment forecast MI · Partial reset (capped growth)
- Current annual tax
- $556 · $46/mo
- Projected year-2 tax
- $556 · $46/mo
- Expected delta
- $0/yr ($0/mo · 0.0%)
ⓘ Screening estimate from a state-policy table — verify with the county assessor before closing.
Climate risk First Street
- Flood 1/10 Low FEMA zone X (unshaded) · 0% chance over 30 yrs
- Wildfire 1/10 Low
- Heat 2/10 Low 7 d/yr ≥99°F today · 16 d/yr by 30 yrs out
- Wind 2/10 Low
- Air quality 2/10 Low 1 unhealthy d/yr today · 2 by 30 yrs out
Nearby sold comps map
Loading sold comps map…
Walkable amenities ~0.75 mi
Loading nearby amenities…
Taxation est. · year 1
- Rental income
- $17,016
- − Mortgage interest
- −$1,120
- − Property taxes
- −$556
- − Insurance
- −$100
- − Repairs & maintenance
- −$1,361
- − Management
- −$1,361
- − Depreciation
- −$582
- Taxable income
- $11,936
- Est. tax owed @ 24.0%
- −$2,865
- After-tax cash flow
- $8,664/yr
For passive investors: Depreciation is non-cash, so a rental often shows a tax loss while cash-flowing — sheltering income. Rental losses are passive: they offset passive income freely, and up to $25,000/yr can offset ordinary (W-2) income if you actively participate and your MAGI is under $100k (phasing out to $0 by $150k); unused losses carry forward. On sale, claimed depreciation is recaptured at up to 25%, and gains may owe capital-gains tax (a 1031 exchange can defer both). Figures are a year-1 estimate at your 24.0% rate — not tax advice; consult a CPA.
Schools (NCES district)
- District
- Dowagiac Union School District
- NCES district ID
- 2612150
- Math proficiency
- 19% ▼ -2.00%
- Reading proficiency
- 31% ▼ -1.00%
- Median HH income
- $39,741
- Composite
- 21.03/100
- National rank
- #8452
- State rank
- #430 of 540 in MI
Livability — Dowagiac
- Score
- 72/100
- State rank
- #243
- US rank
- #6087
Category grades
Schools grade is shown separately in the Schools card above.
Census & demographics
- Census place
- Dowagiac, MI
- Population (ZIP)
- 14,506
Population outlook (Cass County) Hauer SSP2
- Today (2025)
- 49,919 people
- By 2030
- 48,320 · -3.2%
- By 2040
- 44,230 · -11.4%
- By 2050
- 39,852 · -20.2%
- By 2075
- 31,440 · -37.0%
- By 2100
- 23,914 · -52.1%
Race, ethnicity, and origin ACS 2023
- Neighborhood character
- Predominantly White (81%)
- Race & ethnicity
- White 81% Hispanic / Latino 7% Two or more races 6% Black 6% Native American 2%
- Hispanic origin (detail)
- Mexican 7%
- Common ancestry
- Romanian 5% Iranian 2% Italian 2%
- Foreign-born
- 3% · Canada
- Languages at home
- 94% English-only · Spanish 4% German/W. Germanic 1%
Political lean MEDSL · Cass
- 2024 margin
- Solid R (+33.9) · D 32.5% · R 66.4% · Other 1.1%
- 2008→2024 swing
- -38.0pp toward R · 2008: 4.1pp · 2024: -33.9pp
- All cycles
- 2024: R+33.9 2020: R+28.9 2016: R+29.9 2012: R+13.7 2008: D+4.1
Not yet ingested
- Civics
- —
Market trends
- HPI YoY
- ▼ -188.04%
- Current HPI
- 186.2757
- Rent YoY
- —
- Metro
- —
- State GDP YoY
- ▲ 1.37%
- F500 in state
- 28
Industry mix (Fortune 500 HQ in MI)
| Industry | F500 HQs | Revenue |
|---|---|---|
| Automotive Parts | 3 | $48B |
|
||
| Automotive | 2 | $372B |
|
||
| Chemicals | 1 | $45B |
|
||
| Automotive Retail | 1 | $29B |
|
||
| Healthcare / Medical Devices | 1 | $23B |
|
||
| Automotive Technology | 1 | $20B |
|
||
Price history
+0.0% since first listed3 events — show timeline
- 2026-06-08 Listed $20,000 MiRealSource-MiMLS
- 2026-06-08 Listed $20,000 REALCOMP
- 2026-06-08 Listed $20,000 SW Michigan MLS
Property tax history
+0.1%/yrLatest (2025): $556 · -29.9% YoY. Source: county tax records.
Cash-flow waterfall
monthlySold comps — $/sqft
last 12 mo · ≤1 miLoading sold comps…