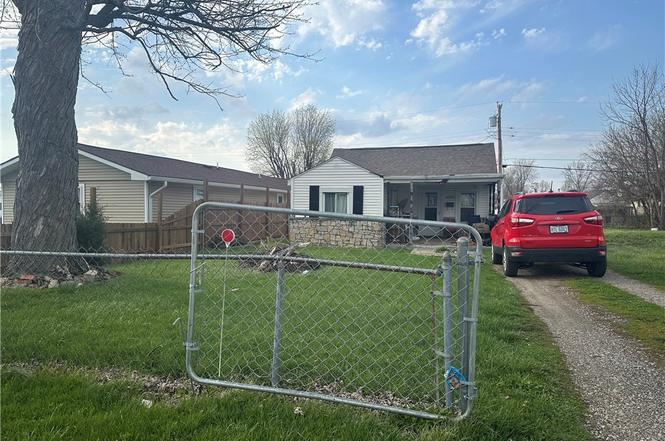
2627 Ome Ave · Dayton, OH
Flood risk 10/10 · Severe
- FEMA flood zone
- X (shaded)
- Chance of flooding over 30 yrs
- 0.99%
- Est. flood insurance / yr
- $507 – $1,088
Fire risk 1/10 · Minimal
- Est. fire insurance / yr
- $713 – $1,323
Heat risk 4/10 · Minor
- Hot days now (above 102°F)
- 7 days/yr
- Hot days in 30 yrs
- 18 days/yr
Wind risk 2/10 · Minimal
- Chance of severe wind over 30 yrs
- 0.0%
Air-quality risk 3/10 · Minor
- Unhealthy air days now
- 2 days/yr
- Unhealthy air days in 30 yrs
- 4 days/yr
Risk factors via First Street. Map © Google.
Why this score? — see what drove the A- grade
The composite is a weighted blend of 9 inputs, each scored 0–100. Each bar is that input's sub-score; the figure is the points it added to the 100-point composite (weight × sub-score).
- Cash flow +30.0/30.0
- ARV discount +15.0/15.0
- 1% rule +10.0/10.0
- DSCR +10.0/10.0
- Schools +5.0/10.0
- Rent growth +4.4/5.0
- Livability +3.2/5.0
- Condition / age +2.5/5.0
- Appreciation +0.0/10.0
$59,900
🖨 Deal sheet 📄 Offer letter ✓ Due diligence
Listing remarks
Discover the charm of Dayton living in this delightful single-family residence, offering a serene escape with immediate access to local conveniences. This inviting home is perfectly designed for comfortable living, presenting a wonderful opportunity for those seeking a harmonious blend of tranquility and accessibility. Experience the ease of a thoughtfully laid-out floor plan spanning 718 square feet, ensuring every space is utilized to its fullest potential. This property also presents an excellent opportunity for investors or those looking for a fixer-upper project to customize and add value. The exterior of this charming one-story abode enhances its appeal with both a welcoming porch and
Key facts
- Manageable acreage
- Functional patio
- Welcoming porch
Tags
Property features AI
Finance
- Financial info: Offered for sale
Exterior
- Parking: No garage
- Utilities: Natural gas heating; Central air conditioning
- Home design: Residential property
- Construction: Vinyl siding
- Exterior features: Partial fencing; Porch; Patio
Interior
- Kitchen: Kitchen on main level (15 x 13); Breakfast nook on main level (13 x 6)
- Bedrooms: Bedroom on second level (26 x 10)
- Bathrooms: 1 full bathroom (main level)
- Heating & cooling: Forced air heating (natural gas); Central air conditioning
- Interior features: Total of 5 rooms; Partial crawl space basement
Neighborhood map
What this means for you Summary
Snapshot
- This is a 2-bed/1.0-bath single-family listed at $60k.
Deal economics
- At list price, monthly cash flow is $307 ($4k/yr) — positive.
- The deal already cash-flows at list — no discount required.
- Meets the 1% rule at list price ($1k rent vs $60k).
- Recommended offer: $56k (6.0% below list) — sets the bar for market timing.
- Cap rate 13.8% vs local median 7.4% in Dayton — top-decile yield for the area; either an underpriced asset or a hidden risk that comps aren't pricing in. Stress-test before assuming the spread holds.
Location & tenants
- Location reads 65/100 on livability (#716 in OH) — a middle-class / working-renter tenant base. Strengths: cost of living A+, housing A+, health & safety A; Watch: schools C-, amenities C-, crime F.
- Market conditions: Rents rising fast (+7.4%/yr); 51 active listings in the ZIP; 9 comparable units currently listed for rent nearby; rentals at typical pace (median 24d on market — plan ~3-4 weeks tenant-placement turnaround); 44% of comp listings sitting > 30 days — soft ceiling on asking rent; 907 units permitted in Montgomery County in 2024 (416 in 5+ unit buildings).
Forward outlook
- Local home prices are declining (-3.0%/yr); year-one equity from $414 of loan paydown is wiped out by about $2k of value loss. Plan a longer hold.
- Montgomery County population projected at -10% by 2050 — secular population decline; favor cash flow + early exit over multi-decade hold.
- At projected returns (-3.0% appreciation + 7.4% rent growth), your $17k cash investment doubles in ~5 years — after that, you're playing with house money.
Negotiation context
- It's been on market 74 days — a 6% lower offer ($56k) is reasonable based on typical stale-listing flexibility.
- Current owner paid $44k; 38% above their basis — modest negotiation headroom, anchor on the comps not their cost.
Risks & watch-outs
- Watch-outs: flood insurance adds $66/mo; built in 1945 — expect roof / HVAC / electrical / plumbing capex.
- Climate carrying-cost: severe flood risk — expect insurance premiums to compound above CPI over the hold.
Questions for the listing agent
- It's been on market 74 days. Have you received any prior offers? Is the seller open to a 6% concession, seller financing, or rate buy-down credit?
- Built in 1945 — when were the roof, HVAC, electrical panel, plumbing, and water heater last replaced?
- What's the actual annual flood-insurance premium (NFIP or private), and is the property in a SFHA with mandatory coverage?
- Why hasn't it sold? Are there any deal-killer items the seller is aware of (foundation, flood, title, zoning, code violations)?
- Is there a deadline driving the sale (1031 exchange, divorce, estate, relocation)? That informs how much negotiation room exists.
- Crime grade is F in this area — have there been break-ins, vandalism, or insurance claims at this property in the last 3 years? What carrier currently insures it and at what premium?
- What's the average days-on-market for RENTAL listings here right now (not sales)? A rising rental-DOM trend means longer vacancies and softer asking-rent achievability than the comps imply.
- What's the recent tenant-quality profile in this submarket — average credit score on applications, eviction rate, late-payment / NSF rate, and stable-employment percentage? A property-management company in the area should have these aggregated.
- How much new for-sale + rental construction is in the pipeline within 1–3 miles? Heavy new supply typically softens prices + rents 12–24 months out; constrained supply supports both.
Investment metrics
- 1% rule
- 1.68% ✓
- Cap rate
- 13.77%
- Cash-on-cash
- 26.70%
- DSCR
- 2.19
- GRM
- 5.0
CMA / ARV
- ARV (on-the-fly)
- $89,750
- Comps found
- 5
Show comp detail 5 sales within ~0.75 mi
| Address | Dist | Beds/Ba | Sqft | Sold | Price | $/sf | Match |
|---|---|---|---|---|---|---|---|
| 2423 Ome Ave | 0.25mi | 2/1.0 | 700 (-2%) | 1mo | $118,000 | $169 | 83 |
| 2422 Oneida Ave | 0.29mi | 2/1.0 | 758 (+6%) | 9mo | $132,000 | $174 | 70 |
| 2535 Ontario Ave | 0.10mi | 2/1.0 | 624 (-13%) | 18mo | $40,000 | $64 | 59 |
| 2247 Ontario Ave | 0.45mi | 3/1.0 (+1) | 668 (-7%) | 16mo | $83,500 | $125 | 49 |
| 2016 Neva Dr | 0.67mi | 2/1.0 | 628 (-12%) | 4mo | $67,000 | $107 | 45 |
Match score weights: distance 35% · size 25% · config 20% · recency 20%. Top-matched comps best support the ARV.
Projected returns pro-forma
-3.0% appreciation · 7.41% rent growth · sell at horizon
- IRR
- 20.1%
- Equity multiple
- 1.87×
- Total profit
- $14,544
- Equity at exit
- $8,931
- IRR
- 31.4%
- Equity multiple
- 4.52×
- Total profit
- $58,988
- Equity at exit
- $5,179
Cash invested: $16,772 (down + closing). Projections, not guarantees.
Landlord ↔ Tenant lean methodology
- Overall (STATE)
- 73 Landlord-Friendly
- State Ohio
- 73 Landlord-Friendly · R+6
- County
- — inherits STATE
- City
- — inherits STATE
ZIP-level market 45414
- Rents YoY
- 7.4%
- Active inventory
- 51
- Price-to-rent
- 5.0×
Monthly cashflow live
- Estimated rent
- $1,005 high interval (Pro) →
- Mortgage (P&I)
- −$314
- Tax from tax record
- −$81 /mo · $976/yr
- Insurance
- −$25
- Flood insurance flood zone
- −$66 /mo · $798/yr
- HOA
- −$0
- Vacancy / Maint / Mgmt
- −$211
- Net cashflow
- $307
Break-even live
UW: 25.0% down · 7.5% · 30yr · 1.5% tax · 5.0% vac · 8.0% maint · 8.0% mgmt
Financing live
Cash to close
- Down payment
- $14,975
- Closing costs
- $1,797
- Reserves months
- —
- Total cash needed
- —
Loan-product check · same deal, 3 products live
Conventional
25% down · 7.5% · 30yr
- Down + closing
- —
- Monthly P&I
- —
- Monthly cashflow
- —
- DSCR
- —
- Eligible?
- —
Personal DTI + credit; lowest rate.
DSCR
20% down · 8.5% · 30yr
- Down + closing
- —
- Monthly P&I
- —
- Monthly cashflow
- —
- DSCR
- —
- Eligible?
- —
No personal income docs; deal must DSCR.
Hard money
10% down · 12.0% · 12mo
- Down + closing
- —
- Monthly P&I
- —
- Monthly cashflow
- —
- DSCR
- —
- Eligible?
- —
Short-term bridge; refi at stabilization.
Rent comps 9 comps
| Address | Beds | Baths | Sqft | Rent | $/sqft | DOM | Units | Dist |
|---|---|---|---|---|---|---|---|---|
| 3001 Idylwilde Blvd Unit 1D Dayton, OH | 1.0 | 1.0 | 500 | $825 | $1.65 | 2d | 1 | 0.84mi |
| 3001 Idylwilde Blvd Unit 1B Dayton, OH | 1.0 | 1.0 | 500 | $750 | $1.50 | 3d | 1 | 0.84mi |
| 4702 Bryant Ave Unit 1 Dayton, OH | 1.0 | 1.0 | 574 | $725 | $1.26 | 23d | 1 | 1.06mi |
| 623 Troy St Unit D Dayton, OH | 1.0 | 1.0 | 550 | $725 | $1.32 | 2d | 1 | 1.30mi |
| 623 Troy St Unit A Dayton, OH | 1.0 | 1.0 | 550 | $695 | $1.26 | 43d | 1 | 1.30mi |
| 235 E Hillcrest Ave Dayton, OH | 1.0 | 1.0 | 750 | $775 | $1.03 | 43d | 1 | 1.43mi |
| 246 Basswood Ave Unit 2 Dayton, OH | 1.0 | 1.0 | 650 | $650 | $1.00 | 43d | 1 | 1.43mi |
| 410 E Bruce Ave Unit 410-3 Dayton, OH | 2.0 | 1.0 | 650 | $900 | $1.38 | 43d | 1 | 1.44mi |
| 638 Redwood Ave Unit 4 Dayton, OH | 1.0 | 1.0 | 650 | $725 | $1.12 | 3d | 1 | 1.49mi |
Listing history 18 events
-
2026-06-18days on market $59,900 Active 74 DOM
-
2026-06-18status $59,900 Active 73 DOM
-
2026-06-17days on market $59,900 ActiveUnderContract 73 DOM
-
2026-06-16days on market $59,900 ActiveUnderContract 72 DOM
-
2026-06-15days on market $59,900 ActiveUnderContract 71 DOM
-
2026-06-14days on market $59,900 ActiveUnderContract 69 DOM
-
2026-06-13days on market $59,900 ActiveUnderContract 68 DOM
-
2026-06-10days on market $59,900 ActiveUnderContract 66 DOM
-
2026-06-09days on market $59,900 ActiveUnderContract 65 DOM
-
2026-06-08days on market $59,900 ActiveUnderContract 64 DOM
-
2026-06-07days on market $59,900 ActiveUnderContract 63 DOM
-
2026-06-03days on market $59,900 ActiveUnderContract 59 DOM
-
2026-06-02days on market $59,900 ActiveUnderContract 58 DOM
-
2026-06-01days on market $59,900 ActiveUnderContract 57 DOM
-
2026-05-31days on market $59,900 ActiveUnderContract 56 DOM
-
2026-04-27price $59,900
-
2026-03-31$65,900 Active
-
2003-09-03soldstatus $43,500
ⓘ Source: listings_history table (triggers on properties + properties_extension) + one-shot
backfill from property_details.listing_events for pre-trigger history.
Tax reassessment forecast OH · Partial reset (capped growth)
- Current annual tax
- $976 · $81/mo
- Projected year-2 tax
- $976 · $81/mo
- Expected delta
- $0/yr ($0/mo · 0.0%)
ⓘ Screening estimate from a state-policy table — verify with the county assessor before closing.
Climate risk First Street
- Flood 10/10 Extreme FEMA zone X (shaded) · 99% chance over 30 yrs
- Wildfire 1/10 Low
- Heat 4/10 Moderate 7 d/yr ≥102°F today · 18 d/yr by 30 yrs out
- Wind 2/10 Low 0% chance of damaging wind over 30 yrs
- Air quality 3/10 Moderate 2 unhealthy d/yr today · 4 by 30 yrs out
Nearby sold comps map
Loading sold comps map…
Walkable amenities ~0.75 mi
Loading nearby amenities…
Taxation est. · year 1
- Rental income
- $12,055
- − Mortgage interest
- −$3,355
- − Property taxes
- −$976
- − Insurance
- −$1,097
- − Repairs & maintenance
- −$964
- − Management
- −$964
- − Depreciation
- −$1,743
- Taxable income
- $2,955
- Est. tax owed @ 24.0%
- −$709
- After-tax cash flow
- $2,971/yr
For passive investors: Depreciation is non-cash, so a rental often shows a tax loss while cash-flowing — sheltering income. Rental losses are passive: they offset passive income freely, and up to $25,000/yr can offset ordinary (W-2) income if you actively participate and your MAGI is under $100k (phasing out to $0 by $150k); unused losses carry forward. On sale, claimed depreciation is recaptured at up to 25%, and gains may owe capital-gains tax (a 1031 exchange can defer both). Figures are a year-1 estimate at your 24.0% rate — not tax advice; consult a CPA.
Schools (NCES district)
No district data.
Livability — Dayton
- Score
- 65/100
- State rank
- #716
- US rank
- #12895
Category grades
Schools grade is shown separately in the Schools card above.
Census & demographics
- County
- Montgomery County · 459,541 people
- City population
- 164,387
- Metro
- Dayton-Kettering, OH
- Population (ZIP)
- 21,167
- Household income
- $54,485
- Rent vs Own
- Severe rent burden
- 801.0
Population outlook (Montgomery County) Hauer SSP2
- Today (2025)
- 523,241 people
- By 2030
- 514,948 · -1.6%
- By 2040
- 493,378 · -5.7%
- By 2050
- 469,639 · -10.2%
- By 2075
- 418,360 · -20.0%
- By 2100
- 353,315 · -32.5%
Race, ethnicity, and origin ACS 2023
- Neighborhood character
- Predominantly White (75%)
- Race & ethnicity
- White 75% Black 15% Two or more races 6% Hispanic / Latino 4% Asian 1%
- Common ancestry
- Slovak 2% Romanian 2% Italian 2%
- Foreign-born
- 4% · Canada
- Languages at home
- 94% English-only · Spanish 2% Arabic 1% Tagalog/Filipino 1%
Political lean MEDSL · Montgomery
- 2024 margin
- Toss-up / Even · D 49.8% · R 49.3%
- 2008→2024 swing
- -5.8pp toward R · 2008: 6.2pp · 2024: 0.5pp
- All cycles
- 2024: D+0.5 2020: D+2.2 2016: R+1.2 2012: D+3.1 2008: D+6.2
Not yet ingested
- Civics
- —
Market trends
- HPI YoY
- ▼ -142.46%
- Current HPI
- 183.1124
- Rent YoY
- ▲ 7.41%
- Metro
- Dayton-Kettering, OH
- State GDP YoY
- ▲ 1.98%
- F500 in state
- 48
Industry mix (Fortune 500 HQ in OH)
| Industry | F500 HQs | Revenue |
|---|---|---|
| Insurance | 3 | $145B |
|
||
| Industrial Machinery | 3 | $49B |
|
||
| Financial Services | 3 | $24B |
|
||
| Consumer Goods | 2 | $93B |
|
||
| Aerospace / Defense | 2 | $47B |
|
||
| Utilities | 2 | $33B |
|
||
Price history
+37.7% since first listed3 events — show timeline
- 2026-04-27 Price Changed $59,900 Dayton MLS
- 2026-03-31 Listed $65,900 Dayton MLS
- 2003-09-03 Sold (Public Records) $43,500 Public Records
Property tax history
+1.8%/yrLatest (2025): $976 · -8.0% YoY. Source: county tax records.
Cash-flow waterfall
monthlySold comps — $/sqft
last 12 mo · ≤1 miLoading sold comps…