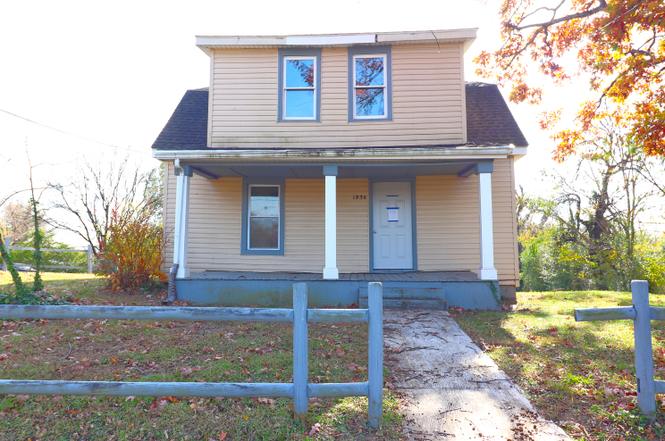
1936 Willis St · Salem, VA
Flood risk 1/10 · Minimal
- FEMA flood zone
- X (unshaded)
- Chance of flooding over 30 yrs
- 0.0%
- Est. flood insurance / yr
- $473 – $860
Fire risk 1/10 · Minimal
- Est. fire insurance / yr
- $666 – $1,236
Heat risk 5/10 · Moderate
- Hot days now (above 101°F)
- 7 days/yr
- Hot days in 30 yrs
- 16 days/yr
Wind risk 2/10 · Minimal
- Chance of severe wind over 30 yrs
- 1.0%
Air-quality risk 1/10 · Minimal
- Unhealthy air days now
- 0 days/yr
- Unhealthy air days in 30 yrs
- 0 days/yr
Risk factors via First Street. Map © Google.
Why this score? — see what drove the B- grade
The composite is a weighted blend of 9 inputs, each scored 0–100. Each bar is that input's sub-score; the figure is the points it added to the 100-point composite (weight × sub-score).
- Cash flow +22.8/30.0
- ARV discount +15.0/15.0
- DSCR +7.3/10.0
- 1% rule +5.7/10.0
- Schools +5.7/10.0
- Rent growth +4.0/5.0
- Livability +3.9/5.0
- Condition / age +2.5/5.0
- Appreciation +0.0/10.0
$157,500
🖨 Deal sheet (PDF) 📄 Offer letter ✓ Due diligence
Listing remarks MLS
This adorable, updated home has so much to offer with 1,432 sq. ft, 3 bedrooms and 1 bath in a great neighborhood and with great schools! Brand new floors throughout, New carpet upstairs, New windows, New custom kitchen cabinets, Fresh paint and so much more! You don't want to miss out on this one, come see it today before it's gone!
Key facts
- 0.4 acre lot
- Built 1920
- Listed 122 days
Property features AI
Finance
- Other: Listed by PRIME REAL ESTATE SERVICES INC
- Financial info: Parcel number 79-3-7
Exterior
- Utilities: Has heating; Has cooling
- Home design: Residential property; Built in 1920
- Construction: Built in 1920
- Exterior features: 0.4-acre lot
Interior
- Bedrooms: 3 bedrooms total; 1 bedroom on the main level
- Flooring: Laminate
- Bathrooms: 1 full bathroom; 1 bathroom on the main level
- Heating & cooling: Forced air gas heating; Has cooling
- Interior features: Laminate flooring
Neighborhood map
What this means for you Summary
Snapshot
- This is a 3-bed/1.0-bath single-family listed at $158k.
Deal economics
- At list price, monthly cash flow is $274 ($3k/yr) — positive.
- The deal already cash-flows at list — no discount required.
- Meets the 1% rule at list price ($2k rent vs $158k).
- Recommended offer: $139k (12.0% below list) — sets the bar for market timing.
- Cap rate 8.4% vs local median 2.9% in Salem — top-decile yield for the area; either an underpriced asset or a hidden risk that comps aren't pricing in. Stress-test before assuming the spread holds.
Location & tenants
- Location reads 77/100 on livability (#104 in VA, #3,257 nationally) — a middle-class / working-renter tenant base. Strengths: housing A+, health & safety A+, cost of living A; Watch: amenities F, commute F.
- Salem City Public School District (suburban): math 61% / reading 74% proficiency, ranked #35 of 131 in VA (top 27%) — acceptable for families but not a draw, mixed tenant base, ~2y average lease.
- Zoned schools: East Salem Elementary (math 52% / reading 67%, grade B-, #536 of 1,108 statewide, top 51%, 409 students, 73% FRL); Andrew Lewis Middle (math 57% / reading 72%, grade A-, #123 of 342 statewide, top 37%, 895 students, 44% FRL); Salem High (math 64% / reading 91%, grade A-, #83 of 319 statewide, top 28%, 1,227 students, 39% FRL) — zoned schools average 52% FRL vs 27% district-wide (25 pts higher); higher-poverty schools than district average — tighter screening recommended.
- Market conditions: Rents rising fast (+6.0%/yr); 271 active listings in the ZIP; 8 comparable units currently listed for rent nearby; rentals at typical pace (median 22d on market — plan ~3-4 weeks tenant-placement turnaround); 268 units permitted in Salem city in 2024 (248 in 5+ unit buildings).
Forward outlook
- Local home prices are declining (-3.0%/yr); year-one equity from $1k of loan paydown is wiped out by about $5k of value loss. Plan a longer hold.
- Salem County population projected at +16% by 2050 — long-run rental-demand tailwind backs the buy-and-hold thesis.
- At projected returns (-3.0% appreciation + 6.0% rent growth), your $44k cash investment doubles in ~10 years — after that, you're playing with house money.
Negotiation context
- It's been on market 122 days — a 12% lower offer ($139k) is reasonable based on typical stale-listing flexibility.
- 6 sale attempts since 27y ago; this cycle's ask has dropped $42k (21%) from the opening price — seller is motivated, your offer sets the floor, not the list.
Risks & watch-outs
- Watch-outs: built in 1920 — expect roof / HVAC / electrical / plumbing capex.
- Climate carrying-cost: extreme-heat days projected 7→16/yr by 2055 (HVAC capex compounding) — expect insurance premiums to compound above CPI over the hold.
Questions for the listing agent
- It's been on market 122 days. Have you received any prior offers? Is the seller open to a 12% concession, seller financing, or rate buy-down credit?
- Built in 1920 — when were the roof, HVAC, electrical panel, plumbing, and water heater last replaced?
- Why hasn't it sold? Are there any deal-killer items the seller is aware of (foundation, flood, title, zoning, code violations)?
- Is there a deadline driving the sale (1031 exchange, divorce, estate, relocation)? That informs how much negotiation room exists.
- Schools are A-rated — typically a magnet for longer-tenancy family renters. What's the average tenant stay here, and is there a school-zone premium baked into asking?
- What's the average days-on-market for RENTAL listings here right now (not sales)? A rising rental-DOM trend means longer vacancies and softer asking-rent achievability than the comps imply.
- What's the recent tenant-quality profile in this submarket — average credit score on applications, eviction rate, late-payment / NSF rate, and stable-employment percentage? A property-management company in the area should have these aggregated.
- How much new for-sale + rental construction is in the pipeline within 1–3 miles? Heavy new supply typically softens prices + rents 12–24 months out; constrained supply supports both.
Investment metrics
- 1% rule
- 1.07% ✓
- Cap rate
- 8.38%
- Cash-on-cash
- 7.45%
- DSCR
- 1.33
- GRM
- 7.8
CMA / ARV
- ARV (on-the-fly)
- $237,712
- Comps found
- 12
Show comp detail 12 sales within ~0.75 mi
| Address | Dist | Beds/Ba | Sqft | Sold | Price | $/sf | Match |
|---|---|---|---|---|---|---|---|
| 845 Pinewood Dr NW | 0.35mi | 3/1.0 | 1,405 (-2%) | 8mo | $251,000 | $179 | 74 |
| 5204 Salem Tpke NW | 0.49mi | 3/2.0 | 1,490 (+4%) | 2mo | $160,000 | $107 | 65 |
| 1008 Glenn Ridge Rd NW | 0.62mi | 3/2.0 | 1,421 (-1%) | 6mo | $245,000 | $172 | 61 |
| 822 Brownwood Dr NW | 0.42mi | 3/1.0 | 1,516 (+6%) | 12mo | $195,000 | $129 | 61 |
| 4507 Surrey Ave NW | 0.59mi | 3/1.0 | 1,354 (-5%) | 5mo | $110,000 | $81 | 59 |
| 5033 Youngwood Dr NW | 0.65mi | 3/1.5 | 1,372 (-4%) | 3mo | $245,050 | $179 | 58 |
| 987 Mountain Rd NW | 0.39mi | 3/1.0 | 1,268 (-12%) | 10mo | $199,000 | $157 | 55 |
| 931 Hedgewood Dr NW | 0.35mi | 4/2.0 (+1) | 1,536 (+7%) | 11mo | $235,000 | $153 | 54 |
| 1723 Victoria St | 0.37mi | 3/1.5 | 1,283 (-10%) | 12mo | $240,000 | $187 | 54 |
| 5027 Morwanda St NW | 0.33mi | 2/1.0 (-1) | 1,244 (-13%) | 6mo | $175,500 | $141 | 52 |
| 4305 Camille Ave NW | 0.67mi | 3/2.0 | 1,285 (-10%) | 4mo | $259,950 | $202 | 45 |
| 1634 Sigmon Rd NW | 0.72mi | 3/2.0 | 1,633 (+14%) | 11mo | $271,000 | $166 | 30 |
Match score weights: distance 35% · size 25% · config 20% · recency 20%. Top-matched comps best support the ARV.
Projected returns pro-forma
-3.0% appreciation · 5.98% rent growth · sell at horizon
- IRR
- -1.7%
- Equity multiple
- 0.93×
- Total profit
- $-2,869
- Equity at exit
- $23,484
- IRR
- 10.9%
- Equity multiple
- 1.97×
- Total profit
- $42,682
- Equity at exit
- $13,618
Cash invested: $44,100 (down + closing). Projections, not guarantees.
Landlord ↔ Tenant lean methodology
- Overall (STATE)
- 55 Moderately Landlord-Leaning
- State Virginia
- 55 Moderately Landlord-Leaning · D+2
- County
- — inherits STATE
- City
- — inherits STATE
ZIP-level market 24153
- Rents YoY
- 6.0%
- Active inventory
- 271
- Price-to-rent
- 7.8×
Monthly cashflow live
- Estimated rent
- $1,685 high interval (Pro) →
- Mortgage (P&I)
- −$826
- Tax from tax record
- −$165 /mo · $1,984/yr
- Insurance
- −$66
- HOA
- −$0
- Vacancy / Maint / Mgmt
- −$354
- Net cashflow
- $274
Break-even live
Sensitivity live
| Price | -10% $363 | -5% $318 | +0% $274 | +5% $229 | +10% $185 |
|---|---|---|---|---|---|
| Rent | -10% $141 | -5% $207 | +0% $274 | +5% $340 | +10% $407 |
| Rate | -1.0pp $353 | -0.5pp $314 | base $274 | +0.5pp $233 | +1.0pp $192 |
UW: 25.0% down · 7.5% · 30yr · 1.5% tax · 5.0% vac · 8.0% maint · 8.0% mgmt
Financing live
Cash to close
- Down payment
- $39,375
- Closing costs
- $4,725
- Reserves months
- —
- Total cash needed
- —
Loan-product check · same deal, 3 products live
Conventional
25% down · 7.5% · 30yr
- Down + closing
- —
- Monthly P&I
- —
- Monthly cashflow
- —
- DSCR
- —
- Eligible?
- —
Personal DTI + credit; lowest rate.
DSCR
20% down · 8.5% · 30yr
- Down + closing
- —
- Monthly P&I
- —
- Monthly cashflow
- —
- DSCR
- —
- Eligible?
- —
No personal income docs; deal must DSCR.
Hard money
10% down · 12.0% · 12mo
- Down + closing
- —
- Monthly P&I
- —
- Monthly cashflow
- —
- DSCR
- —
- Eligible?
- —
Short-term bridge; refi at stabilization.
Rent comps 8 comps
| Address | Beds | Baths | Sqft | Rent | $/sqft | DOM | Units | Dist |
|---|---|---|---|---|---|---|---|---|
| 4310 Tyree Rd NW Roanoke, VA | 3.0 | 1.0 | 913 | $1,650 | $1.81 | 14d | 1 | 0.87mi |
| 4626 Autumn Ln NW Roanoke, VA | 3.0 | 2.5 | 1408 | $1,999 | $1.42 | 14d | 1 | 0.91mi |
| 3802 Panorama Ave NW #6 Roanoke, VA | 2.0 | 1.0 | 900 | $1,050 | $1.17 | 44d | 1 | 1.19mi |
| 3802 Panorama Ave NW #12 Roanoke, VA | 3.0 | 1.0 | 1100 | $995 | $0.90 | 44d | 1 | 1.19mi |
| 3802 Panorama Ave NW #2 Roanoke, VA | 2.0 | 1.0 | 900 | $995 | $1.11 | 44d | 1 | 1.19mi |
| 328 Woodside Dr Salem, VA | 3.0 | 2.5 | 1408 | $1,999 | $1.42 | 21d | 1 | 1.24mi |
| 900 Camelot Dr Salem, VA | 1.0–3.0 | 1.0–1.5 | 905 | $1,760 | $1.94 | 14d | 10 | 1.25mi |
| 128 Rutledge Dr Salem, VA | 1.0–3.0 | 1.0–2.0 | 822 | $1,505 | $1.83 | 14d | 13 | 1.48mi |
Listing history 28 events
-
2026-06-13statusdays on market $157,500 Pending 122 DOM
-
2026-06-10days on market $157,500 Active 121 DOM
-
2026-06-09days on market $157,500 Active 120 DOM
-
2026-06-08days on market $157,500 Active 119 DOM
-
2026-06-03days on market $157,500 Active 114 DOM
-
2026-06-02days on market $157,500 Active 113 DOM
-
2026-06-01days on market $157,500 Active 112 DOM
-
2026-05-31days on market $157,500 Active 111 DOM
-
2026-05-30days on market $157,500 Active 110 DOM
-
2026-05-21status Active
-
2026-03-17status Pending
-
2026-02-20price $157,500
-
2026-01-22price $180,000
-
2025-12-05$200,000 Active
-
2025-08-15soldstatus $206,897
-
2023-03-24soldstatus $185,000 Closed 335-char remark
Show marketing remark (335 chars)
This adorable, updated home has so much to offer with 1,432 sq. ft, 3 bedrooms and 1 bath in a great neighborhood and with great schools! Brand new floors throughout, New carpet upstairs, New windows, New custom kitchen cabinets, Fresh paint and so much more! You don't want to miss out on this one, come see it today before it's gone!
-
2023-02-13status Pending 335-char remark
Show marketing remark (335 chars)
This adorable, updated home has so much to offer with 1,432 sq. ft, 3 bedrooms and 1 bath in a great neighborhood and with great schools! Brand new floors throughout, New carpet upstairs, New windows, New custom kitchen cabinets, Fresh paint and so much more! You don't want to miss out on this one, come see it today before it's gone!
-
2023-01-20price $187,000 335-char remark
Show marketing remark (335 chars)
This adorable, updated home has so much to offer with 1,432 sq. ft, 3 bedrooms and 1 bath in a great neighborhood and with great schools! Brand new floors throughout, New carpet upstairs, New windows, New custom kitchen cabinets, Fresh paint and so much more! You don't want to miss out on this one, come see it today before it's gone!
-
2023-01-04price $197,000 335-char remark
Show marketing remark (335 chars)
This adorable, updated home has so much to offer with 1,432 sq. ft, 3 bedrooms and 1 bath in a great neighborhood and with great schools! Brand new floors throughout, New carpet upstairs, New windows, New custom kitchen cabinets, Fresh paint and so much more! You don't want to miss out on this one, come see it today before it's gone!
-
2022-11-09$200,000 Active 335-char remark
Show marketing remark (335 chars)
This adorable, updated home has so much to offer with 1,432 sq. ft, 3 bedrooms and 1 bath in a great neighborhood and with great schools! Brand new floors throughout, New carpet upstairs, New windows, New custom kitchen cabinets, Fresh paint and so much more! You don't want to miss out on this one, come see it today before it's gone!
-
2004-08-24soldstatus $65,000
-
2004-08-23soldstatus $65,000 110-char remark
Show marketing remark (110 chars)
HOUSE SOLD AS IS AND WHERE IS CALL AGENT FOR ADDENDUMBS BEFORE WRITING OFFERS $1000 MINIMUM DEPOSIT WITH OFFER
-
2004-07-16$65,000 110-char remark
Show marketing remark (110 chars)
HOUSE SOLD AS IS AND WHERE IS CALL AGENT FOR ADDENDUMBS BEFORE WRITING OFFERS $1000 MINIMUM DEPOSIT WITH OFFER
-
2004-07-12soldstatus $65,260
-
2004-02-06historical
-
2003-11-06$74,900
-
2000-06-26soldstatus $83,000
-
1999-09-08$72,950
ⓘ Source: listings_history table (triggers on properties + properties_extension) + one-shot
backfill from property_details.listing_events for pre-trigger history.
Tax reassessment forecast VA · Resets to sale price
- Current annual tax
- $1,984 · $165/mo
- Projected year-2 tax
- $1,984 · $165/mo
- Expected delta
- $0/yr ($0/mo · 0.0%)
ⓘ Screening estimate from a state-policy table — verify with the county assessor before closing.
Climate risk First Street
- Flood 1/10 Low FEMA zone X (unshaded) · 0% chance over 30 yrs
- Wildfire 1/10 Low
- Heat 5/10 Major 7 d/yr ≥101°F today · 16 d/yr by 30 yrs out
- Wind 2/10 Low 100% chance of damaging wind over 30 yrs
- Air quality 1/10 Low 0 unhealthy d/yr today · 0 by 30 yrs out
Nearby sold comps map
Loading sold comps map…
Walkable amenities ~0.75 mi
Loading nearby amenities…
Taxation est. · year 1
- Rental income
- $20,214
- − Mortgage interest
- −$8,822
- − Property taxes
- −$1,984
- − Insurance
- −$788
- − Repairs & maintenance
- −$1,617
- − Management
- −$1,617
- − Depreciation
- −$4,582
- Taxable income
- $805
- Est. tax owed @ 24.0%
- −$193
- After-tax cash flow
- $3,094/yr
For passive investors: Depreciation is non-cash, so a rental often shows a tax loss while cash-flowing — sheltering income. Rental losses are passive: they offset passive income freely, and up to $25,000/yr can offset ordinary (W-2) income if you actively participate and your MAGI is under $100k (phasing out to $0 by $150k); unused losses carry forward. On sale, claimed depreciation is recaptured at up to 25%, and gains may owe capital-gains tax (a 1031 exchange can defer both). Figures are a year-1 estimate at your 24.0% rate — not tax advice; consult a CPA.
Schools (NCES district)
- District
- Salem City Public School District
- NCES district ID
- 5103460
- Math proficiency
- 61% ▼ -21.00%
- Reading proficiency
- 74% ▼ -7.00%
- Median HH income
- $49,976
- Composite
- 57.25/100
- National rank
- #1092
- State rank
- #35 of 131 in VA
Livability — Salem
- Score
- 77/100
- State rank
- #104
- US rank
- #3257
Category grades
Schools grade is shown separately in the Schools card above.
Census & demographics
- Census place
- Salem, VA
- County
- Salem City · 38,914 people
- City population
- 38,914
- Metro
- Roanoke, VA
- Population (ZIP)
- 38,914
- Household income
- $74,260
- Rent vs Own
- Severe rent burden
- 1115.0
Population outlook (Salem County) Hauer SSP2
- Today (2025)
- 26,761 people
- By 2030
- 27,543 · +2.9%
- By 2040
- 29,174 · +9.0%
- By 2050
- 30,902 · +15.5%
- By 2075
- 35,530 · +32.8%
- By 2100
- 39,381 · +47.2%
Race, ethnicity, and origin ACS 2023
- Neighborhood character
- Predominantly White (84%)
- Race & ethnicity
- White 84% Black 6% Hispanic / Latino 4% Two or more races 4% Asian 2%
- Common ancestry
- Serbian 2% Slovak 2% Romanian 1%
- Foreign-born
- 4% · Canada, China
- Languages at home
- 96% English-only · Spanish 2% Other Indo-European 1%
Political lean MEDSL · Salem
- 2024 margin
- R (+19.3) · D 39.8% · R 59.1% · Other 1.1%
- 2008→2024 swing
- -3.8pp toward R · 2008: -15.5pp · 2024: -19.3pp
- All cycles
- 2024: R+19.3 2020: R+19.4 2016: R+24.8 2012: R+20.6 2008: R+15.5
Not yet ingested
- Civics
- —
Market trends
- HPI YoY
- ▼ -259.46%
- Current HPI
- 170.8986
- Rent YoY
- ▲ 5.98%
- Metro
- Roanoke, VA
- State GDP YoY
- ▲ 2.40%
- F500 in state
- 50
Industry mix (Fortune 500 HQ in VA)
| Industry | F500 HQs | Revenue |
|---|---|---|
| Aerospace / Defense | 4 | $236B |
|
||
| Technology / Defense | 3 | $32B |
|
||
| Financial Services | 2 | $176B |
|
||
| Utilities | 2 | $27B |
|
||
| Insurance | 2 | $25B |
|
||
| Technology | 2 | $15B |
|
||
Price history
+115.9% since first listed19 events — show timeline
- 2026-05-21 Relisted — MLSRV
- 2026-03-17 Pending — MLSRV
- 2026-02-20 Price Changed $157,500 MLSRV
- 2026-01-22 Price Changed $180,000 MLSRV
- 2025-12-05 Listed $200,000 MLSRV
- 2025-08-15 Sold (Public Records) $206,897 Public Records
- 2023-03-24 Sold (MLS) $185,000 MLSRV
- 2023-02-13 Pending — MLSRV
- 2023-01-20 Price Changed $187,000 MLSRV
- 2023-01-04 Price Changed $197,000 MLSRV
- 2022-11-09 Listed $200,000 MLSRV
- 2004-08-24 Sold (Public Records) $65,000 Public Records
- 2004-08-23 Sold (MLS) $65,000 MLSRV
- 2004-07-16 Listed $65,000 MLSRV
- 2004-07-12 Sold (Public Records) $65,260 Public Records
- 2004-02-06 Listing Removed — MLSRV
- 2003-11-06 Listed $74,900 MLSRV
- 2000-06-26 Sold (MLS) $83,000 MLSRV
- 1999-09-08 Listed $72,950 MLSRV
Property tax history
+6.1%/yrLatest (2025): $1,984 · +8.5% YoY. Source: county tax records.
Cash-flow waterfall
monthlySold comps — $/sqft
last 12 mo · ≤1 miLoading sold comps…