 Triplex
214-216 Pine St · Burlington, VT
Flood risk 1/10 · Minimal
- FEMA flood zone
- X (unshaded)
- Chance of flooding over 30 yrs
- 0.0%
- Est. flood insurance / yr
- $473 – $860
Fire risk 1/10 · Minimal
- Est. fire insurance / yr
- $480 – $892
Heat risk 3/10 · Minor
- Hot days now (above 93°F)
- 7 days/yr
- Hot days in 30 yrs
- 16 days/yr
Wind risk 2/10 · Minimal
- Chance of severe wind over 30 yrs
- 1.0%
Air-quality risk 2/10 · Minimal
- Unhealthy air days now
- 1 days/yr
- Unhealthy air days in 30 yrs
- 1 days/yr
Risk factors via First Street. Map © Google.
Why this score? — see what drove the D+ grade
The composite is a weighted blend of 9 inputs, each scored 0–100. Each bar is that input's sub-score; the figure is the points it added to the 100-point composite (weight × sub-score).
- Cash flow +20.2/30.0
- DSCR +6.4/10.0
- 1% rule +5.3/10.0
- Schools +5.0/10.0
- Livability +3.7/5.0
- Rent growth +2.6/5.0
- Condition / age +2.5/5.0
- ARV discount +2.1/15.0
- Appreciation +0.0/10.0
$639,000
🖨 Deal sheet 📄 Offer letter ✓ Due diligence
Multi-family units
County records classify this as Multi-Family (5+ Unit). Listing-text estimate: 3 units. estimate disagrees with records
5+ unit building — per-unit beds/baths from public records are typically unavailable; the breakdown below (if shown) is an estimate from the listing text.
Listing remarks
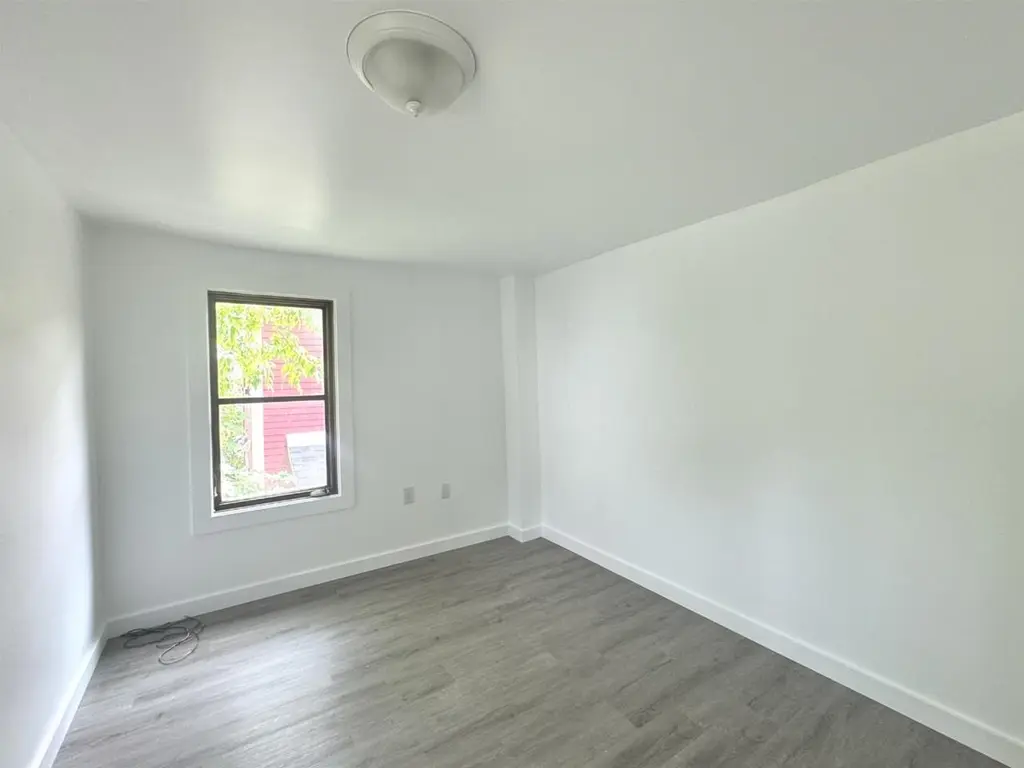
Exceptional investment opportunity in one of Burlington’s most desirable locations! This well-maintained triplex is just a few blocks from downtown, Church Street Marketplace, the Lake Champlain waterfront, and the vibrant South End Arts District. The property offers three 2-bedroom, 1-bathroom apartments for a total of 6 bedrooms and 3 bathrooms. The rear townhouse-style apartment (Unit C) was extensively remodeled in Spring 2026 with a brand-new kitchen, new flooring, and fresh paint, plus it is currently vacant - making it an ideal option for an owner-occupant or an investor seeking market-rate rent. Unit B has also been updated in recent years, while Units A and B are fully rented
Key facts
- Off street parking
- Remodeled kitchen
- Ample bike storage
Tags
Property features AI
Finance
- Other: Unit lease terms: Annual
- Financial info: Net income reported: $51,072; Operating expenses may include insurance, maintenance, trash, water/sewer and other items
- HOA & community: No HOA information provided
Exterior
- Parking: Dirt driveway (no additional parking details provided)
- Security: No security features provided
- Utilities: Public sewer; Public water; Electric with circuit breakers; Vermont Gas Systems for fuel; Cable available; High-speed internet available
- Home design: Multi-family building; Units include flats and a townhouse-style unit; Existing construction; White exterior
- Construction: Built in 1899; Wood frame with vinyl siding; Asphalt shingle roof; Crawl space foundation
- Exterior features: City lot in town with sidewalks; Near shopping, public transportation, hospital, and schools; Dirt driveway
Interior
- Kitchen: No specific kitchen appliance details provided
- Bedrooms: Three 2-bedroom units (Units 1–3)
- Flooring: Carpet; Laminate; Vinyl plank
- Bathrooms: Three full bathrooms (one per unit)
- Heating & cooling: Direct vent heating; No central cooling
- Interior features: Basement with exterior walk-up access; crawl space and unfinished areas
- Laundry & utility: No specific washer/dryer details provided
Neighborhood map
What this means for you Summary
Snapshot
- This is a 3 × 2-bed/1.0-bath units multifamily listed at $639k.
Deal economics
- At list price, monthly cash flow is $803 ($10k/yr) — positive. Per door: $268/mo.
- The deal already cash-flows at list — no discount required.
- Meets the 1% rule at list price ($7k rent vs $639k).
- Cap rate 7.8% vs local median 3.1% in Burlington — top-decile yield for the area; either an underpriced asset or a hidden risk that comps aren't pricing in. Stress-test before assuming the spread holds.
Location & tenants
- Location reads 74/100 on livability (#19 in VT, #4,619 nationally) — a middle-class / working-renter tenant base. Strengths: commute A+, health & safety A+, schools B; Watch: cost of living D, crime F, amenities F.
- Market conditions: Rents flat; 137 active listings in the ZIP; 1 comparable units currently listed for rent nearby; 898 units permitted in Chittenden County in 2024 (554 in 5+ unit buildings).
- At $6,606/mo this rent would consume 121% of the median local household income ($66k/yr) (locally 2757% of renters already pay >50% of income on rent) — very limited rent-growth headroom before tenants either downsize or default.
Forward outlook
- Local home prices are declining (-3.0%/yr); year-one equity from $4k of loan paydown is wiped out by about $19k of value loss. Plan a longer hold.
- Chittenden County population projected at +8% by 2050 — modest demand growth; plan on rents tracking national, not racing it.
Negotiation context
- Only 7 days on market — expect competitive offers; lowballing is unlikely to land.
- 3 sale attempts since 3y ago with the ask held roughly flat each time — persistent listings suggest the price (not the market) is what's stuck; bring a comps-based counter.
Risks & watch-outs
- Watch-outs: built in 1899 — expect roof / HVAC / electrical / plumbing capex.
Questions for the listing agent
- Can we see the unit-by-unit rent roll, current vacancy, and any below-market leases? What's the average tenancy length?
- What capital expenditures (roof, boiler, parking lot, exteriors) have been made in the last 5 years, and what's planned in the next 2?
- Built in 1899 — when were the roof, HVAC, electrical panel, plumbing, and water heater last replaced?
- Is there a deadline driving the sale (1031 exchange, divorce, estate, relocation)? That informs how much negotiation room exists.
- Schools are B-rated — typically a magnet for longer-tenancy family renters. What's the average tenant stay here, and is there a school-zone premium baked into asking?
- Crime grade is F in this area — have there been break-ins, vandalism, or insurance claims at this property in the last 3 years? What carrier currently insures it and at what premium?
- The area grade is low — what's the realistic commute time and amenity access for the typical tenant pool here? Any planned neighborhood developments (good or bad) we should know about?
- What's the average days-on-market for RENTAL listings here right now (not sales)? A rising rental-DOM trend means longer vacancies and softer asking-rent achievability than the comps imply.
- What's the recent tenant-quality profile in this submarket — average credit score on applications, eviction rate, late-payment / NSF rate, and stable-employment percentage? A property-management company in the area should have these aggregated.
- How much new apartment / multifamily construction is in the pipeline within 1–3 miles? Heavy new supply (>2% of stock underway) typically softens rents 12–24 months out; light construction supports rent growth.
Investment metrics
- 1% rule
- 1.03% ✓
- Cap rate
- 7.80%
- Cash-on-cash
- 5.38%
- DSCR
- 1.24
- GRM
- 8.1
CMA / ARV
- ARV (on-the-fly)
- $570,584
- Comps found
- 4
Show comp detail 4 sales within ~0.75 mi
| Address | Dist | Beds/Ba | Sqft | Sold | Price | $/sf | Match |
|---|---|---|---|---|---|---|---|
| 54 Hayward St | 0.41mi | 5/2.0 (-1) | 1,680 (-5%) | 6mo | $575,000 | $342 | 58 |
| 37 Greene St | 0.69mi | 5/2.0 (-1) | 1,833 (+3%) | 20mo | $590,000 | $322 | 37 |
| 239 Pearl St | 0.58mi | 7/3.0 (+1) | 2,005 (+13%) | 17mo | $490,000 | $244 | 32 |
| 11 Grant St | 0.62mi | 5/2.0 (-1) | 1,980 (+12%) | 13mo | $610,000 | $308 | 32 |
Match score weights: distance 35% · size 25% · config 20% · recency 20%. Top-matched comps best support the ARV.
Projected returns pro-forma
-3.0% appreciation · 0.52% rent growth · sell at horizon
- IRR
- -10.8%
- Equity multiple
- 0.62×
- Total profit
- $-68,404
- Equity at exit
- $95,277
- IRR
- -5.4%
- Equity multiple
- 0.69×
- Total profit
- $-56,133
- Equity at exit
- $55,249
Cash invested: $178,920 (down + closing). Projections, not guarantees.
Landlord ↔ Tenant lean methodology
- Overall (STATE)
- 41 Moderately Tenant-Leaning
- State Vermont
- 41 Moderately Tenant-Leaning · D+15
- County
- — inherits STATE
- City
- — inherits STATE
ZIP-level market 05401
- Rents YoY
- 0.5%
- Active inventory
- 137
- Price-to-rent
- 24.2×
Monthly cashflow live
- Estimated rent
- $6,606 high interval (Pro) →
- Mortgage (P&I)
- −$3,351
- Tax est. 1.5%
- −$799 /mo · $9,585/yr
- Insurance
- −$266
- HOA
- −$0
- Vacancy / Maint / Mgmt
- −$1,387
- Net cashflow
- $803
Break-even live
3-unit breakdown (identical units grouped — click to expand)
| Units | Beds | Baths | Est. rent |
|---|---|---|---|
| 3× units | 2 | 1 | $6,606 |
| #1 | 2 | 1 | $2,202 |
| #2 | 2 | 1 | $2,202 |
| #3 | 2 | 1 | $2,202 |
| Total (3 units) | $6,606 | ||
UW: 25.0% down · 7.5% · 30yr · 1.5% tax · 5.0% vac · 8.0% maint · 8.0% mgmt
Financing live
Cash to close
- Down payment
- $159,750
- Closing costs
- $19,170
- Reserves months
- —
- Total cash needed
- —
Loan-product check · same deal, 3 products live
Conventional
25% down · 7.5% · 30yr
- Down + closing
- —
- Monthly P&I
- —
- Monthly cashflow
- —
- DSCR
- —
- Eligible?
- —
Personal DTI + credit; lowest rate.
DSCR
20% down · 8.5% · 30yr
- Down + closing
- —
- Monthly P&I
- —
- Monthly cashflow
- —
- DSCR
- —
- Eligible?
- —
No personal income docs; deal must DSCR.
Hard money
10% down · 12.0% · 12mo
- Down + closing
- —
- Monthly P&I
- —
- Monthly cashflow
- —
- DSCR
- —
- Eligible?
- —
Short-term bridge; refi at stabilization.
Rent comps 1 comps
| Address | Beds | Baths | Sqft | Rent | $/sqft | DOM | Units | Dist |
|---|---|---|---|---|---|---|---|---|
| 108 Buell St Burlington, VT | 6.0 | 2.0 | 2500 | $4,800 | $1.92 | 43d | 1 | 0.59mi |
Listing history 7 events
-
2026-06-19days on market $639,000 Active 7 DOM
-
2026-06-18days on market $639,000 Active 6 DOM
-
2026-06-17days on market $639,000 Active 5 DOM
-
2026-06-16days on market $639,000 Active 4 DOM
-
2026-06-15days on market $639,000 Active 3 DOM
-
2026-06-13remarks 693-char remark
-
2026-06-13$639,000 Active 1 DOM
ⓘ Source: listings_history table (triggers on properties + properties_extension) + one-shot
backfill from property_details.listing_events for pre-trigger history.
Climate risk First Street
- Flood 1/10 Low FEMA zone X (unshaded) · 0% chance over 30 yrs
- Wildfire 1/10 Low
- Heat 3/10 Moderate 7 d/yr ≥93°F today · 16 d/yr by 30 yrs out
- Wind 2/10 Low 100% chance of damaging wind over 30 yrs
- Air quality 2/10 Low 1 unhealthy d/yr today · 1 by 30 yrs out
Nearby sold comps map
Loading sold comps map…
Walkable amenities ~0.75 mi
Loading nearby amenities…
Taxation est. · year 1
- Rental income
- $79,272
- − Mortgage interest
- −$35,794
- − Property taxes
- −$9,585
- − Insurance
- −$3,195
- − Repairs & maintenance
- −$6,342
- − Management
- −$6,342
- − Depreciation
- −$18,589
- Taxable loss
- −$575
- Est. tax savings @ 24.0%
- +$138
- After-tax cash flow
- $9,771/yr
For passive investors: Depreciation is non-cash, so a rental often shows a tax loss while cash-flowing — sheltering income. Rental losses are passive: they offset passive income freely, and up to $25,000/yr can offset ordinary (W-2) income if you actively participate and your MAGI is under $100k (phasing out to $0 by $150k); unused losses carry forward. On sale, claimed depreciation is recaptured at up to 25%, and gains may owe capital-gains tax (a 1031 exchange can defer both). Figures are a year-1 estimate at your 24.0% rate — not tax advice; consult a CPA.
Schools (NCES district)
No district data.
Livability — Burlington
- Score
- 74/100
- State rank
- #19
- US rank
- #4619
Category grades
Schools grade is shown separately in the Schools card above.
Census & demographics
- Census place
- Burlington, VT
- County
- Chittenden County · 110,603 people
- City population
- 31,662
- Metro
- Burlington-South Burlington, VT
- Population (ZIP)
- 31,662
- Household income
- $65,657
- Rent vs Own
- Severe rent burden
- 2757.0
Population outlook (Chittenden County) Hauer SSP2
- Today (2025)
- 170,769 people
- By 2030
- 174,716 · +2.3%
- By 2040
- 180,337 · +5.6%
- By 2050
- 183,768 · +7.6%
- By 2075
- 194,646 · +14.0%
- By 2100
- 194,933 · +14.2%
Race, ethnicity, and origin ACS 2023
- Neighborhood character
- Predominantly White (84%)
- Race & ethnicity
- White 84% Two or more races 6% Asian 4% Black 4% Hispanic / Latino 4%
- Common ancestry
- Romanian 5% Lithuanian 5% Slovak 4%
- Foreign-born
- 7% · China, Canada, Vietnam
- Languages at home
- 90% English-only · Other Indo-European 2% French/Haitian/Cajun 2% Spanish 2%
Political lean MEDSL · Chittenden
- 2024 margin
- Solid D (+53.6) · D 75.4% · R 21.7% · Other 2.9%
- 2008→2024 swing
- +8.9pp toward D · 2008: 44.8pp · 2024: 53.6pp
- All cycles
- 2024: D+53.6 2020: D+54.5 2016: D+46.8 2012: D+41.9 2008: D+44.8
Not yet ingested
- Civics
- —
Market trends
- HPI YoY
- ▼ -316.87%
- Current HPI
- 352.2081
- Rent YoY
- ▲ 0.52%
- Metro
- Burlington-South Burlington, VT
- State GDP YoY
- —
- F500 in state
- 0
Price history
+38049.3% since first listed7 events — show timeline
- 2026-06-12 Listed $639,000 PrimeMLS
- 2024-03-14 Rental Removed $1,675 APPFOLIO
- 2024-01-05 Price Changed $1,675 APPFOLIO
- 2023-12-15 Listed for Rent — APPFOLIO
- 2023-12-09 Rental Removed — APPFOLIO
- 2023-09-08 Listed for Rent — APPFOLIO
- 2023-09-02 Rental Removed — APPFOLIO
Cash-flow waterfall
monthlySold comps — $/sqft
last 12 mo · ≤1 miLoading sold comps…