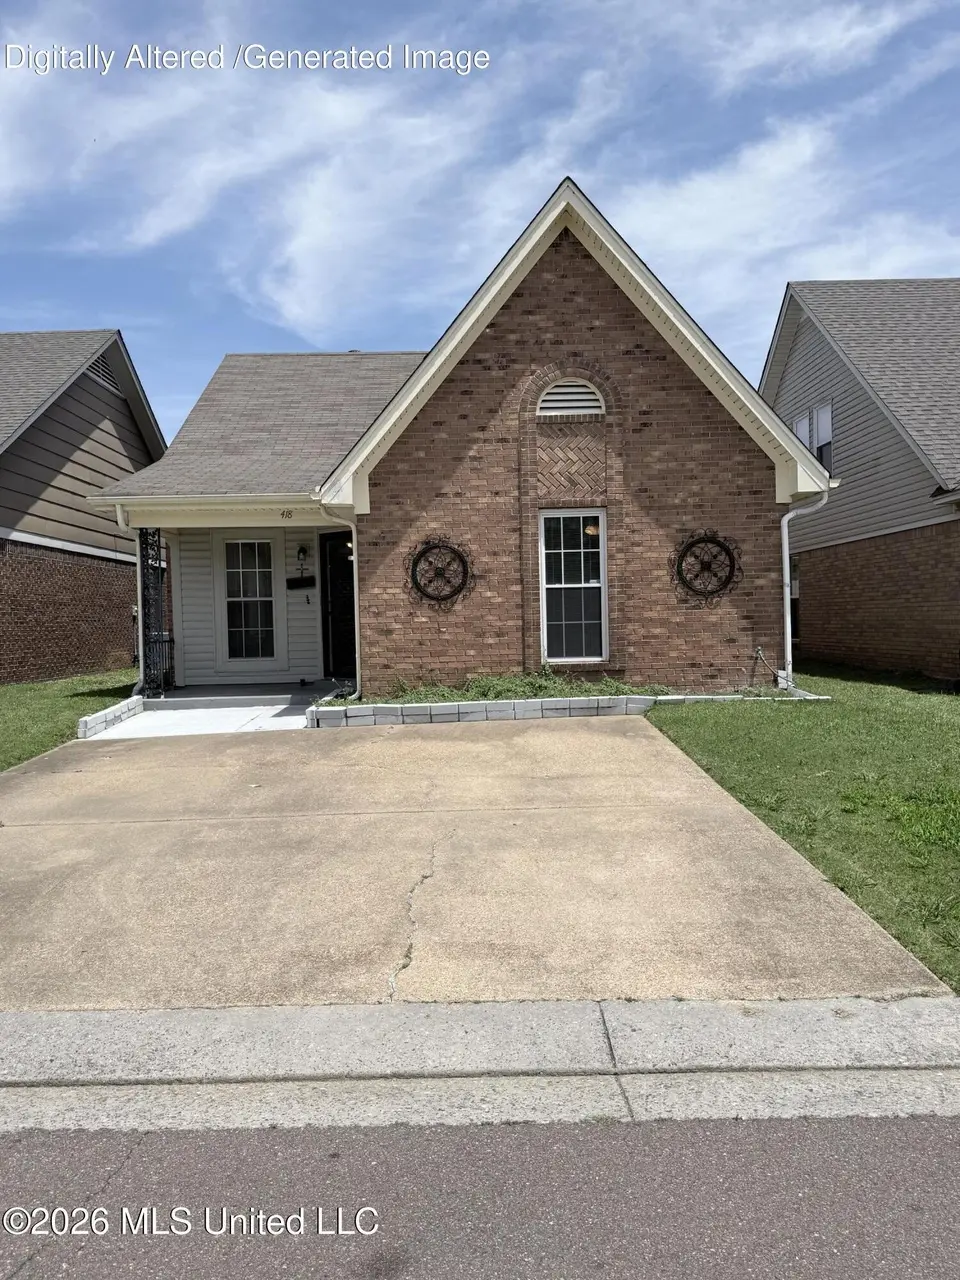
418 Carol Ann Cv · Southaven, MS
Flood risk 1/10 · Minimal
- FEMA flood zone
- X (unshaded)
- Chance of flooding over 30 yrs
- 0.0%
- Est. flood insurance / yr
- $507 – $1,088
Fire risk 1/10 · Minimal
- Est. fire insurance / yr
- $1,241 – $2,305
Heat risk 6/10 · Moderate
- Hot days now (above 109°F)
- 7 days/yr
- Hot days in 30 yrs
- 21 days/yr
Wind risk 4/10 · Minor
- Chance of severe wind over 30 yrs
- 20.0%
Air-quality risk 2/10 · Minimal
- Unhealthy air days now
- 2 days/yr
- Unhealthy air days in 30 yrs
- 2 days/yr
Risk factors via First Street. Map © Google.
Why this score? — see what drove the D- grade
The composite is a weighted blend of 9 inputs, each scored 0–100. Each bar is that input's sub-score; the figure is the points it added to the 100-point composite (weight × sub-score).
- Cash flow +11.6/30.0
- ARV discount +8.0/15.0
- Schools +4.0/10.0
- DSCR +3.4/10.0
- Rent growth +3.3/5.0
- Livability +3.2/5.0
- 1% rule +2.6/10.0
- Condition / age +2.5/5.0
- Appreciation +0.0/10.0
$205,500
🖨 Deal sheet 📄 Offer letter ✓ Due diligence
Listing remarks MLS
Great Water Front Property! This home features two bedrooms and two bathrooms. The open living room and dining room invites you in upon arrival. A side-by-side stainless steel refrigerator welcomes you into the galley kitchen showcasing the stainless steel free standing electric range and the new stainless steel dishwasher. LVP replaced throughout, fresh paint (kitchen and living room), new countertops, and new appliances.
Key facts
- Water front property
- Galley kitchen
- New appliances
Tags
Neighborhood map
What this means for you Summary
Snapshot
- This is a 2-bed/2.0-bath single-family listed at $206k.
Deal economics
- At list price, monthly cash flow is $-62 ($-748/yr) — negative.
- To cash-flow at today's rent, offer at most $194k (5.4% below list).
- To meet the 1% rule (rent ≥ 1% of price), the offer needs to be $156k (24.2% below list).
- Recommended offer: $156k (24.2% below list) — sets the bar for 1% rule.
Location & tenants
- Location reads 65/100 on livability (#107 in MS) — a middle-class / working-renter tenant base. Strengths: cost of living A+, housing A+; Watch: schools D+, amenities F, commute F.
- Desoto County School District (suburban): math 48% / reading 42% proficiency, ranked #20 of 130 in MS (top 15%) — families likely to look elsewhere, expect single-tenant / working-renter base with shorter leases.
- Market conditions: Rents rising (+3.2%/yr); 193 active listings in the ZIP; 25 comparable units currently listed for rent nearby; rentals at typical pace (median 20d on market — plan ~3-4 weeks tenant-placement turnaround); 1,155 units permitted in DeSoto County in 2024 (0 in 5+ unit buildings).
- This rent runs 30% of the median local income ($62k/yr) — at the standard rent-burdened threshold; future hikes will face affordability resistance.
Forward outlook
- Local home prices are declining (-3.0%/yr); year-one equity from $1k of loan paydown is wiped out by about $6k of value loss. Plan a longer hold.
- DeSoto County population projected at +33% by 2050 — long-run rental-demand tailwind backs the buy-and-hold thesis.
Negotiation context
- It's been on market 213 days — a 12% lower offer ($181k) is reasonable based on typical stale-listing flexibility.
- 2 sale attempts since 3y ago; this cycle's ask has dropped $20k (9%) from the opening price — seller is motivated, your offer sets the floor, not the list.
Risks & watch-outs
- Climate carrying-cost: extreme-heat days projected 7→21/yr by 2055 (HVAC capex compounding) — expect insurance premiums to compound above CPI over the hold.
Questions for the listing agent
- What do current leases actually rent for vs. the listed asking? Can we see a recent rent roll and the last 12 months of T-12 income?
- It's been on market 213 days. Have you received any prior offers? Is the seller open to a 24% concession, seller financing, or rate buy-down credit?
- What does the HOA fee cover, when was the last increase, and are there any pending special assessments or reserve-fund shortfalls?
- Why hasn't it sold? Are there any deal-killer items the seller is aware of (foundation, flood, title, zoning, code violations)?
- Is there a deadline driving the sale (1031 exchange, divorce, estate, relocation)? That informs how much negotiation room exists.
- Schools are D-rated, which usually means shorter tenancies and higher turnover. Who's the typical renter profile here, and what's been the actual vacancy rate?
- The area grade is low — what's the realistic commute time and amenity access for the typical tenant pool here? Any planned neighborhood developments (good or bad) we should know about?
- What's the average days-on-market for RENTAL listings here right now (not sales)? A rising rental-DOM trend means longer vacancies and softer asking-rent achievability than the comps imply.
- What's the recent tenant-quality profile in this submarket — average credit score on applications, eviction rate, late-payment / NSF rate, and stable-employment percentage? A property-management company in the area should have these aggregated.
- How much new for-sale + rental construction is in the pipeline within 1–3 miles? Heavy new supply typically softens prices + rents 12–24 months out; constrained supply supports both.
Investment metrics
- 1% rule
- 0.76% ✗
- Cap rate
- 5.93%
- Cash-on-cash
- -1.30%
- DSCR
- 0.94
- GRM
- 11.0
CMA / ARV
- ARV (median comp)
- $207,824
- List price
- $205,500
- Delta
- -1.12%
- Verdict
- FAIR
- Comps
- 20 within 1.0 mi
Show comp detail 12 sales within ~0.75 mi
| Address | Dist | Beds/Ba | Sqft | Sold | Price | $/sf | Match |
|---|---|---|---|---|---|---|---|
| 167 Tackett Run | 0.25mi | 2/2.0 | 1,160 (-5%) | 9mo | $199,900 | $172 | 73 |
| 7588 Lilly Dr | 0.39mi | 2/2.0 | 1,200 (-2%) | 8mo | $215,000 | $179 | 72 |
| 7181 Lynnease Dr | 0.32mi | 3/2.0 (+1) | 1,210 (-1%) | 10mo | $199,000 | $164 | 70 |
| 7629 Iris Dr | 0.44mi | 2/2.0 | 1,121 (-8%) | 3mo | $209,900 | $187 | 63 |
| 757 Greencliff Dr | 0.33mi | 3/2.0 (+1) | 1,342 (+10%) | 2mo | $255,000 | $190 | 62 |
| 7640 Iris Dr | 0.44mi | 2/2.0 | 1,100 (-10%) | 2mo | $199,900 | $182 | 61 |
| 6742 Beaumont Cir | 0.51mi | 3/2.0 (+1) | 1,160 (-5%) | 6mo | $229,900 | $198 | 58 |
| 967 Greencliff Dr | 0.52mi | 3/2.0 (+1) | 1,284 (+5%) | 8mo | $209,000 | $163 | 56 |
| 7633 Iris Dr | 0.45mi | 2/2.0 | 1,100 (-10%) | 12mo | $200,000 | $182 | 53 |
| 7395 White Ash Dr | 0.35mi | 3/2.0 (+1) | 1,388 (+14%) | 6mo | $224,900 | $162 | 51 |
| 719 White Ash Dr | 0.55mi | 3/2.0 (+1) | 1,364 (+12%) | 2mo | $202,000 | $148 | 48 |
| 629 Eaglewood Dr | 0.41mi | 3/2.0 (+1) | 1,390 (+14%) | 12mo | $214,900 | $155 | 43 |
Match score weights: distance 35% · size 25% · config 20% · recency 20%. Top-matched comps best support the ARV.
Projected returns pro-forma
-3.0% appreciation · 3.2% rent growth · sell at horizon
- IRR
- -18.3%
- Equity multiple
- 0.36×
- Total profit
- $-37,008
- Equity at exit
- $30,641
- IRR
- -10.3%
- Equity multiple
- 0.37×
- Total profit
- $-36,264
- Equity at exit
- $17,768
Cash invested: $57,540 (down + closing). Projections, not guarantees.
Landlord ↔ Tenant lean methodology
- Overall (STATE)
- 90 Strongly Landlord-Friendly
- State Mississippi
- 90 Strongly Landlord-Friendly · R+11
- County
- — inherits STATE
- City
- — inherits STATE
ZIP-level market 38671
- Home prices YoY
- -18.2%
- Rents YoY
- 3.2%
- Active inventory
- 193
- Price-to-rent
- 11.0×
Monthly cashflow live
- Estimated rent
- $1,558 high interval (Pro) →
- Mortgage (P&I)
- −$1,078
- Tax from tax record
- −$113 /mo · $1,362/yr
- Insurance
- −$86
- HOA
- −$16
- Vacancy / Maint / Mgmt
- −$327
- Net cashflow
- $-62
Break-even live
UW: 25.0% down · 7.5% · 30yr · 1.5% tax · 5.0% vac · 8.0% maint · 8.0% mgmt
Financing live
Cash to close
- Down payment
- $51,375
- Closing costs
- $6,165
- Reserves months
- —
- Total cash needed
- —
Loan-product check · same deal, 3 products live
Conventional
25% down · 7.5% · 30yr
- Down + closing
- —
- Monthly P&I
- —
- Monthly cashflow
- —
- DSCR
- —
- Eligible?
- —
Personal DTI + credit; lowest rate.
DSCR
20% down · 8.5% · 30yr
- Down + closing
- —
- Monthly P&I
- —
- Monthly cashflow
- —
- DSCR
- —
- Eligible?
- —
No personal income docs; deal must DSCR.
Hard money
10% down · 12.0% · 12mo
- Down + closing
- —
- Monthly P&I
- —
- Monthly cashflow
- —
- DSCR
- —
- Eligible?
- —
Short-term bridge; refi at stabilization.
Rent comps 25 comps
| Address | Beds | Baths | Sqft | Rent | $/sqft | DOM | Units | Dist |
|---|---|---|---|---|---|---|---|---|
| 330 Avery Jordan Cv Southaven, MS | 3.0 | 2.0 | 1221 | $1,605 | $1.31 | 4d | 1 | 0.11mi |
| 371 Alex Cv Southaven, MS | 3.0 | 2.0 | 1300 | $1,595 | $1.23 | 2d | 1 | 0.17mi |
| 7187 Gazebo Dr Southaven, MS | 2.0 | 2.0 | 1026 | $1,450 | $1.41 | 14d | 1 | 0.25mi |
| 7456 Overlook Dr Southaven, MS | 2.0 | 2.0 | 1212 | $1,550 | $1.28 | 43d | 1 | 0.29mi |
| 7654 Stonycreek Cv Southaven, MS | 3.0 | 2.0 | 1293 | $1,650 | $1.28 | 21d | 1 | 0.57mi |
| 7711 Iris Cv Southaven, MS | 3.0 | 2.0 | 1284 | $1,710 | $1.33 | 3d | 1 | 0.59mi |
| 1104 Atterbury Cir S Southaven, MS | 3.0 | 2.0 | 1366 | $1,660 | $1.22 | 43d | 1 | 0.70mi |
| 8061 Creekwood Cir W Southaven, MS | 2.0 | 1.5 | 1300 | $1,550 | $1.19 | 17d | 1 | 0.83mi |
| 769 Barrington Woods Cv Unit 6 Southaven, MS | 2.0 | 2.0 | 1100 | $1,345 | $1.22 | 23d | 1 | 0.85mi |
| 817 Barrington Woods Cv Southaven, MS | 2.0 | 1.5 | 1176 | $1,395 | $1.19 | 14d | 1 | 0.86mi |
| 8085 Creekwood Cir E Southaven, MS | 2.0 | 2.0 | 1000 | $1,600 | $1.60 | 43d | 1 | 0.86mi |
| 818 Barrington Woods Cv Unit 769-6 Southaven, MS | 2.0 | 2.0 | 1100 | $1,345 | $1.22 | 23d | 1 | 0.88mi |
| 818 Barrington Woods Cv Unit 817 Southaven, MS | 2.0 | 1.5 | 1176 | $1,395 | $1.19 | 14d | 1 | 0.88mi |
| 8082 Whitebrook Dr Southaven, MS | 3.0 | 1.0 | 1100 | $1,495 | $1.36 | 23d | 1 | 1.06mi |
| 8375 Old Forge Rd Southaven, MS | 3.0 | 2.0 | 1080 | $1,295 | $1.20 | 4d | 1 | 1.18mi |
| 863 Hackberry Dr Southaven, MS | 3.0 | 2.0 | 1500 | $1,665 | $1.11 | 3d | 1 | 1.23mi |
| 875 Hackberry Dr Southaven, MS | 3.0 | 2.0 | 1283 | $1,525 | $1.19 | 21d | 1 | 1.23mi |
| 5910 Garden Walk E Southaven, MS | 2.0 | 2.0 | 1157 | $1,495 | $1.29 | 23d | 1 | 1.28mi |
| 5 Nail Rd Southaven, MS | 1.0 | 1.0 | 1100 | $1,541 | $1.40 | 21d | 1 | 1.32mi |
| 970 Millcreek Pl Southaven, MS | 3.0 | 2.0 | 1253 | $1,550 | $1.24 | 14d | 1 | 1.34mi |
| 8254 Pinebrook Dr Southaven, MS | 3.0 | 1.0 | 1095 | $1,385 | $1.26 | 43d | 1 | 1.37mi |
| 845 Rockwall Cv Southaven, MS | 3.0 | 1.5 | 1229 | $1,450 | $1.18 | 43d | 1 | 1.40mi |
| 8035 Park Pike Dr Southaven, MS | 3.0 | 2.0 | 1340 | $1,695 | $1.26 | 3d | 1 | 1.41mi |
| 1688 Sarah Ann Dr W Southaven, MS | 3.0 | 2.0 | 1430 | $1,695 | $1.19 | 20d | 1 | 1.42mi |
| 7896 Nature Walk Dr Southaven, MS | 3.0 | 2.0 | 1428 | $1,705 | $1.19 | 14d | 1 | 1.48mi |
HOA detail
- Monthly dues
- $16 · $192/yr
- Likely covers
- waterelectric
Listing history 22 events
-
2026-06-18days on market $205,500 Active 213 DOM
-
2026-06-17days on market $205,500 Active 212 DOM
-
2026-06-16days on market $205,500 Active 211 DOM
-
2026-06-15days on market $205,500 Active 210 DOM
-
2026-06-13days on market $205,500 Active 208 DOM
-
2026-06-10days on market $205,500 Active 205 DOM
-
2026-06-09days on market $205,500 Active 204 DOM
-
2026-06-08days on market $205,500 Active 203 DOM
-
2026-06-07days on market $205,500 Active 202 DOM
-
2026-06-03days on market $205,500 Active 198 DOM
-
2026-06-02days on market $205,500 Active 197 DOM
-
2026-06-01days on market $205,500 Active 196 DOM
-
2026-05-31days on market $205,500 Active 195 DOM
-
2026-05-11price $205,500 426-char remark
Show marketing remark (426 chars)
Great Water Front Property! This home features two bedrooms and two bathrooms. The open living room and dining room invites you in upon arrival. A side-by-side stainless steel refrigerator welcomes you into the galley kitchen showcasing the stainless steel free standing electric range and the new stainless steel dishwasher. LVP replaced throughout, fresh paint (kitchen and living room), new countertops, and new appliances.
-
2026-02-05price $219,900 426-char remark
Show marketing remark (426 chars)
Great Water Front Property! This home features two bedrooms and two bathrooms. The open living room and dining room invites you in upon arrival. A side-by-side stainless steel refrigerator welcomes you into the galley kitchen showcasing the stainless steel free standing electric range and the new stainless steel dishwasher. LVP replaced throughout, fresh paint (kitchen and living room), new countertops, and new appliances.
-
2025-11-17$225,000 Active 426-char remark
Show marketing remark (426 chars)
Great Water Front Property! This home features two bedrooms and two bathrooms. The open living room and dining room invites you in upon arrival. A side-by-side stainless steel refrigerator welcomes you into the galley kitchen showcasing the stainless steel free standing electric range and the new stainless steel dishwasher. LVP replaced throughout, fresh paint (kitchen and living room), new countertops, and new appliances.
-
2023-02-17soldstatus
-
2023-02-16soldstatus Closed 112-char remark
Show marketing remark (112 chars)
Waterfront Patio home - Cute 2BR/2BA, home with covered patio to relax and watch the ducks and catch a fish too!
-
2023-01-18status Pending 112-char remark
Show marketing remark (112 chars)
Waterfront Patio home - Cute 2BR/2BA, home with covered patio to relax and watch the ducks and catch a fish too!
-
2023-01-11$179,900 Active 112-char remark
Show marketing remark (112 chars)
Waterfront Patio home - Cute 2BR/2BA, home with covered patio to relax and watch the ducks and catch a fish too!
-
2001-03-28soldstatus
-
1999-06-07soldstatus
ⓘ Source: listings_history table (triggers on properties + properties_extension) + one-shot
backfill from property_details.listing_events for pre-trigger history.
Tax reassessment forecast MS · Resets to sale price
- Current annual tax
- $1,362 · $113/mo
- Projected year-2 tax
- $1,623 · $135/mo
- Expected delta
- +$261/yr (+$22/mo · 19.2%)
ⓘ Screening estimate from a state-policy table — verify with the county assessor before closing.
Climate risk First Street
- Flood 1/10 Low FEMA zone X (unshaded) · 0% chance over 30 yrs
- Wildfire 1/10 Low
- Heat 6/10 Major 7 d/yr ≥109°F today · 21 d/yr by 30 yrs out
- Wind 4/10 Moderate 20% chance of damaging wind over 30 yrs
- Air quality 2/10 Low 2 unhealthy d/yr today · 2 by 30 yrs out
Nearby sold comps map
Loading sold comps map…
Walkable amenities ~0.75 mi
Loading nearby amenities…
Taxation est. · year 1
- Rental income
- $18,691
- − Mortgage interest
- −$11,511
- − Property taxes
- −$1,362
- − Insurance
- −$1,028
- − Repairs & maintenance
- −$1,495
- − Management
- −$1,495
- − HOA
- −$192
- − Depreciation
- −$5,978
- Taxable loss
- −$4,370
- Est. tax savings @ 24.0%
- +$1,049
- After-tax cash flow
- $301/yr
For passive investors: Depreciation is non-cash, so a rental often shows a tax loss while cash-flowing — sheltering income. Rental losses are passive: they offset passive income freely, and up to $25,000/yr can offset ordinary (W-2) income if you actively participate and your MAGI is under $100k (phasing out to $0 by $150k); unused losses carry forward. On sale, claimed depreciation is recaptured at up to 25%, and gains may owe capital-gains tax (a 1031 exchange can defer both). Figures are a year-1 estimate at your 24.0% rate — not tax advice; consult a CPA.
Schools (NCES district)
- District
- Desoto County School District
- NCES district ID
- 2801320
- Math proficiency
- 48% ▼ -13.00%
- Reading proficiency
- 42% ▼ -6.00%
- Median HH income
- $59,272
- Composite
- 39.56/100
- National rank
- #3933
- State rank
- #20 of 130 in MS
Livability — Southaven
- Score
- 65/100
- State rank
- #107
- US rank
- #12584
Category grades
Schools grade is shown separately in the Schools card above.
Census & demographics
- Census place
- Southaven, MS
- County
- DeSoto County · 176,513 people
- City population
- 53,755
- Metro
- Memphis, TN-MS-AR
- Population (ZIP)
- 37,319
- Household income
- $61,843
- Rent vs Own
- Severe rent burden
- 1583.0
Population outlook (DeSoto County) Hauer SSP2
- Today (2025)
- 203,338 people
- By 2030
- 217,692 · +7.1%
- By 2040
- 245,320 · +20.6%
- By 2050
- 270,133 · +32.8%
- By 2075
- 323,341 · +59.0%
- By 2100
- 348,742 · +71.5%
Race, ethnicity, and origin ACS 2023
- Neighborhood character
- Diverse neighborhood (Simpson 0.58)
- Race & ethnicity
- White 49% Black 42% Hispanic / Latino 6% Two or more races 4%
- Hispanic origin (detail)
- Mexican 3%
- Common ancestry
- Italian 1% Lithuanian 1% Serbian 1%
- Foreign-born
- 3% · Canada
- Languages at home
- 95% English-only · Spanish 4%
Political lean MEDSL · DeSoto
- 2024 margin
- Strong R (+24.1) · D 36.7% · R 60.8% · Other 2.5%
- 2008→2024 swing
- +14.2pp toward D · 2008: -38.2pp · 2024: -24.1pp
- All cycles
- 2024: R+24.1 2020: R+23.9 2016: R+34.8 2012: R+33.5 2008: R+38.2
Not yet ingested
- Civics
- —
Market trends
- HPI YoY
- ▼ -49.08%
- Current HPI
- 220.7875
- Rent YoY
- ▲ 3.20%
- Metro
- Memphis, TN-MS-AR
- State GDP YoY
- —
- F500 in state
- 0
Price history
+14.2% since first listed9 events — show timeline
- 2026-05-11 Price Changed $205,500 MLSU
- 2026-02-05 Price Changed $219,900 MLSU
- 2025-11-17 Listed $225,000 MLSU
- 2023-02-17 Sold (Public Records) — Public Records
- 2023-02-16 Sold (MLS) — MLSU
- 2023-01-18 Pending — MLSU
- 2023-01-11 Listed $179,900 MLSU
- 2001-03-28 Sold (Public Records) — Public Records
- 1999-06-07 Sold (Public Records) — Public Records
Property tax history
+30.5%/yrLatest (2025): $1,362 · +10.1% YoY. Source: county tax records.
Cash-flow waterfall
monthlySold comps — $/sqft
last 12 mo · ≤1 miLoading sold comps…