6321 Roberts Dr · Victor, NY
Flood risk 1/10 · Minimal
- FEMA flood zone
- X
- Chance of flooding over 30 yrs
- 0.0%
- Est. flood insurance / yr
- $507 – $1,088
Fire risk 3/10 · Minor
- Est. fire insurance / yr
- $691 – $1,283
Heat risk 3/10 · Minor
- Hot days now (above 97°F)
- 7 days/yr
- Hot days in 30 yrs
- 17 days/yr
Wind risk 1/10 · Minimal
- Chance of severe wind over 30 yrs
- —
Air-quality risk 2/10 · Minimal
- Unhealthy air days now
- 0 days/yr
- Unhealthy air days in 30 yrs
- 1 days/yr
Risk factors via First Street. Map © Google.
Why this score? — see what drove the B- grade
The composite is a weighted blend of 9 inputs, each scored 0–100. Each bar is that input's sub-score; the figure is the points it added to the 100-point composite (weight × sub-score).
- Cash flow +28.6/30.0
- DSCR +10.0/10.0
- 1% rule +7.9/10.0
- ARV discount +6.7/15.0
- Schools +5.2/10.0
- Livability +4.0/5.0
- Condition / age +3.8/5.0
- Rent growth +2.5/5.0
- Appreciation +0.0/10.0
$189,900
🖨 Deal sheet (PDF) 📄 Offer letter ✓ Due diligence
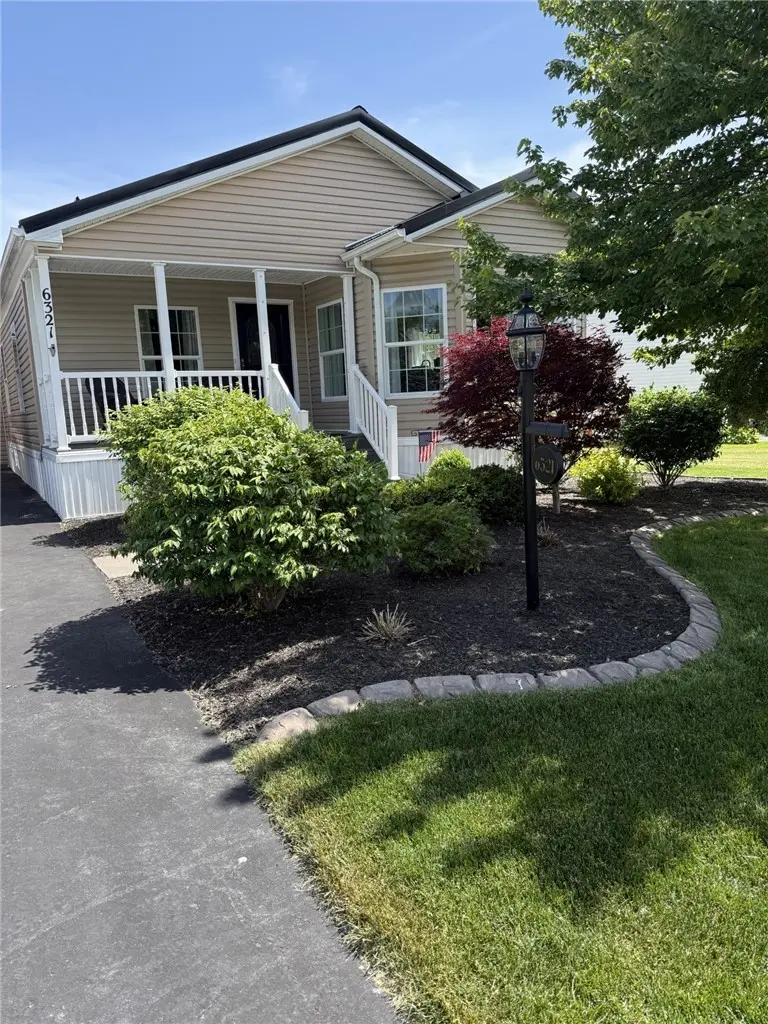
Listing remarks
Beautifully maintained home in the most popular area of the Gypsum Mills Community. The home is located towards the back of the community with forever wild and a pond across the street you can enjoy on the covered porch. Enter through the front door to the foyer with a coat closet. The eat-in Kitchen is very spacious with large bay windows, a brick arch over the oven/range, oversized window above the sink and tons of cabinets. The formal Dining Room has room for a 6-8 person table and a hutch or side board. The Living Room has plenty of room for a large sectional. The 3rd Bedroom is near the Living Room and is now utilized as an Office. There is another Bedroom, Bathroom, Laundry Room and a
Key facts
- 2 garage spots
- Community pool
- Built 2010
Neighborhood map
What this means for you Summary
Snapshot
- This is a 3-bed/2.0-bath manufactured listed at $190k. Condition is rated good.
Deal economics
- At list price, monthly cash flow is $627 ($8k/yr) — positive.
- The deal already cash-flows at list — no discount required.
- Meets the 1% rule at list price ($2k rent vs $190k).
- Cap rate 10.3% vs local median 2.6% in Victor — top-decile yield for the area; either an underpriced asset or a hidden risk that comps aren't pricing in. Stress-test before assuming the spread holds.
Location & tenants
- Location reads 79/100 on livability (#122 in NY, #1,991 nationally) — a middle-class / working-renter tenant base. Strengths: schools A+, employment A+, housing A+; Watch: amenities F, commute F.
- Victor Central School District (suburban): math 56% / reading 62% proficiency, ranked #222 of 590 in NY (top 38%) — acceptable for families but not a draw, mixed tenant base, ~2y average lease; only 12% free/reduced lunch — higher-income household profile.
- Market conditions: 110 active listings in the ZIP; 2 comparable units currently listed for rent nearby; high-income renter base; 284 units permitted in Ontario County in 2024 (69 in 5+ unit buildings).
Forward outlook
- Local home prices are declining (-3.0%/yr); year-one equity from $1k of loan paydown is wiped out by about $6k of value loss. Plan a longer hold.
- Ontario County population projected to shrink 6% by 2050 — rents likely to lag national; underwrite the cash flow, not the appreciation.
- At projected returns (-3.0% appreciation + 3.0% rent growth), your $53k cash investment doubles in ~9 years — after that, you're playing with house money.
Negotiation context
- Only 0 days on market — expect competitive offers; lowballing is unlikely to land.
Questions for the listing agent
- Is there a deadline driving the sale (1031 exchange, divorce, estate, relocation)? That informs how much negotiation room exists.
- Schools are A-rated — typically a magnet for longer-tenancy family renters. What's the average tenant stay here, and is there a school-zone premium baked into asking?
- What's the average days-on-market for RENTAL listings here right now (not sales)? A rising rental-DOM trend means longer vacancies and softer asking-rent achievability than the comps imply.
- What's the recent tenant-quality profile in this submarket — average credit score on applications, eviction rate, late-payment / NSF rate, and stable-employment percentage? A property-management company in the area should have these aggregated.
- How much new for-sale + rental construction is in the pipeline within 1–3 miles? Heavy new supply typically softens prices + rents 12–24 months out; constrained supply supports both.
Investment metrics
- 1% rule
- 1.29% ✓
- Cap rate
- 10.26%
- Cash-on-cash
- 14.15%
- DSCR
- 1.63
- GRM
- 6.4
CMA / ARV
- ARV (on-the-fly)
- $186,592
- Comps found
- 12
Show comp detail 12 sales within ~0.75 mi
| Address | Dist | Beds/Ba | Sqft | Sold | Price | $/sf | Match |
|---|---|---|---|---|---|---|---|
| 6330 Kims Dr | 0.20mi | 3/2.0 | 1,848 (-3%) | 6mo | $155,000 | $84 | 80 |
| 6300 Lambert St #535 | 0.16mi | 3/2.0 | 1,760 (-8%) | 1mo | $205,000 | $116 | 79 |
| 1015 Volkman Dr | 0.35mi | 3/2.0 | 1,848 (-3%) | 1mo | $196,000 | $106 | 78 |
| 999 Volkman Dr | 0.26mi | 3/2.0 | 1,782 (-6%) | 2mo | $160,000 | $90 | 76 |
| 6289 Lambert St | 0.11mi | 3/2.0 | 1,682 (-12%) | 2mo | $180,000 | $107 | 74 |
| 971 Gypsum Mills St #441 | 0.40mi | 3/2.0 | 1,720 (-10%) | 2mo | $128,500 | $75 | 63 |
| 6382 Roberts Dr | 0.41mi | 3/2.0 | 1,680 (-12%) | 2mo | $165,000 | $98 | 60 |
| 6349 Kims Dr | 0.35mi | 3/2.0 | 1,680 (-12%) | 7mo | $134,000 | $80 | 58 |
| 6393 Kims Dr Unit B144C | 0.52mi | 3/2.0 | 1,620 (-15%) | 1mo | $109,040 | $67 | 50 |
| 6371 Kims #349 | 0.48mi | 3/2.0 | 1,620 (-15%) | 6mo | $132,000 | $81 | 48 |
| 6341 Murphy Dr Unit C004 | 0.54mi | 3/2.0 | 1,620 (-15%) | 7mo | $161,350 | $100 | 44 |
| 6381 Roberts Dr | 0.71mi | 4/2.0 (+1) | 1,680 (-12%) | 7mo | $174,900 | $104 | 36 |
Match score weights: distance 35% · size 25% · config 20% · recency 20%. Top-matched comps best support the ARV.
Projected returns pro-forma
-3.0% appreciation · 3.0% rent growth · sell at horizon
- IRR
- 4.5%
- Equity multiple
- 1.17×
- Total profit
- $9,206
- Equity at exit
- $28,315
- IRR
- 14.0%
- Equity multiple
- 2.12×
- Total profit
- $59,597
- Equity at exit
- $16,419
Cash invested: $53,172 (down + closing). Projections, not guarantees.
Landlord ↔ Tenant lean methodology
- Overall (STATE)
- 15 Strongly Tenant-Friendly
- State New York
- 15 Strongly Tenant-Friendly · D+10
- County
- — inherits STATE
- City
- — inherits STATE
ZIP-level market 14564
- Home prices YoY
- -12.8%
- Active inventory
- 110
- Price-to-rent
- 6.4×
Monthly cashflow live
- Estimated rent
- $2,455 medium interval (Pro) →
- Mortgage (P&I)
- −$996
- Tax est. 1.5%
- −$237 /mo · $2,848/yr
- Insurance
- −$79
- HOA
- −$0
- Vacancy / Maint / Mgmt
- −$516
- Net cashflow
- $627
Break-even live
Sensitivity live
| Price | -10% $758 | -5% $693 | +0% $627 | +5% $561 | +10% $496 |
|---|---|---|---|---|---|
| Rent | -10% $433 | -5% $530 | +0% $627 | +5% $724 | +10% $821 |
| Rate | -1.0pp $723 | -0.5pp $675 | base $627 | +0.5pp $578 | +1.0pp $528 |
UW: 25.0% down · 7.5% · 30yr · 1.5% tax · 5.0% vac · 8.0% maint · 8.0% mgmt
Financing live
Cash to close
- Down payment
- $47,475
- Closing costs
- $5,697
- Reserves months
- —
- Total cash needed
- —
Loan-product check · same deal, 3 products live
Conventional
25% down · 7.5% · 30yr
- Down + closing
- —
- Monthly P&I
- —
- Monthly cashflow
- —
- DSCR
- —
- Eligible?
- —
Personal DTI + credit; lowest rate.
DSCR
20% down · 8.5% · 30yr
- Down + closing
- —
- Monthly P&I
- —
- Monthly cashflow
- —
- DSCR
- —
- Eligible?
- —
No personal income docs; deal must DSCR.
Hard money
10% down · 12.0% · 12mo
- Down + closing
- —
- Monthly P&I
- —
- Monthly cashflow
- —
- DSCR
- —
- Eligible?
- —
Short-term bridge; refi at stabilization.
Rent comps 2 comps
| Address | Beds | Baths | Sqft | Rent | $/sqft | DOM | Units | Dist |
|---|---|---|---|---|---|---|---|---|
| 6141 Cedar Creek Way Farmington, NY | 1.0–3.0 | 1.0–2.0 | 1272 | $2,375 | $1.87 | 3d | 17 | 0.63mi |
| 6316 Bentley Dr Victor, NY | 2.0 | 1.5 | 1500 | $2,400 | $1.60 | 24d | 1 | 1.27mi |
Listing history 2 events
-
2026-05-20$189,900
-
2026-05-20historical
ⓘ Source: listings_history table (triggers on properties + properties_extension) + one-shot
backfill from property_details.listing_events for pre-trigger history.
Climate risk First Street
- Flood 1/10 Low FEMA zone X · 0% chance over 30 yrs
- Wildfire 3/10 Moderate
- Heat 3/10 Moderate 7 d/yr ≥97°F today · 17 d/yr by 30 yrs out
- Wind 1/10 Low
- Air quality 2/10 Low 0 unhealthy d/yr today · 1 by 30 yrs out
Nearby sold comps map
Loading sold comps map…
Walkable amenities ~0.75 mi
Loading nearby amenities…
Taxation est. · year 1
- Rental income
- $29,460
- − Mortgage interest
- −$10,637
- − Property taxes
- −$2,848
- − Insurance
- −$950
- − Repairs & maintenance
- −$2,357
- − Management
- −$2,357
- − Depreciation
- −$5,524
- Taxable income
- $4,787
- Est. tax owed @ 24.0%
- −$1,149
- After-tax cash flow
- $6,376/yr
For passive investors: Depreciation is non-cash, so a rental often shows a tax loss while cash-flowing — sheltering income. Rental losses are passive: they offset passive income freely, and up to $25,000/yr can offset ordinary (W-2) income if you actively participate and your MAGI is under $100k (phasing out to $0 by $150k); unused losses carry forward. On sale, claimed depreciation is recaptured at up to 25%, and gains may owe capital-gains tax (a 1031 exchange can defer both). Figures are a year-1 estimate at your 24.0% rate — not tax advice; consult a CPA.
Condition & rehab AI · 2 photos
The home is in good condition with a good exterior and interior. Painting the exterior siding and upgrading the HVAC system would be the highest-ROI updates to increase its value.
Value-add opportunities
- Both Paint the exterior siding — Painting the exterior siding can improve the curb appeal and the home's overall appearance, which can increase its value for both resale and rental.
- Both Upgrade the HVAC system — Upgrading the HVAC system can improve energy efficiency and comfort, which can increase the home's value for both resale and rental.
- Both Add a front porch or landscaping — Adding a front porch or landscaping can enhance the home's curb appeal and increase its value for both resale and rental.
Renovation cost estimate screening
Value-add ROI direction
- Both Paint the exterior siding — Painting the exterior siding can improve the curb appeal and the home's overall appearance, which can increase its value for both resale and rental. ↑
- Both Upgrade the HVAC system — Upgrading the HVAC system can improve energy efficiency and comfort, which can increase the home's value for both resale and rental. ↑
- Both Add a front porch or landscaping — Adding a front porch or landscaping can enhance the home's curb appeal and increase its value for both resale and rental. ↑
ⓘ Cost ranges are severity-bucket heuristics (US national rule-of-thumb). Get contractor quotes + a written scope before underwriting a rehab budget.
Schools (NCES district)
- District
- Victor Central School District
- NCES district ID
- 3629640
- Math proficiency
- 56% ▼ -18.00%
- Reading proficiency
- 62% ▲ 3.00%
- Median HH income
- $73,046
- Composite
- 52.43/100
- National rank
- #1575
- State rank
- #222 of 590 in NY
Livability — Victor
- Score
- 79/100
- State rank
- #122
- US rank
- #1991
Category grades
Schools grade is shown separately in the Schools card above.
Census & demographics
- County
- Ontario County · 58,989 people
- City population
- 16,364
- Metro
- Rochester, NY
- Population (ZIP)
- 16,364
- Household income
- $115,625
- Rent vs Own
- Severe rent burden
- 357.0
Population outlook (Ontario County) Hauer SSP2
- Today (2025)
- 111,230 people
- By 2030
- 111,401 · +0.2%
- By 2040
- 109,535 · -1.5%
- By 2050
- 104,895 · -5.7%
- By 2075
- 92,999 · -16.4%
- By 2100
- 73,723 · -33.7%
Race, ethnicity, and origin ACS 2023
- Neighborhood character
- Predominantly White (89%)
- Race & ethnicity
- White 89% Two or more races 4% Hispanic / Latino 4% Asian 4% Black 1%
- Common ancestry
- Romanian 6% Iranian 3% Lithuanian 2%
- Foreign-born
- 7% · South Korea, Canada
- Languages at home
- 92% English-only · Other Indo-European 4% Spanish 1% German/W. Germanic 1%
Political lean MEDSL · Ontario
- 2024 margin
- Toss-up / Even · D 49.4% · R 50.6%
- 2008→2024 swing
- -1.0pp toward R · 2008: -0.1pp · 2024: -1.2pp
- All cycles
- 2024: R+1.2 2020: R+0.0 2016: R+8.6 2012: R+1.6 2008: R+0.1
Not yet ingested
- Civics
- —
Market trends
- HPI YoY
- ▼ -40.90%
- Current HPI
- 279.9821
- Rent YoY
- —
- Metro
- Rochester, NY
- State GDP YoY
- ▲ 2.60%
- F500 in state
- 92
Industry mix (Fortune 500 HQ in NY)
| Industry | F500 HQs | Revenue |
|---|---|---|
| Financial Services | 10 | $950B |
|
||
| Consumer Goods | 9 | $162B |
|
||
| Insurance | 4 | $225B |
|
||
| Telecommunications | 2 | $144B |
|
||
| Pharmaceuticals | 2 | $112B |
|
||
| Media / Entertainment | 2 | $69B |
|
||
Price history
2 events — show timeline
- 2026-05-20 Listing Removed — UNYREIS
- 2026-05-20 Listed $189,900 UNYREIS
Cash-flow waterfall
monthlySold comps — $/sqft
last 12 mo · ≤1 miLoading sold comps…