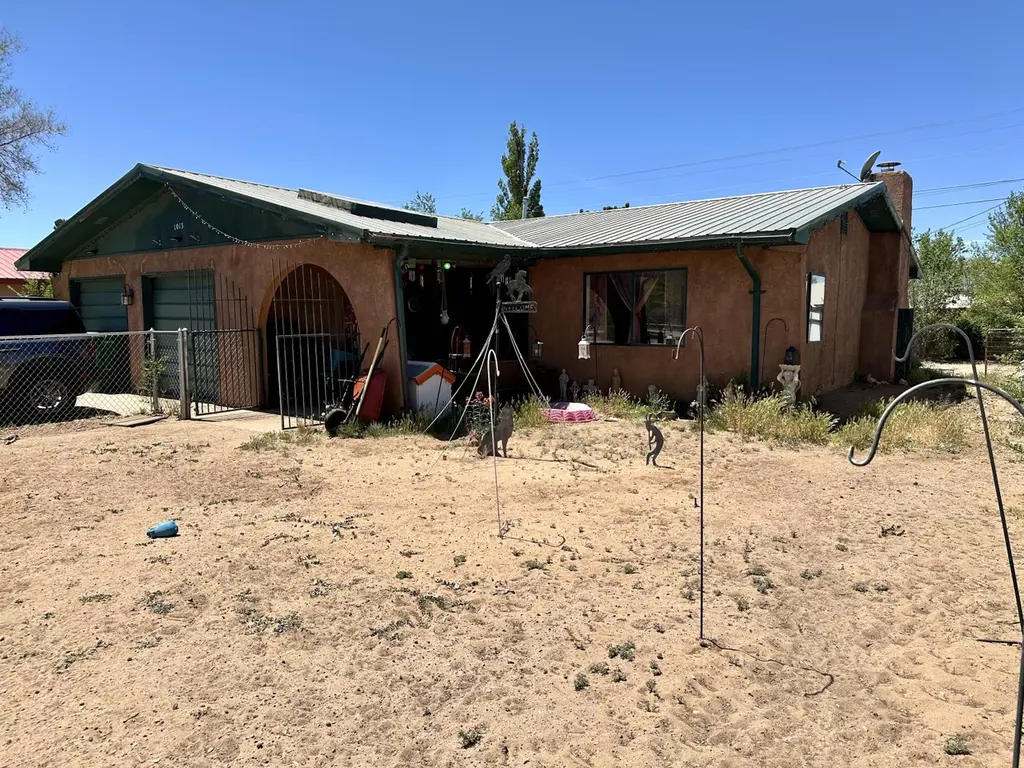
1013 Elm Dr · Grants, NM
Flood risk 1/10 · Minimal
- FEMA flood zone
- X (unshaded)
- Chance of flooding over 30 yrs
- 0.0%
- Est. flood insurance / yr
- $507 – $1,088
Fire risk 4/10 · Minor
- Est. fire insurance / yr
- $706 – $1,312
Heat risk 3/10 · Minor
- Hot days now (above 92°F)
- 7 days/yr
- Hot days in 30 yrs
- 18 days/yr
Wind risk 1/10 · Minimal
- Chance of severe wind over 30 yrs
- —
Air-quality risk 1/10 · Minimal
- Unhealthy air days now
- 0 days/yr
- Unhealthy air days in 30 yrs
- 0 days/yr
Risk factors via First Street. Map © Google.
Why this score? — see what drove the D+ grade
The composite is a weighted blend of 9 inputs, each scored 0–100. Each bar is that input's sub-score; the figure is the points it added to the 100-point composite (weight × sub-score).
- Cash flow +20.5/30.0
- ARV discount +7.5/15.0
- DSCR +6.5/10.0
- 1% rule +5.4/10.0
- Livability +3.0/5.0
- Rent growth +2.5/5.0
- Condition / age +2.5/5.0
- Schools +1.8/10.0
- Appreciation +0.0/10.0
$120,000
🖨 Deal sheet (PDF) 📄 Offer letter ✓ Due diligence
Listing remarks
Charming 3 BR, 2 bath home with 2 car garage located in a convenient Grants, NM location with plenty of potential and long-term value. Features a functional layout, spacious yard, and solid bones ready for your personal touch. Ideal for a primary residence, second home, or addition to a rental portfolio. Located near schools, shopping, dining, and major road access. A great opportunity to create something special while building equity in an established neighborhood.
Key facts
- Spacious yard
- Near schools
- Solid bones
Tags
Property features AI
Exterior
- Parking: Attached garage with 2 parking spaces
- Utilities: Electricity connected; Natural gas connected; Public water; Public sewer
- Home design: Single-story home; Faces east; Resale property
- Construction: Stucco exterior; Metal pitched roof; Concrete perimeter foundation
- Exterior features: Shed(s)
Interior
- Kitchen: Dishwasher; Free‑standing gas range; Microwave; Refrigerator
- Bedrooms: Primary bedroom on the main level
- Flooring: Carpet; Laminate; Tile
- Bathrooms: One full bathroom; One three-quarter bathroom
- Heating & cooling: Natural gas heating; Evaporative cooling
- Interior features: Main-level primary bedroom; Double-pane insulated windows; Carpet, laminate and tile flooring; Wood-burning fireplace
- Laundry & utility: Washer hookup; Electric dryer hookup; Gas dryer hookup
Neighborhood map
What this means for you Summary
Snapshot
- This is a 3-bed/2.0-bath other listed at $120k.
Deal economics
- At list price, monthly cash flow is $158 ($2k/yr) — positive.
- The deal already cash-flows at list — no discount required.
- Meets the 1% rule at list price ($1k rent vs $120k).
- Recommended offer: $116k (3.0% below list) — sets the bar for market timing.
Location & tenants
- Location reads 60/100 on livability (#115 in NM) — a middle-class / working-renter tenant base. Strengths: cost of living A+, housing A+; Watch: health & safety C-, crime D+, employment D.
- Grants-Cibola County Schools (town): math 14% / reading 22% proficiency, ranked #74 of 95 in NM (top 78%) — low school quality limits family demand, transient renter base, plan for 1-2y turnover; 70% free/reduced lunch — lower-income household profile, screen leases tightly.
- Zoned schools: Mount Taylor Elementary (math 24% / reading 75%, grade D+, #17 of 68 statewide, top 34%, 413 students, 100% FRL); Los Alamitos Middle (418 students, 100% FRL); Grants High (843 students, 100% FRL) — zoned schools average 100% FRL vs 70% district-wide (30 pts higher); higher-poverty schools than district average — tighter screening recommended.
- Zoned-school proficiency averages 50% at this address vs 18% district-wide (+32 pts) — the actual schools serving this property are materially stronger than the Grants-Cibola County Schools average implies; a family-tenant draw the district grade alone would hide.
- Market conditions: 76 active listings in the ZIP.
Forward outlook
- Local home prices are declining (-3.0%/yr); year-one equity from $830 of loan paydown is wiped out by about $4k of value loss. Plan a longer hold.
- Cibola County population projected at -14% by 2050 — secular population decline; favor cash flow + early exit over multi-decade hold.
Negotiation context
- It's been on market 41 days — a 3% lower offer ($116k) is reasonable based on typical stale-listing flexibility.
Questions for the listing agent
- It's been on market 41 days. Have you received any prior offers? Is the seller open to a 3% concession, seller financing, or rate buy-down credit?
- Built in 1977 — when were the roof, HVAC, electrical panel, plumbing, and water heater last replaced?
- Is there a deadline driving the sale (1031 exchange, divorce, estate, relocation)? That informs how much negotiation room exists.
- Schools are F-rated, which usually means shorter tenancies and higher turnover. Who's the typical renter profile here, and what's been the actual vacancy rate?
- Crime grade is D in this area — have there been break-ins, vandalism, or insurance claims at this property in the last 3 years? What carrier currently insures it and at what premium?
- The area grade is low — what's the realistic commute time and amenity access for the typical tenant pool here? Any planned neighborhood developments (good or bad) we should know about?
- What's the average days-on-market for RENTAL listings here right now (not sales)? A rising rental-DOM trend means longer vacancies and softer asking-rent achievability than the comps imply.
- What's the recent tenant-quality profile in this submarket — average credit score on applications, eviction rate, late-payment / NSF rate, and stable-employment percentage? A property-management company in the area should have these aggregated.
- How much new for-sale + rental construction is in the pipeline within 1–3 miles? Heavy new supply typically softens prices + rents 12–24 months out; constrained supply supports both.
Investment metrics
- 1% rule
- 1.04% ✓
- Cap rate
- 7.88%
- Cash-on-cash
- 5.65%
- DSCR
- 1.25
- GRM
- 8.0
CMA / ARV
- ARV (median comp)
- $79,350
- List price
- $120,000
- Delta
- 51.23%
- Verdict
- OVERPRICED
- Comps
- 3 within 1.0 mi
Projected returns pro-forma
-3.0% appreciation · 3.0% rent growth · sell at horizon
- IRR
- -7.5%
- Equity multiple
- 0.72×
- Total profit
- $-9,350
- Equity at exit
- $17,892
- IRR
- 2.0%
- Equity multiple
- 1.15×
- Total profit
- $4,911
- Equity at exit
- $10,375
Cash invested: $33,600 (down + closing). Projections, not guarantees.
Landlord ↔ Tenant lean methodology
- Overall (STATE)
- 55 Moderately Landlord-Leaning
- State New Mexico
- 55 Moderately Landlord-Leaning · D+3
- County
- — inherits STATE
- City
- — inherits STATE
ZIP-level market 87020
- Active inventory
- 76
- Price-to-rent
- 8.0×
Monthly cashflow live
- Estimated rent
- $1,250 medium interval (Pro) →
- Mortgage (P&I)
- −$629
- Tax est. 1.5%
- −$150 /mo · $1,800/yr
- Insurance
- −$50
- HOA
- −$0
- Vacancy / Maint / Mgmt
- −$263
- Net cashflow
- $158
Break-even live
Sensitivity live
| Price | -10% $241 | -5% $200 | +0% $158 | +5% $117 | +10% $75 |
|---|---|---|---|---|---|
| Rent | -10% $59 | -5% $109 | +0% $158 | +5% $208 | +10% $257 |
| Rate | -1.0pp $219 | -0.5pp $189 | base $158 | +0.5pp $127 | +1.0pp $95 |
UW: 25.0% down · 7.5% · 30yr · 1.5% tax · 5.0% vac · 8.0% maint · 8.0% mgmt
Financing live
Cash to close
- Down payment
- $30,000
- Closing costs
- $3,600
- Reserves months
- —
- Total cash needed
- —
Loan-product check · same deal, 3 products live
Conventional
25% down · 7.5% · 30yr
- Down + closing
- —
- Monthly P&I
- —
- Monthly cashflow
- —
- DSCR
- —
- Eligible?
- —
Personal DTI + credit; lowest rate.
DSCR
20% down · 8.5% · 30yr
- Down + closing
- —
- Monthly P&I
- —
- Monthly cashflow
- —
- DSCR
- —
- Eligible?
- —
No personal income docs; deal must DSCR.
Hard money
10% down · 12.0% · 12mo
- Down + closing
- —
- Monthly P&I
- —
- Monthly cashflow
- —
- DSCR
- —
- Eligible?
- —
Short-term bridge; refi at stabilization.
Listing history 17 events
-
2026-06-19status $120,000 Pending 41 DOM
-
2026-06-18days on market $120,000 Active 41 DOM
-
2026-06-17days on market $120,000 Active 40 DOM
-
2026-06-16days on market $120,000 Active 39 DOM
-
2026-06-15days on market $120,000 Active 38 DOM
-
2026-06-13days on market $120,000 Active 36 DOM
-
2026-06-10days on market $120,000 Active 33 DOM
-
2026-06-09days on market $120,000 Active 32 DOM
-
2026-06-08days on market $120,000 Active 31 DOM
-
2026-06-07pricedays on market $120,000 Active 30 DOM
-
2026-06-03days on market $130,000 Active 26 DOM
-
2026-06-02days on market $130,000 Active 25 DOM
-
2026-06-01days on market $130,000 Active 24 DOM
-
2026-05-31days on market $130,000 Active 23 DOM
-
2026-05-04$140,000 Active 465-char remark
-
2016-01-28soldstatus
-
2011-08-11soldstatus
ⓘ Source: listings_history table (triggers on properties + properties_extension) + one-shot
backfill from property_details.listing_events for pre-trigger history.
Climate risk First Street
- Flood 1/10 Low FEMA zone X (unshaded) · 0% chance over 30 yrs
- Wildfire 4/10 Moderate
- Heat 3/10 Moderate 7 d/yr ≥92°F today · 18 d/yr by 30 yrs out
- Wind 1/10 Low
- Air quality 1/10 Low 0 unhealthy d/yr today · 0 by 30 yrs out
Nearby sold comps map
Loading sold comps map…
Walkable amenities ~0.75 mi
Loading nearby amenities…
Taxation est. · year 1
- Rental income
- $15,000
- − Mortgage interest
- −$6,722
- − Property taxes
- −$1,800
- − Insurance
- −$600
- − Repairs & maintenance
- −$1,200
- − Management
- −$1,200
- − Depreciation
- −$3,491
- Taxable loss
- −$13
- Est. tax savings @ 24.0%
- +$3
- After-tax cash flow
- $1,902/yr
For passive investors: Depreciation is non-cash, so a rental often shows a tax loss while cash-flowing — sheltering income. Rental losses are passive: they offset passive income freely, and up to $25,000/yr can offset ordinary (W-2) income if you actively participate and your MAGI is under $100k (phasing out to $0 by $150k); unused losses carry forward. On sale, claimed depreciation is recaptured at up to 25%, and gains may owe capital-gains tax (a 1031 exchange can defer both). Figures are a year-1 estimate at your 24.0% rate — not tax advice; consult a CPA.
Schools (NCES district)
- District
- Grants-Cibola County Schools
- NCES district ID
- 3501170
- Math proficiency
- 14% —
- Reading proficiency
- 22% —
- Median HH income
- $35,996
- Composite
- 18.23/100
- National rank
- #14064
- State rank
- #74 of 95 in NM
Livability — Grants
- Score
- 60/100
- State rank
- #115
- US rank
- #19558
Category grades
Schools grade is shown separately in the Schools card above.
Census & demographics
- Census place
- Grants, NM
- Population (ZIP)
- 11,874
Population outlook (Cibola County) Hauer SSP2
- Today (2025)
- 26,324 people
- By 2030
- 25,594 · -2.8%
- By 2040
- 24,117 · -8.4%
- By 2050
- 22,568 · -14.3%
- By 2075
- 18,653 · -29.1%
- By 2100
- 12,719 · -51.7%
Race, ethnicity, and origin ACS 2023
- Neighborhood character
- Diverse neighborhood (Simpson 0.65)
- Race & ethnicity
- Hispanic / Latino 53% White 27% Two or more races 19% Native American 13% Black 4%
- Hispanic origin (detail)
- Mexican 22%
- Common ancestry
- Italian 5% Slovak 2% Lithuanian 1%
- Foreign-born
- 5% · Canada, Vietnam
- Languages at home
- 69% English-only · Spanish 24% Vietnamese 1%
Political lean MEDSL · Cibola
- 2024 margin
- Toss-up / Even · D 49.6% · R 48.0% · Other 2.4%
- 2008→2024 swing
- -28.1pp toward R · 2008: 29.6pp · 2024: 1.6pp
- All cycles
- 2024: D+1.6 2020: D+8.7 2016: D+6.8 2012: D+23.8 2008: D+29.6
Not yet ingested
- Civics
- —
Market trends
- HPI YoY
- ▼ -109.40%
- Current HPI
- 167.6417
- Rent YoY
- —
- Metro
- —
- State GDP YoY
- —
- F500 in state
- 0
Price history
-14.3% since first listed5 events — show timeline
- 2026-06-05 Price Changed $120,000 Southwest MLS
- 2026-05-27 Price Changed $130,000 Southwest MLS
- 2026-05-04 Listed $140,000 Southwest MLS
- 2016-01-28 Sold (Public Records) — Public Records
- 2011-08-11 Sold (Public Records) — Public Records
Property tax history
-28.0%/yrLatest (2023): $31 · -93.8% YoY. Source: county tax records.
Cash-flow waterfall
monthlySold comps — $/sqft
last 12 mo · ≤1 miLoading sold comps…