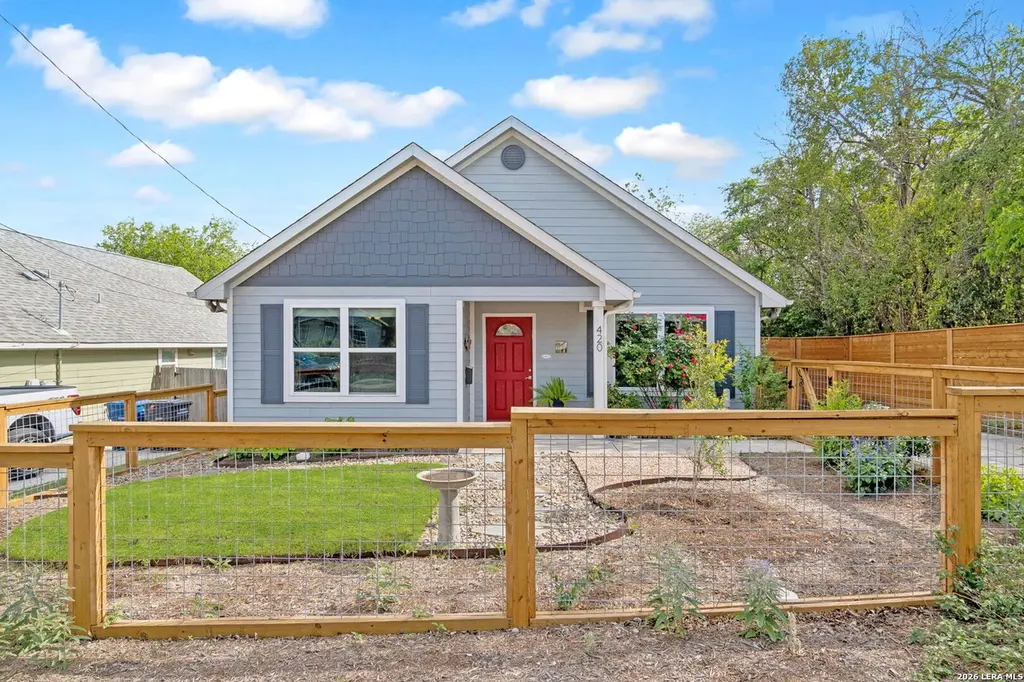
420 Belmont · San Antonio, TX
Flood risk 1/10 · Minimal
- FEMA flood zone
- X (unshaded)
- Chance of flooding over 30 yrs
- 0.0%
- Est. flood insurance / yr
- $507 – $1,088
Fire risk 1/10 · Minimal
- Est. fire insurance / yr
- $1,222 – $2,270
Heat risk 8/10 · Major
- Hot days now (above 108°F)
- 7 days/yr
- Hot days in 30 yrs
- 21 days/yr
Wind risk 8/10 · Major
- Chance of severe wind over 30 yrs
- 80.0%
Air-quality risk 2/10 · Minimal
- Unhealthy air days now
- 1 days/yr
- Unhealthy air days in 30 yrs
- 2 days/yr
Risk factors via First Street. Map © Google.
Why this score? — see what drove the D- grade
The composite is a weighted blend of 9 inputs, each scored 0–100. Each bar is that input's sub-score; the figure is the points it added to the 100-point composite (weight × sub-score).
- ARV discount +11.6/15.0
- Appreciation +10.0/10.0
- Rent growth +4.5/5.0
- Cash flow +4.2/30.0
- Livability +4.0/5.0
- Condition / age +2.5/5.0
- Schools +1.4/10.0
- 1% rule +1.3/10.0
- DSCR +0.0/10.0
$249,900
🖨 Deal sheet 📄 Offer letter ✓ Due diligence
Listing remarks MLS
At 420 Belmont, charm and comfort come together in a home that feels inviting from the moment you arrive. A fenced front yard with established plants and mature landscaping creates welcoming curb appeal. Inside, an island kitchen and dining area flow naturally into a light-filled living room at the back of the home, while high vaulted ceilings add character and volume to the space. No carpet throughout offers easy maintenance and a clean, cohesive feel. Bedrooms feature spacious walk-in closets, and the overall layout balances functionality with comfort. Out back, a covered patio overlooks a double-layer deck and a large yard shaded by mature trees and enclosed by a privacy fence, offering plenty of room to relax, entertain, or enjoy the outdoors. Well-maintained and full of warmth, 420 Belmont offers comfortable indoor and outdoor living just minutes from downtown San Antonio, nearby parks, St. Philip's College, the Frost Bank Center, and the Pearl, placing some of the city's best destinations within easy reach.
Key facts
- Island kitchen
- No carpet
- Walk in closets
Tags
Neighborhood map
What this means for you Summary
Snapshot
- This is a 3-bed/2.0-bath single-family listed at $250k.
Deal economics
- At list price, monthly cash flow is $-673 ($-8k/yr) — negative.
- To cash-flow at today's rent, offer at most $131k (47.6% below list).
- To meet the 1% rule (rent ≥ 1% of price), the offer needs to be $158k (36.7% below list).
- Recommended offer: $131k (47.6% below list) — sets the bar for cash-flow.
Location & tenants
- Location reads 80/100 on livability (#31 in TX, #1,616 nationally) — a professional / high-income tenant draw. Strengths: amenities A+, commute A+, cost of living A+; Watch: schools C-, crime F.
- San Antonio ISD (urban): math 12% / reading 22% proficiency, ranked #805 of 826 in TX (top 98%) — low school quality limits family demand, transient renter base, plan for 1-2y turnover; 80% free/reduced lunch — lower-income household profile, screen leases tightly.
- Market conditions: Rents rising fast (+8.2%/yr); 196 active listings in the ZIP; 40 comparable units currently listed for rent nearby; rentals at typical pace (median 24d on market — plan ~3-4 weeks tenant-placement turnaround); 8,308 units permitted in Bexar County in 2024 (2,506 in 5+ unit buildings).
- This rent runs 40% of the median local income ($47k/yr) — at the standard rent-burdened threshold; future hikes will face affordability resistance.
Forward outlook
- In year one you build about $27k of equity ($2k loan paydown + $25k appreciation (10.0% local appreciation)).
- Bexar County population projected at +50% by 2050 — long-run rental-demand tailwind backs the buy-and-hold thesis.
- By year 2, paydown + projected appreciation supports a ~$43k cash-out refi (75% LTV) — recoverable capital for the next deal without selling this one.
Negotiation context
- It's been on market 70 days — a 6% lower offer ($235k) is reasonable based on typical stale-listing flexibility.
- 3 sale attempts since 4y ago with the ask held roughly flat each time — persistent listings suggest the price (not the market) is what's stuck; bring a comps-based counter.
Risks & watch-outs
- Climate carrying-cost: severe wind risk, 80% chance of damaging wind over 30y; extreme-heat days projected 7→21/yr by 2055 (HVAC capex compounding) — expect insurance premiums to compound above CPI over the hold.
Questions for the listing agent
- What do current leases actually rent for vs. the listed asking? Can we see a recent rent roll and the last 12 months of T-12 income?
- It's been on market 70 days. Have you received any prior offers? Is the seller open to a 48% concession, seller financing, or rate buy-down credit?
- Why hasn't it sold? Are there any deal-killer items the seller is aware of (foundation, flood, title, zoning, code violations)?
- Is there a deadline driving the sale (1031 exchange, divorce, estate, relocation)? That informs how much negotiation room exists.
- Crime grade is F in this area — have there been break-ins, vandalism, or insurance claims at this property in the last 3 years? What carrier currently insures it and at what premium?
- The area grade is low — what's the realistic commute time and amenity access for the typical tenant pool here? Any planned neighborhood developments (good or bad) we should know about?
- What's the average days-on-market for RENTAL listings here right now (not sales)? A rising rental-DOM trend means longer vacancies and softer asking-rent achievability than the comps imply.
- What's the recent tenant-quality profile in this submarket — average credit score on applications, eviction rate, late-payment / NSF rate, and stable-employment percentage? A property-management company in the area should have these aggregated.
- How much new for-sale + rental construction is in the pipeline within 1–3 miles? Heavy new supply typically softens prices + rents 12–24 months out; constrained supply supports both.
Investment metrics
- 1% rule
- 0.63% ✗
- Cap rate
- 3.06%
- Cash-on-cash
- -11.54%
- DSCR
- 0.49
- GRM
- 13.2
CMA / ARV
- ARV (median comp)
- $274,996
- List price
- $249,900
- Delta
- -9.13%
- Verdict
- FAIR
- Comps
- 20 within 1.0 mi
Show comp detail 12 sales within ~0.75 mi
| Address | Dist | Beds/Ba | Sqft | Sold | Price | $/sf | Match |
|---|---|---|---|---|---|---|---|
| 1414 Paso Hondo | 0.16mi | 3/2.0 | 1,456 (-2%) | 3mo | $275,000 | $189 | 86 |
| 1735 Center | 0.25mi | 3/2.0 | 1,538 (+3%) | 4mo | $229,900 | $149 | 79 |
| 910 Potomac | 0.19mi | 3/2.0 | 1,390 (-7%) | 2mo | $130,000 | $94 | 78 |
| 623 Belmont | 0.29mi | 3/2.0 | 1,355 (-9%) | 0mo | $230,000 | $170 | 72 |
| 2031 E Crockett | 0.29mi | 2/1.0 (-1) | 1,416 (-5%) | 1mo | $79,900 | $56 | 68 |
| 1448 Montana | 0.35mi | 4/3.0 (+1) | 1,562 (+5%) | 1mo | $309,900 | $198 | 65 |
| 139 Reichert St | 0.63mi | 3/2.0 | 1,447 (-3%) | 2mo | $260,000 | $180 | 65 |
| 2235 E Houston | 0.51mi | 4/2.0 (+1) | 1,556 (+5%) | 3mo | $110,000 | $71 | 61 |
| 1048 Gibbs | 0.34mi | 3/2.0 | 1,280 (-14%) | 1mo | $249,000 | $195 | 60 |
| 2521 E Houston St 1 | 0.35mi | 3/3.0 | 1,706 (+15%) | 4mo | $175,000 | $103 | 52 |
| 1502 Nolan St | 0.70mi | 3/2.0 | 1,625 (+9%) | 1mo | $345,000 | $212 | 51 |
| 1108 Center St | 0.61mi | 3/3.0 | 1,628 (+9%) | 3mo | $324,000 | $199 | 49 |
Match score weights: distance 35% · size 25% · config 20% · recency 20%. Top-matched comps best support the ARV.
Projected returns pro-forma
10.0% appreciation · 8.0% rent growth · sell at horizon
- IRR
- 17.5%
- Equity multiple
- 2.45×
- Total profit
- $101,752
- Equity at exit
- $225,130
- IRR
- 17.6%
- Equity multiple
- 6.06×
- Total profit
- $354,351
- Equity at exit
- $485,501
Cash invested: $69,972 (down + closing). Projections, not guarantees.
Landlord ↔ Tenant lean methodology
- Overall (STATE)
- 87 Strongly Landlord-Friendly
- State Texas
- 87 Strongly Landlord-Friendly · R+5
- County
- — inherits STATE
- City
- — inherits STATE
ZIP-level market 78202
- Home prices YoY
- 27.0%
- Rents YoY
- 8.2%
- Active inventory
- 196
- Price-to-rent
- 13.2×
Monthly cashflow live
- Estimated rent
- $1,582 high interval (Pro) →
- Mortgage (P&I)
- −$1,311
- Tax from tax record
- −$508 /mo · $6,101/yr
- Insurance
- −$104
- HOA
- −$0
- Vacancy / Maint / Mgmt
- −$332
- Net cashflow
- $-673
Break-even live
UW: 25.0% down · 7.5% · 30yr · 1.5% tax · 5.0% vac · 8.0% maint · 8.0% mgmt
Financing live
Cash to close
- Down payment
- $62,475
- Closing costs
- $7,497
- Reserves months
- —
- Total cash needed
- —
Loan-product check · same deal, 3 products live
Conventional
25% down · 7.5% · 30yr
- Down + closing
- —
- Monthly P&I
- —
- Monthly cashflow
- —
- DSCR
- —
- Eligible?
- —
Personal DTI + credit; lowest rate.
DSCR
20% down · 8.5% · 30yr
- Down + closing
- —
- Monthly P&I
- —
- Monthly cashflow
- —
- DSCR
- —
- Eligible?
- —
No personal income docs; deal must DSCR.
Hard money
10% down · 12.0% · 12mo
- Down + closing
- —
- Monthly P&I
- —
- Monthly cashflow
- —
- DSCR
- —
- Eligible?
- —
Short-term bridge; refi at stabilization.
Rent comps 40 comps
| Address | Beds | Baths | Sqft | Rent | $/sqft | DOM | Units | Dist |
|---|---|---|---|---|---|---|---|---|
| 1827 Montana St #101 San Antonio, TX | 3.0 | 2.5 | 1859 | $2,250 | $1.21 | 2d | 1 | 0.20mi |
| 1435 Gibbs San Antonio, TX | 3.0 | 1.0 | 975 | $1,435 | $1.47 | 24d | 1 | 0.23mi |
| 817 Potomac San Antonio, TX | 3.0 | 2.5 | 1508 | $1,795 | $1.19 | 24d | 1 | 0.25mi |
| 610 Belmont San Antonio, TX | 2.0 | 1.0 | 1050 | $1,195 | $1.14 | 43d | 1 | 0.27mi |
| 314 Maryland St Unit 102 San Antonio, TX | 2.0 | 2.5 | 1055 | $1,295 | $1.23 | 43d | 1 | 0.28mi |
| 227 S Grimes St Unit 202 San Antonio, TX | 3.0 | 2.5 | 1089 | $1,550 | $1.42 | 43d | 1 | 0.30mi |
| 706 Canton San Antonio, TX | 2.0 | 1.0 | 994 | $1,545 | $1.55 | 24d | 1 | 0.30mi |
| 1111 Gibbs San Antonio, TX | 3.0 | 2.0 | 1476 | $1,595 | $1.08 | 24d | 1 | 0.31mi |
| 639 Canton San Antonio, TX | 2.0 | 1.0 | 1008 | $1,295 | $1.28 | 43d | 1 | 0.31mi |
| 1101 Gibbs San Antonio, TX | 3.0 | 1.0 | 1100 | $1,345 | $1.22 | 24d | 1 | 0.32mi |
| 1101 Gibbs San Antonio, TX | 3.0 | 1.0 | 1100 | $1,345 | $1.22 | 14d | 1 | 0.32mi |
| 1727 E Crockett St San Antonio, TX | 3.0 | 3.0 | 1819 | $1,725 | $0.95 | 20d | 1 | 0.34mi |
| 1723 E Crockett St San Antonio, TX | 3.0 | 3.0 | 1819 | $1,800 | $0.99 | 24d | 1 | 0.35mi |
| 2346 Dakota St Unit 1101 San Antonio, TX | 2.0 | 1.0 | 1728 | $1,250 | $0.72 | 16d | 1 | 0.37mi |
| 2332 E Houston St San Antonio, TX | 3.0 | 2.0 | 1652 | $1,550 | $0.94 | 24d | 1 | 0.40mi |
| 113 Anderson Ave Unit 101 San Antonio, TX | 3.0 | 2.5 | 1539 | $1,700 | $1.10 | 43d | 1 | 0.42mi |
| 607 Gulf San Antonio, TX | 3.0 | 2.0 | 1482 | $1,395 | $0.94 | 24d | 1 | 0.42mi |
| 452 Gulf San Antonio, TX | 3.0 | 1.0 | 1244 | $1,899 | $1.53 | 22d | 1 | 0.43mi |
| 1618 Dakota St Unit 102 San Antonio, TX | 3.0 | 2.5 | 1768 | $1,925 | $1.09 | 16d | 1 | 0.44mi |
| 521 S Polaris St San Antonio, TX | 3.0 | 1.0 | 1200 | $1,249 | $1.04 | 4d | 1 | 0.46mi |
| 1414 Gorman San Antonio, TX | 2.0 | 1.0 | 900 | $1,175 | $1.31 | 43d | 1 | 0.49mi |
| 318 Ferguson Ave Unit 1 San Antonio, TX | 3.0 | 2.0 | 1450 | $1,550 | $1.07 | 4d | 1 | 0.51mi |
| 1510 Gorman San Antonio, TX | 2.0 | 1.0 | 996 | $1,300 | $1.31 | 17d | 1 | 0.51mi |
| 2818 E Houston St San Antonio, TX | 3.0 | 1.0 | 1184 | $1,495 | $1.26 | 14d | 1 | 0.56mi |
| 1622 Gorman San Antonio, TX | 3.0 | 2.0 | 1189 | $1,325 | $1.11 | 17d | 1 | 0.56mi |
| 631 Potomac San Antonio, TX | 3.0 | 2.5 | 1844 | $1,797 | $0.97 | 24d | 1 | 0.57mi |
| 906 Gulf St Unit 102 San Antonio, TX | 3.0 | 2.0 | 1300 | $1,750 | $1.35 | 4d | 1 | 0.57mi |
| 620 Potomac San Antonio, TX | 2.0 | 1.0 | 900 | $1,050 | $1.17 | 22d | 1 | 0.59mi |
| 1650 Gorman San Antonio, TX | 2.0 | 1.0 | 950 | $1,111 | $1.17 | 24d | 1 | 0.60mi |
| 2118 Burnet St San Antonio, TX | 3.0 | 2.0 | 1008 | $1,650 | $1.64 | 3d | 1 | 0.62mi |
| 723 Paso Hondo San Antonio, TX | 3.0 | 1.0 | 1224 | $1,500 | $1.23 | 43d | 1 | 0.63mi |
| 1615 Nolan St Unit A San Antonio, TX | 2.0 | 1.0 | 1066 | $1,400 | $1.31 | 11d | 1 | 0.65mi |
| 155 Canton San Antonio, TX | 2.0 | 2.0 | 1078 | $1,250 | $1.16 | 24d | 1 | 0.65mi |
| 1104 N Gevers St San Antonio, TX | 3.0 | 2.5 | 1276 | $1,725 | $1.35 | 43d | 1 | 0.65mi |
| 123 Dilworth St San Antonio, TX | 3.0 | 2.0 | 1384 | $1,900 | $1.37 | 43d | 1 | 0.66mi |
| 103 Saint John San Antonio, TX | 2.0 | 1.0 | 943 | $1,245 | $1.32 | 43d | 1 | 0.68mi |
| 113 Dilworth St San Antonio, TX | 3.0 | 3.0 | 1383 | $1,850 | $1.34 | 24d | 1 | 0.68mi |
| 2006 Hays St San Antonio, TX | 3.0 | 2.0 | 1176 | $1,750 | $1.49 | 20d | 1 | 0.69mi |
| 1431 Aransas Ave San Antonio, TX | 3.0 | 1.0 | 1108 | $1,195 | $1.08 | 14d | 1 | 0.69mi |
| 2239 Burnet St San Antonio, TX | 3.0 | 2.0 | 1097 | $1,450 | $1.32 | 43d | 1 | 0.72mi |
Listing history 33 events
-
2026-06-18days on market $249,900 Active 70 DOM
-
2026-06-17days on market $249,900 Active 69 DOM
-
2026-06-16days on market $249,900 Active 68 DOM
-
2026-06-15days on market $249,900 Active 67 DOM
-
2026-06-13statusdays on market $249,900 Active 65 DOM
-
2026-06-09days on market $249,900 Price Change 61 DOM
-
2026-06-08days on market $249,900 Price Change 60 DOM
-
2026-06-07days on market $249,900 Price Change 59 DOM
-
2026-06-04days on market $249,900 Price Change 56 DOM
-
2026-06-03pricestatusdays on market $249,900 Price Change 55 DOM
-
2026-06-02days on market $262,900 Active 54 DOM
-
2026-06-01days on market $262,900 Active 53 DOM
-
2026-05-31days on market $262,900 Active 52 DOM
-
2026-04-09$262,900 New 1028-char remark
Show marketing remark (1028 chars)
At 420 Belmont, charm and comfort come together in a home that feels inviting from the moment you arrive. A fenced front yard with established plants and mature landscaping creates welcoming curb appeal. Inside, an island kitchen and dining area flow naturally into a light-filled living room at the back of the home, while high vaulted ceilings add character and volume to the space. No carpet throughout offers easy maintenance and a clean, cohesive feel. Bedrooms feature spacious walk-in closets, and the overall layout balances functionality with comfort. Out back, a covered patio overlooks a double-layer deck and a large yard shaded by mature trees and enclosed by a privacy fence, offering plenty of room to relax, entertain, or enjoy the outdoors. Well-maintained and full of warmth, 420 Belmont offers comfortable indoor and outdoor living just minutes from downtown San Antonio, nearby parks, St. Philip's College, the Frost Bank Center, and the Pearl, placing some of the city's best destinations within easy reach.
-
2026-01-05historical
-
2025-12-18price $289,900
-
2025-11-20price $299,000
-
2025-11-10price $315,000
-
2025-10-04$335,000 New
-
2023-02-28soldstatus Sold
-
2023-02-28soldstatus
-
2023-02-05status Pending
-
2023-01-29historical Active Option
-
2023-01-11price $250,000
-
2022-10-21price $273,000
-
2022-10-07price $270,000
-
2022-10-07price $273,000
-
2022-10-07price $270,000
-
2022-10-07price $260,000
-
2022-10-07price $255,000
-
2022-10-06$280,000 New
-
2018-01-17soldstatus
-
2017-03-03soldstatus
ⓘ Source: listings_history table (triggers on properties + properties_extension) + one-shot
backfill from property_details.listing_events for pre-trigger history.
Tax reassessment forecast TX · Resets to sale price
- Current annual tax
- $6,101 · $508/mo
- Projected year-2 tax
- $6,101 · $508/mo
- Expected delta
- $0/yr ($0/mo · 0.0%)
ⓘ Screening estimate from a state-policy table — verify with the county assessor before closing.
Climate risk First Street
- Flood 1/10 Low FEMA zone X (unshaded) · 0% chance over 30 yrs
- Wildfire 1/10 Low
- Heat 8/10 Severe 7 d/yr ≥108°F today · 21 d/yr by 30 yrs out
- Wind 8/10 Severe 80% chance of damaging wind over 30 yrs
- Air quality 2/10 Low 1 unhealthy d/yr today · 2 by 30 yrs out
Nearby sold comps map
Loading sold comps map…
Walkable amenities ~0.75 mi
Loading nearby amenities…
Taxation est. · year 1
- Rental income
- $18,990
- − Mortgage interest
- −$13,998
- − Property taxes
- −$6,101
- − Insurance
- −$1,250
- − Repairs & maintenance
- −$1,519
- − Management
- −$1,519
- − Depreciation
- −$7,270
- Taxable loss
- −$12,667
- Est. tax savings @ 24.0%
- +$3,040
- After-tax cash flow
- $-5,035/yr
For passive investors: Depreciation is non-cash, so a rental often shows a tax loss while cash-flowing — sheltering income. Rental losses are passive: they offset passive income freely, and up to $25,000/yr can offset ordinary (W-2) income if you actively participate and your MAGI is under $100k (phasing out to $0 by $150k); unused losses carry forward. On sale, claimed depreciation is recaptured at up to 25%, and gains may owe capital-gains tax (a 1031 exchange can defer both). Figures are a year-1 estimate at your 24.0% rate — not tax advice; consult a CPA.
Schools (NCES district)
- District
- San Antonio ISD
- NCES district ID
- 4838730
- Math proficiency
- 12% ▼ -21.00%
- Reading proficiency
- 22% ▼ -7.00%
- Median HH income
- $30,952
- Composite
- 13.57/100
- National rank
- #9512
- State rank
- #805 of 826 in TX
Livability — San Antonio
- Score
- 80/100
- State rank
- #31
- US rank
- #1616
Category grades
Schools grade is shown separately in the Schools card above.
Census & demographics
- Census place
- San Antonio, TX
- County
- Bexar County · 1,990,555 people
- City population
- 1,806,925
- Metro
- San Antonio-New Braunfels, TX
- Population (ZIP)
- 10,224
- Household income
- $47,478
- Rent vs Own
- Severe rent burden
- 543.0
Population outlook (Bexar County) Hauer SSP2
- Today (2025)
- 2,336,851 people
- By 2030
- 2,560,728 · +9.6%
- By 2040
- 3,020,569 · +29.3%
- By 2050
- 3,493,522 · +49.5%
- By 2075
- 4,668,459 · +99.8%
- By 2100
- 5,533,242 · +136.8%
Race, ethnicity, and origin ACS 2023
- Neighborhood character
- Predominantly Hispanic (66%)
- Race & ethnicity
- Hispanic / Latino 66% Two or more races 28% White 17% Black 16% Native American 1%
- Hispanic origin (detail)
- Mexican 57% Puerto Rican 1% Cuban 1%
- Common ancestry
- Italian 2% Slovak 1%
- Foreign-born
- 14% · Canada
- Languages at home
- 59% English-only · Spanish 41%
Political lean MEDSL · Bexar
- 2024 margin
- Lean D (+9.8) · D 54.3% · R 44.6% · Other 1.1%
- 2008→2024 swing
- +4.2pp toward D · 2008: 5.6pp · 2024: 9.8pp
- All cycles
- 2024: D+9.8 2020: D+18.2 2016: D+13.5 2012: D+4.6 2008: D+5.6
Not yet ingested
- Civics
- —
Market trends
- HPI YoY
- ▲ 53.82%
- Current HPI
- 253.3196
- Rent YoY
- ▲ 8.20%
- Metro
- San Antonio-New Braunfels, TX
- State GDP YoY
- ▲ 3.95%
- F500 in state
- 110
Industry mix (Fortune 500 HQ in TX)
| Industry | F500 HQs | Revenue |
|---|---|---|
| Energy | 16 | $1,198B |
|
||
| Technology | 5 | $198B |
|
||
| Engineering / Construction | 4 | $72B |
|
||
| Energy Services | 3 | $60B |
|
||
| Utilities | 3 | $41B |
|
||
| Healthcare | 2 | $330B |
|
||
Price history
-6.1% since first listed20 events — show timeline
- 2026-04-09 Listed $262,900 LERA
- 2026-01-05 Listing Removed — LERA
- 2025-12-18 Price Changed $289,900 LERA
- 2025-11-20 Price Changed $299,000 LERA
- 2025-11-10 Price Changed $315,000 LERA
- 2025-10-04 Listed $335,000 LERA
- 2023-02-28 Sold (MLS) — LERA
- 2023-02-28 Sold (Public Records) — Public Records
- 2023-02-05 Pending — LERA
- 2023-01-29 Contingent — LERA
- 2023-01-11 Price Changed $250,000 LERA
- 2022-10-21 Price Changed $273,000 LERA
- 2022-10-07 Price Changed $255,000 LERA
- 2022-10-07 Price Changed $260,000 LERA
- 2022-10-07 Price Changed $270,000 LERA
- 2022-10-07 Price Changed $273,000 LERA
- 2022-10-07 Price Changed $270,000 LERA
- 2022-10-06 Listed $280,000 LERA
- 2018-01-17 Sold (Public Records) — Public Records
- 2017-03-03 Sold (Public Records) — Public Records
Property tax history
+90.4%/yrLatest (2025): $6,101 · -14.8% YoY. Source: county tax records.
Cash-flow waterfall
monthlySold comps — $/sqft
last 12 mo · ≤1 miLoading sold comps…