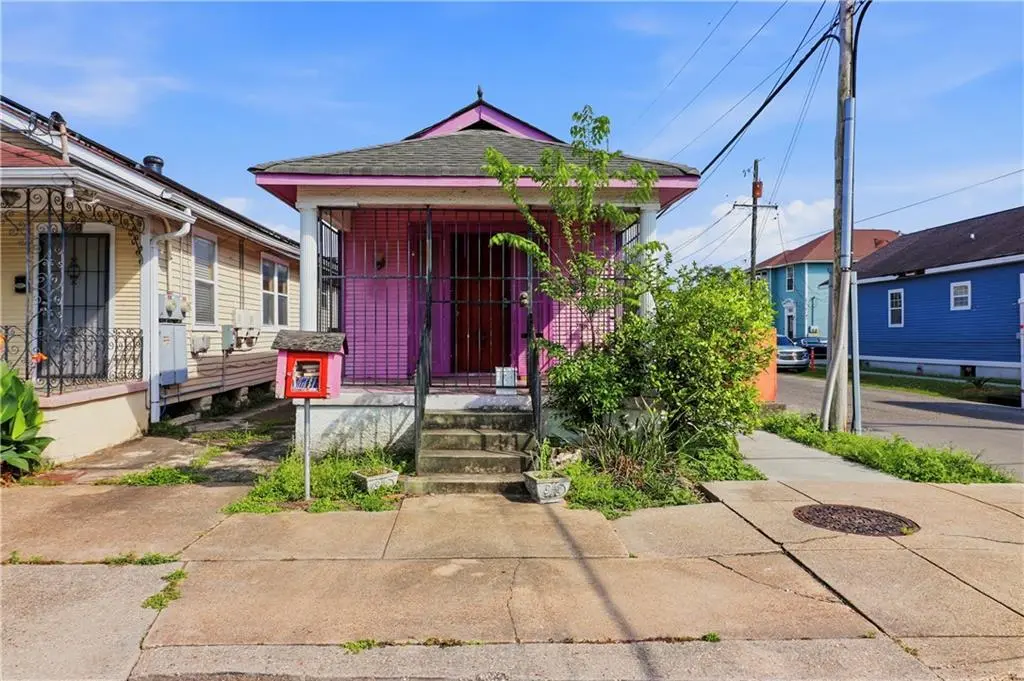
438 S Murat St · New Orleans, LA
Flood risk 8/10 · Major
- FEMA flood zone
- X (shaded)
- Chance of flooding over 30 yrs
- 0.76%
- Est. flood insurance / yr
- $507 – $1,088
Fire risk 1/10 · Minimal
- Est. fire insurance / yr
- $1,269 – $2,357
Heat risk 10/10 · Severe
- Hot days now (above 108°F)
- 7 days/yr
- Hot days in 30 yrs
- 21 days/yr
Wind risk 10/10 · Severe
- Chance of severe wind over 30 yrs
- 99.0%
Air-quality risk 4/10 · Minor
- Unhealthy air days now
- 4 days/yr
- Unhealthy air days in 30 yrs
- 4 days/yr
Risk factors via First Street. Map © Google.
Why this score? — see what drove the C grade
The composite is a weighted blend of 9 inputs, each scored 0–100. Each bar is that input's sub-score; the figure is the points it added to the 100-point composite (weight × sub-score).
- Cash flow +20.3/30.0
- ARV discount +15.0/15.0
- DSCR +6.4/10.0
- 1% rule +5.8/10.0
- Livability +4.0/5.0
- Rent growth +2.5/5.0
- Condition / age +2.5/5.0
- Schools +1.6/10.0
- Appreciation +0.0/10.0
$150,000
🖨 Deal sheet (PDF) 📄 Offer letter ✓ Due diligence
Listing remarks MLS
Mid-City cottage with renovation potential. This two-bedroom property features a practical footprint and is ideally located near key New Orleans amenities, including parks, dining, and major thoroughfares. A strong opportunity for those looking to invest, renovate, or customize a property in a well-established neighborhood.
Key facts
- 1,515 sq ft lot
- Parking
- Built 1920
Neighborhood map
What this means for you Summary
Snapshot
- This is a 2-bed/1.0-bath single-family listed at $150k.
Deal economics
- At list price, monthly cash flow is $126 ($2k/yr) — positive.
- The deal already cash-flows at list — no discount required.
- Meets the 1% rule at list price ($2k rent vs $150k).
- Recommended offer: $141k (6.0% below list) — sets the bar for market timing.
- Cap rate 7.8% vs local median 4.4% in New Orleans — top-decile yield for the area; either an underpriced asset or a hidden risk that comps aren't pricing in. Stress-test before assuming the spread holds.
Location & tenants
- Location reads 81/100 on livability (#3 in LA, #1,383 nationally) — a professional / high-income tenant draw. Strengths: amenities A+, commute A+, health & safety A+; Watch: crime C-, employment D.
- Orleans Parish (urban): math 11% / reading 27% proficiency, ranked #69 of 98 in LA (top 70%) — low school quality limits family demand, transient renter base, plan for 1-2y turnover; 68% free/reduced lunch — lower-income household profile, screen leases tightly.
- Zoned schools: Benjamin Franklin Elem. Math And Science (math 12% / reading 23%, grade F, #479 of 646 statewide, top 75%, 747 students, 98% FRL, charter) — zoned schools average 98% FRL vs 68% district-wide (30 pts higher); higher-poverty schools than district average — tighter screening recommended.
- Market conditions: Rents soft (-0.2%/yr); 381 active listings in the ZIP; 40 comparable units currently listed for rent nearby; rentals at typical pace (median 23d on market — plan ~3-4 weeks tenant-placement turnaround); 710 units permitted in Orleans Parish in 2024 (244 in 5+ unit buildings).
- This rent runs 37% of the median local income ($53k/yr) — at the standard rent-burdened threshold; future hikes will face affordability resistance.
Forward outlook
- Local home prices are declining (-3.0%/yr); year-one equity from $1k of loan paydown is wiped out by about $4k of value loss. Plan a longer hold.
- Orleans County population projected at +61% by 2050 — long-run rental-demand tailwind backs the buy-and-hold thesis.
Negotiation context
- It's been on market 68 days — a 6% lower offer ($141k) is reasonable based on typical stale-listing flexibility.
- 6 sale attempts since 30y ago; this cycle's ask has dropped $15k (9%) from the opening price — seller is motivated, your offer sets the floor, not the list.
- Current owner paid $50k; list at $150k implies a 200% gain — meaningful room to come down on a strong offer.
Risks & watch-outs
- Watch-outs: flood insurance adds $66/mo; built in 1920 — expect roof / HVAC / electrical / plumbing capex.
- Climate carrying-cost: severe flood risk; severe wind risk, 99% chance of damaging wind over 30y; extreme-heat days projected 7→21/yr by 2055 (HVAC capex compounding) — expect insurance premiums to compound above CPI over the hold.
Questions for the listing agent
- It's been on market 68 days. Have you received any prior offers? Is the seller open to a 6% concession, seller financing, or rate buy-down credit?
- Built in 1920 — when were the roof, HVAC, electrical panel, plumbing, and water heater last replaced?
- What's the actual annual flood-insurance premium (NFIP or private), and is the property in a SFHA with mandatory coverage?
- Why hasn't it sold? Are there any deal-killer items the seller is aware of (foundation, flood, title, zoning, code violations)?
- Is there a deadline driving the sale (1031 exchange, divorce, estate, relocation)? That informs how much negotiation room exists.
- What's the average days-on-market for RENTAL listings here right now (not sales)? A rising rental-DOM trend means longer vacancies and softer asking-rent achievability than the comps imply.
- What's the recent tenant-quality profile in this submarket — average credit score on applications, eviction rate, late-payment / NSF rate, and stable-employment percentage? A property-management company in the area should have these aggregated.
- How much new for-sale + rental construction is in the pipeline within 1–3 miles? Heavy new supply typically softens prices + rents 12–24 months out; constrained supply supports both.
Investment metrics
- 1% rule
- 1.08% ✓
- Cap rate
- 7.83%
- Cash-on-cash
- 5.49%
- DSCR
- 1.24
- GRM
- 7.7
CMA / ARV
- ARV (median comp)
- $257,002
- List price
- $150,000
- Delta
- -41.63%
- Verdict
- UNDERPRICED
- Comps
- 20 within 1.0 mi
Show comp detail 12 sales within ~0.75 mi
| Address | Dist | Beds/Ba | Sqft | Sold | Price | $/sf | Match |
|---|---|---|---|---|---|---|---|
| 216 S Solomon St | 0.28mi | 1/1.0 (-1) | 1,050 (+3%) | 2mo | $265,000 | $252 | 76 |
| 315 S Telemachus St | 0.61mi | 2/1.0 | 1,033 (+1%) | 1mo | $260,221 | $252 | 69 |
| 622 N Hennessey St | 0.69mi | 2/1.0 | 1,000 (-2%) | 3mo | $335,000 | $335 | 62 |
| 4237 General Ogden St | 0.29mi | 3/2.0 (+1) | 1,104 (+8%) | 3mo | $120,000 | $109 | 62 |
| 519 S Telemachus St | 0.60mi | 2/1.0 | 1,000 (-2%) | 11mo | $275,000 | $275 | 59 |
| 4220 General Ogden St | 0.33mi | 3/2.0 (+1) | 1,104 (+8%) | 4mo | $118,560 | $107 | 59 |
| 8715 Stroelitz St | 0.56mi | 3/1.0 (+1) | 1,049 (+3%) | 9mo | $62,000 | $59 | 57 |
| 4722 Iberville St | 0.41mi | 2/2.0 | 1,150 (+12%) | 7mo | $375,000 | $326 | 50 |
| 4736 Bienville St | 0.48mi | 2/1.0 | 1,137 (+11%) | 12mo | $329,500 | $290 | 49 |
| 606 N Murat St | 0.65mi | 2/2.5 | 1,100 (+8%) | 6mo | $310,000 | $282 | 46 |
| 621 David St | 0.72mi | 2/2.0 | 954 (-7%) | 11mo | $245,000 | $257 | 42 |
| 8911 Edinburgh Dr | 0.72mi | 2/1.0 | 1,151 (+13%) | 10mo | $160,000 | $139 | 37 |
Match score weights: distance 35% · size 25% · config 20% · recency 20%. Top-matched comps best support the ARV.
Projected returns pro-forma
-3.0% appreciation · 0.0% rent growth · sell at horizon
- IRR
- -14.4%
- Equity multiple
- 0.50×
- Total profit
- $-20,953
- Equity at exit
- $22,365
- IRR
- -12.2%
- Equity multiple
- 0.38×
- Total profit
- $-25,872
- Equity at exit
- $12,969
Cash invested: $42,000 (down + closing). Projections, not guarantees.
Landlord ↔ Tenant lean methodology
- Overall (STATE)
- 90 Strongly Landlord-Friendly
- State Louisiana
- 90 Strongly Landlord-Friendly · R+12
- County
- — inherits STATE
- City
- — inherits STATE
ZIP-level market 70119
- Home prices YoY
- -34.8%
- Rents YoY
- -0.2%
- Active inventory
- 381
- Price-to-rent
- 7.7×
Monthly cashflow live
- Estimated rent
- $1,617 high interval (Pro) →
- Mortgage (P&I)
- −$787
- Tax from tax record
- −$236 /mo · $2,831/yr
- Insurance
- −$62
- Flood insurance flood zone
- −$66 /mo · $798/yr
- HOA
- −$0
- Vacancy / Maint / Mgmt
- −$339
- Net cashflow
- $126
Break-even live
Sensitivity live
| Price | -10% $210 | -5% $168 | +0% $126 | +5% $83 | +10% $41 |
|---|---|---|---|---|---|
| Rent | -10% $-2 | -5% $62 | +0% $126 | +5% $189 | +10% $253 |
| Rate | -1.0pp $201 | -0.5pp $164 | base $126 | +0.5pp $87 | +1.0pp $47 |
UW: 25.0% down · 7.5% · 30yr · 1.5% tax · 5.0% vac · 8.0% maint · 8.0% mgmt
Financing live
Cash to close
- Down payment
- $37,500
- Closing costs
- $4,500
- Reserves months
- —
- Total cash needed
- —
Loan-product check · same deal, 3 products live
Conventional
25% down · 7.5% · 30yr
- Down + closing
- —
- Monthly P&I
- —
- Monthly cashflow
- —
- DSCR
- —
- Eligible?
- —
Personal DTI + credit; lowest rate.
DSCR
20% down · 8.5% · 30yr
- Down + closing
- —
- Monthly P&I
- —
- Monthly cashflow
- —
- DSCR
- —
- Eligible?
- —
No personal income docs; deal must DSCR.
Hard money
10% down · 12.0% · 12mo
- Down + closing
- —
- Monthly P&I
- —
- Monthly cashflow
- —
- DSCR
- —
- Eligible?
- —
Short-term bridge; refi at stabilization.
Rent comps 40 comps
| Address | Beds | Baths | Sqft | Rent | $/sqft | DOM | Units | Dist |
|---|---|---|---|---|---|---|---|---|
| 419 S Murat St Unit 421 New Orleans, LA | 2.0 | 1.0 | 800 | $1,700 | $2.12 | 25d | 1 | 0.04mi |
| 419 S Murat St New Orleans, LA | 2.0 | 2.0 | 1200 | $1,850 | $1.54 | 23d | 1 | 0.04mi |
| 505 S Alexander St New Orleans, LA | 2.0 | 1.0 | 910 | $2,000 | $2.20 | 5d | 1 | 0.05mi |
| 4506 Banks St New Orleans, LA | 2.0 | 2.0 | 1350 | $2,000 | $1.48 | 25d | 1 | 0.05mi |
| 337 S Murat St Unit 4501 New Orleans, LA | 3.0 | 2.0 | 1150 | $2,000 | $1.74 | 25d | 1 | 0.09mi |
| 526 S Saint Patrick St Unit B New Orleans, LA | 2.0 | 1.0 | 790 | $2,075 | $2.63 | 25d | 1 | 0.14mi |
| 637 S Alexander St New Orleans, LA | 3.0 | 2.0 | 1020 | $1,700 | $1.67 | 25d | 1 | 0.15mi |
| 234 S Olympia St New Orleans, LA | 2.0 | 1.0 | 860 | $1,500 | $1.74 | 18d | 1 | 0.17mi |
| 4205 Dhemecourt St New Orleans, LA | 2.0 | 1.0 | 900 | $1,300 | $1.44 | 25d | 1 | 0.20mi |
| 321 S St Patrick St Unit C New Orleans, LA | 2.0 | 1.0 | 1200 | $1,450 | $1.21 | 25d | 1 | 0.20mi |
| 321 S St Patrick St Unit C New Orleans, LA | 2.0 | 1.0 | 1200 | $1,500 | $1.25 | 13d | 1 | 0.20mi |
| 4150 D'Hemecourt St New Orleans, LA | 2.0 | 1.0 | 900 | $1,400 | $1.56 | 5d | 1 | 0.23mi |
| 707 S Solomon St New Orleans, LA | 2.0 | 1.0 | 1024 | $1,200 | $1.17 | 23d | 1 | 0.25mi |
| 4834 Banks St New Orleans, LA | 2.0 | 1.0 | 1000 | $1,500 | $1.50 | 5d | 1 | 0.28mi |
| 4834 Banks St New Orleans, LA | 2.0 | 1.0 | 1000 | $1,500 | $1.50 | 25d | 1 | 0.28mi |
| 4033 Eagle St New Orleans, LA | 1.0 | 1.0 | 756 | $900 | $1.19 | 3d | 1 | 0.34mi |
| 4044 Banks St New Orleans, LA | 2.0 | 2.0 | 1053 | $1,600 | $1.52 | 23d | 1 | 0.35mi |
| 123 N Alexander St New Orleans, LA | 2.0 | 1.0 | 950 | $1,500 | $1.58 | 25d | 1 | 0.35mi |
| 4038 Banks St New Orleans, LA | 2.0 | 1.0 | 1000 | $1,500 | $1.50 | 17d | 1 | 0.36mi |
| 4038 Banks St New Orleans, LA | 2.0 | 1.0 | 950 | $1,500 | $1.58 | 5d | 1 | 0.36mi |
| 4600 S Carrollton Ave Unit 1B New Orleans, LA | 2.0 | 2.0 | 1072 | $1,500 | $1.40 | 25d | 1 | 0.37mi |
| 4020 Baudin St New Orleans, LA | 3.0 | 2.0 | 1100 | $1,550 | $1.41 | 5d | 1 | 0.38mi |
| 4149 Canal St Unit A New Orleans, LA | 1.0 | 1.0 | 742 | $1,300 | $1.75 | 23d | 1 | 0.41mi |
| 613 S Pierce St New Orleans, LA | 3.0 | 1.0 | 1200 | $1,500 | $1.25 | 18d | 1 | 0.41mi |
| 4211 Hamilton St New Orleans, LA | 2.0 | 1.0 | 1400 | $1,100 | $0.79 | 16d | 1 | 0.42mi |
| 4211 Hamilton St Unit NA New Orleans, LA | 2.0 | 1.0 | 1400 | $1,100 | $0.79 | 13d | 1 | 0.42mi |
| 615 S Pierce St New Orleans, LA | 3.0 | 1.0 | 1200 | $1,500 | $1.25 | 18d | 1 | 0.42mi |
| 4008 General Ogden St Unit 4008 New Orleans, LA | 2.0 | 2.0 | 1000 | $1,475 | $1.48 | 16d | 1 | 0.42mi |
| 600 S Pierce St New Orleans, LA | 2.0 | 1.0 | 851 | $1,550 | $1.82 | 25d | 1 | 0.43mi |
| 4723 Iberville St New Orleans, LA | 1.0 | 1.0 | 700 | $1,500 | $2.14 | 4d | 1 | 0.44mi |
| 4723 Iberville St New Orleans, LA | 1.0 | 1.0 | 700 | $1,500 | $2.14 | 5d | 1 | 0.44mi |
| 4300 Bienville St New Orleans, LA | 2.0 | 1.0 | 940 | $1,650 | $1.76 | 5d | 1 | 0.45mi |
| 217 N Bernadotte St New Orleans, LA | 2.0 | 1.0 | 895 | $1,450 | $1.62 | 25d | 1 | 0.48mi |
| 319 S Scott St New Orleans, LA | 1.0 | 1.0 | 900 | $1,450 | $1.61 | 25d | 1 | 0.49mi |
| 319 S Scott St Unit 2A New Orleans, LA | 1.0 | 1.0 | 900 | $1,500 | $1.67 | 25d | 1 | 0.49mi |
| 3832 Banks St New Orleans, LA | 2.0 | 1.0 | 1200 | $1,850 | $1.54 | 18d | 1 | 0.50mi |
| 3931 Hamilton St New Orleans, LA | 2.0 | 1.5 | 870 | $1,250 | $1.44 | 17d | 1 | 0.51mi |
| 4136 Bienville St New Orleans, LA | 2.0 | 1.0 | 875 | $1,400 | $1.60 | 25d | 1 | 0.52mi |
| 4616 Conti St Unit 4616-2A New Orleans, LA | 2.0 | 1.0 | 813 | $1,295 | $1.59 | 5d | 1 | 0.52mi |
| 4624 Conti St New Orleans, LA | 2.0 | 1.0 | 1200 | $1,300 | $1.08 | 25d | 1 | 0.53mi |
Listing history 25 events
-
2026-06-21days on market $150,000 Active 68 DOM
-
2026-06-18days on market $150,000 Active 65 DOM
-
2026-06-17days on market $150,000 Active 64 DOM
-
2026-06-16days on market $150,000 Active 63 DOM
-
2026-06-15days on market $150,000 Active 62 DOM
-
2026-06-13days on market $150,000 Active 60 DOM
-
2026-06-10days on market $150,000 Active 57 DOM
-
2026-06-09days on market $150,000 Active 56 DOM
-
2026-06-08days on market $150,000 Active 55 DOM
-
2026-06-07days on market $150,000 Active 54 DOM
-
2026-06-05days on market $150,000 Active 51 DOM
-
2026-06-03days on market $150,000 Active 50 DOM
-
2026-06-02pricedays on market $150,000 Active 49 DOM
-
2026-06-01days on market $165,000 Active 48 DOM
-
2026-05-31days on market $165,000 Active 47 DOM
-
2026-04-14$165,000 Active 325-char remark
Show marketing remark (325 chars)
Mid-City cottage with renovation potential. This two-bedroom property features a practical footprint and is ideally located near key New Orleans amenities, including parks, dining, and major thoroughfares. A strong opportunity for those looking to invest, renovate, or customize a property in a well-established neighborhood.
-
1999-07-15soldstatus $50,000
-
1999-07-15soldstatus $50,000
-
1998-12-22$56,000
-
1998-12-22$56,000
-
1996-07-03soldstatus $58,800
-
1996-07-03soldstatus $58,000
-
1996-04-15$59,900
-
1996-04-15$59,900
ⓘ Source: listings_history table (triggers on properties + properties_extension) + one-shot
backfill from property_details.listing_events for pre-trigger history.
Tax reassessment forecast LA · Resets to sale price
- Current annual tax
- $2,831 · $236/mo
- Projected year-2 tax
- $2,831 · $236/mo
- Expected delta
- $0/yr ($0/mo · 0.0%)
ⓘ Screening estimate from a state-policy table — verify with the county assessor before closing.
Climate risk First Street
- Flood 8/10 Severe FEMA zone X (shaded) · 76% chance over 30 yrs
- Wildfire 1/10 Low
- Heat 10/10 Extreme 7 d/yr ≥108°F today · 21 d/yr by 30 yrs out
- Wind 10/10 Extreme 99% chance of damaging wind over 30 yrs
- Air quality 4/10 Moderate 4 unhealthy d/yr today · 4 by 30 yrs out
Nearby sold comps map
Loading sold comps map…
Walkable amenities ~0.75 mi
Loading nearby amenities…
Taxation est. · year 1
- Rental income
- $19,398
- − Mortgage interest
- −$8,402
- − Property taxes
- −$2,831
- − Insurance
- −$1,547
- − Repairs & maintenance
- −$1,552
- − Management
- −$1,552
- − Depreciation
- −$4,364
- Taxable loss
- −$850
- Est. tax savings @ 24.0%
- +$204
- After-tax cash flow
- $1,711/yr
For passive investors: Depreciation is non-cash, so a rental often shows a tax loss while cash-flowing — sheltering income. Rental losses are passive: they offset passive income freely, and up to $25,000/yr can offset ordinary (W-2) income if you actively participate and your MAGI is under $100k (phasing out to $0 by $150k); unused losses carry forward. On sale, claimed depreciation is recaptured at up to 25%, and gains may owe capital-gains tax (a 1031 exchange can defer both). Figures are a year-1 estimate at your 24.0% rate — not tax advice; consult a CPA.
Schools (NCES district)
- District
- Orleans Parish
- NCES district ID
- 2201170
- Math proficiency
- 11% ▼ -52.00%
- Reading proficiency
- 27% ▼ -46.00%
- Median HH income
- $37,011
- Composite
- 15.78/100
- National rank
- #9271
- State rank
- #69 of 98 in LA
Livability — New Orleans
- Score
- 81/100
- State rank
- #3
- US rank
- #1383
Category grades
Schools grade is shown separately in the Schools card above.
Census & demographics
- Census place
- New Orleans, LA
- County
- Orleans Parish · 338,817 people
- City population
- 338,817
- Metro
- New Orleans-Metairie, LA
- Population (ZIP)
- 37,253
- Household income
- $53,143
- Rent vs Own
- Severe rent burden
- 3381.0
Population outlook (Orleans County) Hauer SSP2
- Today (2025)
- 513,025 people
- By 2030
- 575,781 · +12.2%
- By 2040
- 700,174 · +36.5%
- By 2050
- 826,541 · +61.1%
- By 2075
- 1,123,374 · +119.0%
- By 2100
- 1,355,609 · +164.2%
Race, ethnicity, and origin ACS 2023
- Neighborhood character
- Diverse neighborhood (Simpson 0.64)
- Race & ethnicity
- Black 44% White 40% Two or more races 10% Hispanic / Latino 9% Asian 1%
- Hispanic origin (detail)
- Mexican 2%
- Common ancestry
- Lithuanian 8% Slovak 2% Romanian 1%
- Foreign-born
- 6% · Canada, Jamaica
- Languages at home
- 91% English-only · Spanish 6% French/Haitian/Cajun 1% Other Indo-European 0%
Political lean MEDSL · Orleans
- 2024 margin
- Solid D (+67.0) · D 82.2% · R 15.2% · Other 2.7%
- 2008→2024 swing
- +6.7pp toward D · 2008: 60.3pp · 2024: 67.0pp
- All cycles
- 2024: D+67.0 2020: D+68.2 2016: D+66.2 2012: D+62.5 2008: D+60.3
Not yet ingested
- Civics
- —
Market trends
- HPI YoY
- ▼ -135.38%
- Current HPI
- 253.1929
- Rent YoY
- ▼ -0.20%
- Metro
- New Orleans-Metairie, LA
- State GDP YoY
- ▲ 3.29%
- F500 in state
- 10
Industry mix (Fortune 500 HQ in LA)
| Industry | F500 HQs | Revenue |
|---|---|---|
| Telecommunications | 2 | $23B |
|
||
| Utilities | 1 | $12B |
|
||
| Wholesale / Distribution | 1 | $5B |
|
||
| Advertising | 1 | $2B |
|
||
Price history
+175.5% since first listed10 events — show timeline
- 2026-04-14 Listed $165,000 GSREIN
- 2026-04-14 Listed $165,000 AcadianaMLS
- 1999-07-15 Sold (Public Records) $50,000 Public Records
- 1999-07-15 Sold (MLS) $50,000 GSREIN
- 1998-12-22 Listed $56,000 GSREIN
- 1998-12-22 Listed $56,000 AcadianaMLS
- 1996-07-03 Sold (Public Records) $58,000 Public Records
- 1996-07-03 Sold (MLS) $58,800 GSREIN
- 1996-04-15 Listed $59,900 GSREIN
- 1996-04-15 Listed $59,900 AcadianaMLS
Property tax history
+8.5%/yrLatest (2026): $2,831 · +181.5% YoY. Source: county tax records.
Cash-flow waterfall
monthlySold comps — $/sqft
last 12 mo · ≤1 miLoading sold comps…