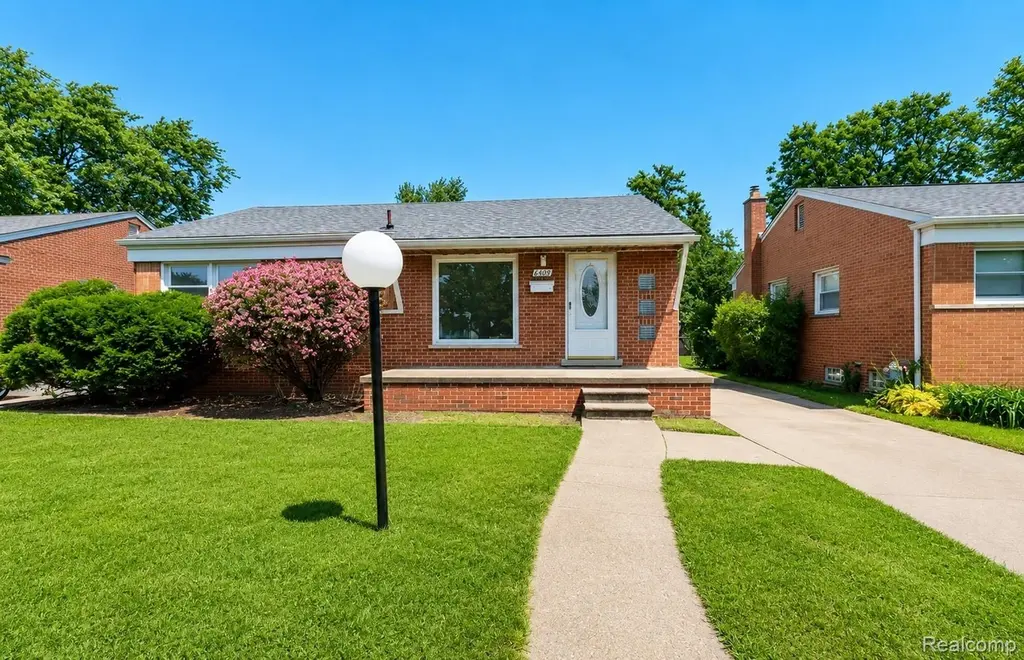
6690 Deering St · Garden City, MI
Flood risk 1/10 · Minimal
- FEMA flood zone
- X (unshaded)
- Chance of flooding over 30 yrs
- 0.0%
- Est. flood insurance / yr
- $473 – $860
Fire risk 1/10 · Minimal
- Est. fire insurance / yr
- $784 – $1,456
Heat risk 3/10 · Minor
- Hot days now (above 98°F)
- 7 days/yr
- Hot days in 30 yrs
- 15 days/yr
Wind risk 2/10 · Minimal
- Chance of severe wind over 30 yrs
- —
Air-quality risk 2/10 · Minimal
- Unhealthy air days now
- 1 days/yr
- Unhealthy air days in 30 yrs
- 2 days/yr
Risk factors via First Street. Map © Google.
Why this score? — see what drove the F grade
The composite is a weighted blend of 9 inputs, each scored 0–100. Each bar is that input's sub-score; the figure is the points it added to the 100-point composite (weight × sub-score).
- Cash flow +7.7/30.0
- Livability +4.1/5.0
- Rent growth +3.4/5.0
- 1% rule +3.2/10.0
- Schools +2.6/10.0
- Condition / age +2.5/5.0
- ARV discount +1.9/15.0
- DSCR +1.8/10.0
- Appreciation +0.0/10.0
$209,900
🖨 Deal sheet 📄 Offer letter ✓ Due diligence
Listing remarks MLS
Welcome to your new home! This amazing brick ranch features 3 bedrooms with original hardwood floors flowing throughout the living room, hallway, and bedrooms. The spacious kitchen offers an excellent layout, while the large basement is ready for your finishing touches and includes a separate laundry and storage area. Outside, enjoy a fully fenced backyard with plenty of space, along with a two-car garage. Conveniently located near schools, and shopping, parks. BATVAI.
Key facts
- Spacious kitchen
- Large basement
- Two-car garage
Tags
Property features AI
Finance
- Other: No pool
- Financial info: Financial details not provided
- HOA & community: No HOA information provided
Exterior
- Parking: Detached 2-car garage
- Security: Security details not provided
- Utilities: Public water; Public sewer
- Home design: Single-family residence; One level; Ground-level entry
- Construction: Brick construction
- Exterior features: Paved road access; Lot dimensions approximately 50 x 134.55 (0.15 acres)
Interior
- Kitchen: Kitchen details not provided
- Bedrooms: Bedrooms not specified
- Flooring: Flooring details not provided
- Bathrooms: 1 full bathroom
- Heating & cooling: Forced air heating (natural gas); No central cooling
- Interior features: Full, partially finished basement; Total of 5 rooms
- Laundry & utility: Laundry details not provided
Neighborhood map
What this means for you Summary
Snapshot
- This is a 3-bed/1.0-bath single-family listed at $210k.
Deal economics
- At list price, monthly cash flow is $-238 ($-3k/yr) — negative.
- To cash-flow at today's rent, offer at most $168k (20.0% below list).
- To meet the 1% rule (rent ≥ 1% of price), the offer needs to be $173k (17.6% below list).
- Recommended offer: $168k (20.0% below list) — sets the bar for cash-flow.
Location & tenants
- Location reads 82/100 on livability (#53 in MI, #1,047 nationally) — a professional / high-income tenant draw. Strengths: cost of living A+, housing A+, commute A; Watch: employment C-, schools D-.
- Garden City Public Schools (suburban): math 22% / reading 36% proficiency, ranked #365 of 540 in MI (top 68%) — low school quality limits family demand, transient renter base, plan for 1-2y turnover.
- Market conditions: Rents rising (+3.6%/yr); 134 active listings in the ZIP; 15 comparable units currently listed for rent nearby; rentals leasing fast (median 10d on market — plan ~1-2 weeks tenant-placement turnaround); 2,639 units permitted in Wayne County in 2024 (1,216 in 5+ unit buildings).
- This rent runs 31% of the median local income ($67k/yr) — at the standard rent-burdened threshold; future hikes will face affordability resistance.
Forward outlook
- Local home prices are declining (-3.0%/yr); year-one equity from $1k of loan paydown is wiped out by about $6k of value loss. Plan a longer hold.
- Wayne County population projected at -17% by 2050 — secular population decline; favor cash flow + early exit over multi-decade hold.
Negotiation context
- Only 5 days on market — expect competitive offers; lowballing is unlikely to land.
- 18 sale attempts since 4y ago with the ask held roughly flat each time — persistent listings suggest the price (not the market) is what's stuck; bring a comps-based counter.
- Current owner paid $160k; 31% above their basis — modest negotiation headroom, anchor on the comps not their cost.
Risks & watch-outs
- Watch-outs: built in 1954 — expect roof / HVAC / electrical / plumbing capex.
Questions for the listing agent
- What do current leases actually rent for vs. the listed asking? Can we see a recent rent roll and the last 12 months of T-12 income?
- Built in 1954 — when were the roof, HVAC, electrical panel, plumbing, and water heater last replaced?
- Is there a deadline driving the sale (1031 exchange, divorce, estate, relocation)? That informs how much negotiation room exists.
- Schools are D-rated, which usually means shorter tenancies and higher turnover. Who's the typical renter profile here, and what's been the actual vacancy rate?
- The area grade is low — what's the realistic commute time and amenity access for the typical tenant pool here? Any planned neighborhood developments (good or bad) we should know about?
- What's the average days-on-market for RENTAL listings here right now (not sales)? A rising rental-DOM trend means longer vacancies and softer asking-rent achievability than the comps imply.
- What's the recent tenant-quality profile in this submarket — average credit score on applications, eviction rate, late-payment / NSF rate, and stable-employment percentage? A property-management company in the area should have these aggregated.
- How much new for-sale + rental construction is in the pipeline within 1–3 miles? Heavy new supply typically softens prices + rents 12–24 months out; constrained supply supports both.
Investment metrics
- 1% rule
- 0.82% ✗
- Cap rate
- 4.93%
- Cash-on-cash
- -4.86%
- DSCR
- 0.78
- GRM
- 10.1
CMA / ARV
- ARV (on-the-fly)
- $186,732
- Comps found
- 12
Show comp detail 12 sales within ~0.75 mi
| Address | Dist | Beds/Ba | Sqft | Sold | Price | $/sf | Match |
|---|---|---|---|---|---|---|---|
| 6582 Sterling Ct | 0.14mi | 3/1.5 | 1,000 (-2%) | 4mo | $195,000 | $195 | 84 |
| 6331 Helen St | 0.29mi | 3/1.0 | 1,113 (+8%) | 2mo | $225,000 | $202 | 71 |
| 28710 Cambridge St | 0.44mi | 3/2.0 | 1,030 (+0%) | 5mo | $175,000 | $170 | 70 |
| 7256 Deering St | 0.36mi | 3/1.0 | 936 (-9%) | 1mo | $180,000 | $192 | 67 |
| 7427 Arcola St | 0.48mi | 3/1.0 | 941 (-8%) | 3mo | $213,000 | $226 | 62 |
| 28627 Bridge St | 0.42mi | 3/2.0 | 1,100 (+7%) | 5mo | $175,000 | $159 | 60 |
| 28824 Birchlawn St | 0.68mi | 2/1.0 (-1) | 1,034 (+1%) | 2mo | $60,000 | $58 | 60 |
| 7435 Lathers St | 0.51mi | 3/1.0 | 1,120 (+9%) | 2mo | $200,000 | $179 | 59 |
| 7457 Harrison St | 0.55mi | 3/1.0 | 1,120 (+9%) | 2mo | $169,900 | $152 | 58 |
| 7370 Amboy St | 0.66mi | 3/1.5 | 1,116 (+9%) | 0mo | $302,000 | $271 | 52 |
| 28807 Block St | 0.60mi | 3/1.0 | 895 (-13%) | 2mo | $163,200 | $182 | 49 |
| 7641 N Inkster Rd | 0.63mi | 3/1.0 | 906 (-12%) | 5mo | $150,000 | $166 | 47 |
Match score weights: distance 35% · size 25% · config 20% · recency 20%. Top-matched comps best support the ARV.
Projected returns pro-forma
-3.0% appreciation · 3.65% rent growth · sell at horizon
- IRR
- -23.7%
- Equity multiple
- 0.18×
- Total profit
- $-47,902
- Equity at exit
- $31,297
- IRR
- -16.6%
- Equity multiple
- 0.05×
- Total profit
- $-55,998
- Equity at exit
- $18,148
Cash invested: $58,772 (down + closing). Projections, not guarantees.
Landlord ↔ Tenant lean methodology
- Overall (STATE)
- 62 Landlord-Friendly
- State Michigan
- 62 Landlord-Friendly · EVEN
- County
- — inherits STATE
- City
- — inherits STATE
ZIP-level market 48135
- Rents YoY
- 3.6%
- Active inventory
- 134
- Price-to-rent
- 10.1×
Monthly cashflow live
- Estimated rent
- $1,729 high interval (Pro) →
- Mortgage (P&I)
- −$1,101
- Tax from tax record
- −$415 /mo · $4,982/yr
- Insurance
- −$87
- HOA
- −$0
- Vacancy / Maint / Mgmt
- −$363
- Net cashflow
- $-238
Break-even live
UW: 25.0% down · 7.5% · 30yr · 1.5% tax · 5.0% vac · 8.0% maint · 8.0% mgmt
Financing live
Cash to close
- Down payment
- $52,475
- Closing costs
- $6,297
- Reserves months
- —
- Total cash needed
- —
Loan-product check · same deal, 3 products live
Conventional
25% down · 7.5% · 30yr
- Down + closing
- —
- Monthly P&I
- —
- Monthly cashflow
- —
- DSCR
- —
- Eligible?
- —
Personal DTI + credit; lowest rate.
DSCR
20% down · 8.5% · 30yr
- Down + closing
- —
- Monthly P&I
- —
- Monthly cashflow
- —
- DSCR
- —
- Eligible?
- —
No personal income docs; deal must DSCR.
Hard money
10% down · 12.0% · 12mo
- Down + closing
- —
- Monthly P&I
- —
- Monthly cashflow
- —
- DSCR
- —
- Eligible?
- —
Short-term bridge; refi at stabilization.
Rent comps 15 comps
| Address | Beds | Baths | Sqft | Rent | $/sqft | DOM | Units | Dist |
|---|---|---|---|---|---|---|---|---|
| 7048 Deering St Garden City, MI | 3.0 | 1.0 | 910 | $1,500 | $1.65 | 17d | 1 | 0.24mi |
| 6365 Helen St Garden City, MI | 3.0 | 1.0 | 1195 | $1,650 | $1.38 | 10d | 1 | 0.26mi |
| 6954 Inkster Rd Dearborn Heights, MI | 1.0–2.0 | 1.0–1.5 | 837 | $1,339 | $1.60 | 2d | 9 | 0.30mi |
| 7435 Lathers St Westland, MI | 3.0 | 1.0 | 1120 | $1,900 | $1.70 | 16d | 1 | 0.49mi |
| 5927 Lathers St Garden City, MI | 3.0 | 1.0 | 1000 | $1,600 | $1.60 | 1d | 1 | 0.51mi |
| 7457 Harrison St Westland, MI | 3.0 | 1.0 | 1120 | $1,900 | $1.70 | 1d | 1 | 0.53mi |
| 5839 Helen St Garden City, MI | 3.0 | 1.0 | 984 | $1,500 | $1.52 | 24d | 1 | 0.53mi |
| 7484 Affeldt St Westland, MI | 3.0 | 1.0 | 1120 | $1,500 | $1.34 | 24d | 1 | 0.56mi |
| 26620 Baldwin St Dearborn Heights, MI | 3.0 | 1.5 | 1156 | $1,800 | $1.56 | 1d | 1 | 0.77mi |
| 79 3rd St Unit 79 Dearborn Heights, MI | 2.0 | 1.0 | 840 | $1,339 | $1.59 | 24d | 1 | 0.93mi |
| 181 Terri Dr Unit 181 Dearborn Heights, MI | 2.0 | 2.0 | 840 | $1,119 | $1.33 | 5d | 1 | 0.97mi |
| 27201 Canfield St W Dearborn Heights, MI | 1.0–2.0 | 1.0–2.0 | 852 | $1,499 | $1.76 | 1d | 22 | 1.18mi |
| 5722 Centralia St Dearborn Heights, MI | 3.0 | 1.0 | 999 | $1,750 | $1.75 | 1d | 1 | 1.35mi |
| 641 Gilman St Garden City, MI | 3.0 | 1.0 | 1300 | $2,600 | $2.00 | 16d | 1 | 1.40mi |
| 7014 Kinmore St Dearborn Heights, MI | 3.0 | 1.0 | 960 | $1,900 | $1.98 | 21d | 1 | 1.47mi |
Listing history 50 events
-
2026-06-15days on market $209,900 Active 5 DOM
-
2026-06-13days on market $209,900 Active 3 DOM
-
2026-06-13pricedays on market $209,900 Active 2 DOM
-
2026-06-09days on market $219,900 Active 22 DOM
-
2026-06-08days on market $219,900 Active 21 DOM
-
2026-06-07days on market $219,900 Active 20 DOM
-
2026-06-04days on market $219,900 Active 17 DOM
-
2026-06-03days on market $219,900 Active 16 DOM
-
2026-06-02days on market $219,900 Active 15 DOM
-
2026-06-01days on market $219,900 Active 14 DOM
-
2026-05-31days on market $219,900 Active 13 DOM
-
2026-05-18$219,900 Active
Show marketing remark (473 chars)
Welcome to your new home! This amazing brick ranch features 3 bedrooms with original hardwood floors flowing throughout the living room, hallway, and bedrooms. The spacious kitchen offers an excellent layout, while the large basement is ready for your finishing touches and includes a separate laundry and storage area. Outside, enjoy a fully fenced backyard with plenty of space, along with a two-car garage. Conveniently located near schools, and shopping, parks. BATVAI.
-
2026-05-18$219,900 Active 473-char remark
Show marketing remark (473 chars)
Welcome to your new home! This amazing brick ranch features 3 bedrooms with original hardwood floors flowing throughout the living room, hallway, and bedrooms. The spacious kitchen offers an excellent layout, while the large basement is ready for your finishing touches and includes a separate laundry and storage area. Outside, enjoy a fully fenced backyard with plenty of space, along with a two-car garage. Conveniently located near schools, and shopping, parks. BATVAI.
-
2026-05-15historical
-
2026-04-30$219,900 Active
-
2026-04-30$219,900 Active
-
2026-03-16historical
-
2026-03-12$214,900 Active
-
2026-03-12$214,900 Active
-
2026-03-06historical Accepting Backup Offers
-
2026-03-06historical Active Under Contract
-
2026-03-06status Pending
-
2026-03-06status Pending
-
2026-03-03historical
-
2026-03-03historical
-
2026-02-21price $214,900
-
2026-02-20price $214,900
-
2026-02-13$224,900 Active
-
2026-02-13$224,900 Active
-
2026-02-12historical
-
2026-01-16historical $1,800
-
2025-12-30status Pending
-
2025-12-30status Pending
-
2025-12-22historical
-
2025-12-22historical
-
2025-12-10$224,900 Active
-
2025-12-10$1,800
-
2025-12-10historical $1,800
-
2025-12-10$224,900 Active
-
2025-12-09$1,800
-
2025-12-09historical
-
2025-12-09historical
-
2025-11-19$224,900 Active
-
2025-11-19$224,900 Active
-
2025-09-22status Pending
-
2025-09-22status Pending
-
2025-09-19historical
-
2025-09-19historical
-
2025-08-30$225,000 Active
-
2025-08-30$225,000 Active
ⓘ Source: listings_history table (triggers on properties + properties_extension) + one-shot
backfill from property_details.listing_events for pre-trigger history.
Tax reassessment forecast MI · Partial reset (capped growth)
- Current annual tax
- $4,982 · $415/mo
- Projected year-2 tax
- $4,982 · $415/mo
- Expected delta
- $0/yr ($0/mo · 0.0%)
ⓘ Screening estimate from a state-policy table — verify with the county assessor before closing.
Climate risk First Street
- Flood 1/10 Low FEMA zone X (unshaded) · 0% chance over 30 yrs
- Wildfire 1/10 Low
- Heat 3/10 Moderate 7 d/yr ≥98°F today · 15 d/yr by 30 yrs out
- Wind 2/10 Low
- Air quality 2/10 Low 1 unhealthy d/yr today · 2 by 30 yrs out
Nearby sold comps map
Loading sold comps map…
Walkable amenities ~0.75 mi
Loading nearby amenities…
Taxation est. · year 1
- Rental income
- $20,743
- − Mortgage interest
- −$11,758
- − Property taxes
- −$4,982
- − Insurance
- −$1,050
- − Repairs & maintenance
- −$1,659
- − Management
- −$1,659
- − Depreciation
- −$6,106
- Taxable loss
- −$6,472
- Est. tax savings @ 24.0%
- +$1,553
- After-tax cash flow
- $-1,301/yr
For passive investors: Depreciation is non-cash, so a rental often shows a tax loss while cash-flowing — sheltering income. Rental losses are passive: they offset passive income freely, and up to $25,000/yr can offset ordinary (W-2) income if you actively participate and your MAGI is under $100k (phasing out to $0 by $150k); unused losses carry forward. On sale, claimed depreciation is recaptured at up to 25%, and gains may owe capital-gains tax (a 1031 exchange can defer both). Figures are a year-1 estimate at your 24.0% rate — not tax advice; consult a CPA.
Schools (NCES district)
- District
- Garden City Public Schools
- NCES district ID
- 2615540
- Math proficiency
- 22% ▼ -11.00%
- Reading proficiency
- 36% ▼ -13.00%
- Median HH income
- $52,165
- Composite
- 25.53/100
- National rank
- #7433
- State rank
- #365 of 540 in MI
Livability — Garden City
- Score
- 82/100
- State rank
- #53
- US rank
- #1047
Category grades
Schools grade is shown separately in the Schools card above.
Census & demographics
- Census place
- Garden City, MI
- County
- Wayne County · 1,562,939 people
- City population
- 26,739
- Metro
- Detroit-Warren-Dearborn, MI
- Population (ZIP)
- 26,739
- Household income
- $67,294
- Rent vs Own
- Severe rent burden
- 509.0
Population outlook (Wayne County) Hauer SSP2
- Today (2025)
- 1,675,273 people
- By 2030
- 1,620,300 · -3.3%
- By 2040
- 1,502,341 · -10.3%
- By 2050
- 1,384,039 · -17.4%
- By 2075
- 1,124,592 · -32.9%
- By 2100
- 881,193 · -47.4%
Race, ethnicity, and origin ACS 2023
- Neighborhood character
- Predominantly White (82%)
- Race & ethnicity
- White 82% Two or more races 8% Black 7% Hispanic / Latino 5%
- Hispanic origin (detail)
- Mexican 5%
- Common ancestry
- Romanian 13% Italian 4% Slovak 3%
- Foreign-born
- 4% · Canada
- Languages at home
- 94% English-only · Arabic 3% Spanish 1% Other Indo-European 1%
Political lean MEDSL · Wayne
- 2024 margin
- Strong D (+29.0) · D 62.7% · R 33.7% · Other 3.6%
- 2008→2024 swing
- -20.5pp toward R · 2008: 49.5pp · 2024: 29.0pp
- All cycles
- 2024: D+29.0 2020: D+38.1 2016: D+37.3 2012: D+46.9 2008: D+49.5
Not yet ingested
- Civics
- —
Market trends
- HPI YoY
- ▼ -265.28%
- Current HPI
- 212.5713
- Rent YoY
- ▲ 3.65%
- Metro
- Detroit-Warren-Dearborn, MI
- State GDP YoY
- ▲ 1.37%
- F500 in state
- 28
Industry mix (Fortune 500 HQ in MI)
| Industry | F500 HQs | Revenue |
|---|---|---|
| Automotive Parts | 3 | $48B |
|
||
| Automotive | 2 | $372B |
|
||
| Chemicals | 1 | $45B |
|
||
| Automotive Retail | 1 | $29B |
|
||
| Healthcare / Medical Devices | 1 | $23B |
|
||
| Automotive Technology | 1 | $20B |
|
||
Price history
+37.4% since first listed48 events — show timeline
- 2026-05-18 Listed $219,900 REALCOMP
- 2026-05-18 Listed $219,900 MiRealSource-MiMLS
- 2026-05-15 Listing Removed — MiRealSource-MiMLS
- 2026-04-30 Listed $219,900 REALCOMP
- 2026-04-30 Listed $219,900 MiRealSource-MiMLS
- 2026-03-16 Listing Removed — MiRealSource-MiMLS
- 2026-03-12 Listed $214,900 REALCOMP
- 2026-03-12 Listed $214,900 MiRealSource-MiMLS
- 2026-03-06 Contingent — MiRealSource-MiMLS
- 2026-03-06 Contingent — REALCOMP
- 2026-03-06 Pending — MiRealSource-MiMLS
- 2026-03-06 Pending — REALCOMP
- 2026-03-03 Listing Removed — REALCOMP
- 2026-03-03 Listing Removed — MiRealSource-MiMLS
- 2026-02-21 Price Changed $214,900 MiRealSource-MiMLS
- 2026-02-20 Price Changed $214,900 REALCOMP
- 2026-02-13 Listed $224,900 MiRealSource-MiMLS
- 2026-02-13 Listed $224,900 REALCOMP
- 2026-02-12 Coming Soon — MiRealSource-MiMLS
- 2026-01-16 Rental Removed $1,800 REALSOURCE
- 2025-12-30 Pending — MiRealSource-MiMLS
- 2025-12-30 Pending — REALCOMP
- 2025-12-22 Listing Removed — REALCOMP
- 2025-12-22 Listing Removed — MiRealSource-MiMLS
- 2025-12-10 Listed $224,900 REALCOMP
- 2025-12-10 Listed for Rent $1,800 REALSOURCE
- 2025-12-10 Rental Removed $1,800 REALCOMP
- 2025-12-10 Listed $224,900 MiRealSource-MiMLS
- 2025-12-09 Listed for Rent $1,800 REALCOMP
- 2025-12-09 Listing Removed — REALCOMP
- 2025-12-09 Listing Removed — MiRealSource-MiMLS
- 2025-11-19 Listed $224,900 REALCOMP
- 2025-11-19 Listed $224,900 MiRealSource-MiMLS
- 2025-09-22 Pending — MiRealSource-MiMLS
- 2025-09-22 Pending — REALCOMP
- 2025-09-19 Listing Removed — REALCOMP
- 2025-09-19 Listing Removed — MiRealSource-MiMLS
- 2025-08-30 Listed $225,000 REALCOMP
- 2025-08-30 Listed $225,000 MiRealSource-MiMLS
- 2023-01-20 Sold (Public Records) $160,500 Public Records
- 2022-12-16 Sold (MLS) $160,500 MiRealSource-MiMLS
- 2022-12-16 Sold (MLS) $160,500 REALCOMP
- 2022-11-03 Pending — MiRealSource-MiMLS
- 2022-11-03 Pending — REALCOMP
- 2022-10-21 Listed $160,000 MiRealSource-MiMLS
- 2022-10-21 Listed $160,000 REALCOMP
- 2022-10-20 Coming Soon $160,000 MiRealSource-MiMLS
- 2022-10-20 Coming Soon $160,000 REALCOMP
Property tax history
+9.9%/yrLatest (2025): $4,982 · -20.3% YoY. Source: county tax records.
Cash-flow waterfall
monthlySold comps — $/sqft
last 12 mo · ≤1 miLoading sold comps…