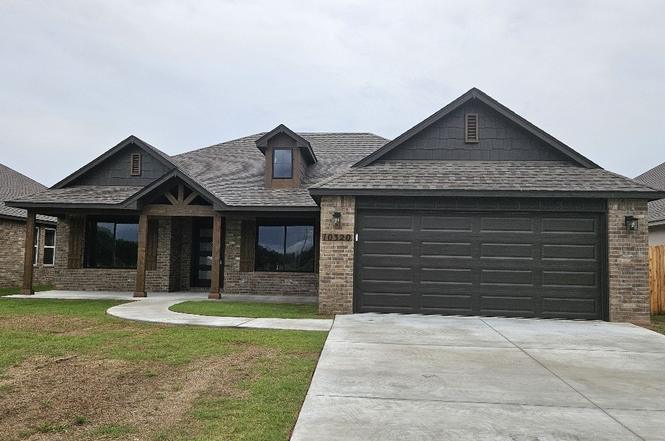
10320 E 132nd St S · Bixby, OK
Flood risk No data
- FEMA flood zone
- —
- Chance of flooding over 30 yrs
- —
- Est. flood insurance / yr
- —
Fire risk No data
- Est. fire insurance / yr
- —
Heat risk No data
- Hot days now (above threshold)
- —
- Hot days in 30 yrs
- —
Wind risk No data
- Chance of severe wind over 30 yrs
- —
Air-quality risk No data
- Unhealthy air days now
- —
- Unhealthy air days in 30 yrs
- —
Risk factors via First Street. Map © Google.
Why this score? — see what drove the F grade
The composite is a weighted blend of 9 inputs, each scored 0–100. Each bar is that input's sub-score; the figure is the points it added to the 100-point composite (weight × sub-score).
- Cash flow +9.5/30.0
- Livability +3.6/5.0
- Schools +3.5/10.0
- Rent growth +3.3/5.0
- DSCR +2.7/10.0
- Condition / age +2.5/5.0
- 1% rule +1.7/10.0
- ARV discount +1.3/15.0
- Appreciation +0.0/10.0
$349,000
🖨 Deal sheet 📄 Offer letter ✓ Due diligence
Listing remarks
STUNNING NEW CONSTRUCTION BY CRAIG BOOS WITH DESIGNER COLORS THROUGHOUT. ISLAND IN KITCHEN WITH GRANITE 6 CM CHISELED EDGE, HARDWOOD FLOORS IN ENTRY, FAMILY AND HALLWAY WITH CUSTOM STAIN. UPGRADED APPLIANCE PACKAGE. HAND TROWELED WALLS AND CEILINGS. CUSTOM TILED SHOWER IN MASTER BATH. LARGE COVERED PATIO FOR GREAT OUTDOOR LIVING. POOL AND AMENITIES TO COME IN 2ND PHASE HOA DUES ARE ESTIMATED. BUILDER INCENTIVE OF $15,000 FOR BUYERS CLOSING COSTS OR UPGRADES. COMPLETION DATE MARCH 31, 2026
Key facts
- Large covered patio
- Island in kitchen
- Hardwood floors
Tags
Property features AI
Finance
- HOA & community: Homeowners association with $500 annual fee; Neighborhood sidewalks
Exterior
- Parking: Attached garage; 2-car garage
- Security: No safety shelter
- Utilities: Public water; Public sewer; Electricity available; Natural gas available; Cable available; Phone available
- Home design: Single-story home; Faces north; Slab foundation
- Construction: Built by builder; Brick and wood frame construction; Asphalt/fiberglass roof; Home warranty included
- Exterior features: Covered patio; Porch; Privacy fence
Interior
- Kitchen: Island; Pantry; Dishwasher; Disposal; Microwave; Oven; Range; Plumbed for ice maker
- Bedrooms: Three first-floor bedrooms; Master bedroom with private bath and walk-in closet
- Flooring: Carpet; Hardwood; Tile
- Bathrooms: Two full bathrooms; Master bath with double sink and shower
- Heating & cooling: Central heating (gas); Central air conditioning
- Interior features: Granite counters; Quartz counters; Stone counters; High ceilings; Ceiling fan(s); Vinyl window frames
- Laundry & utility: Interior utility room; Electric dryer hookup; Gas water heater
Neighborhood map
What this means for you Summary
Snapshot
- This is a 4-bed/2.0-bath single-family listed at $349k.
Deal economics
- At list price, monthly cash flow is $-241 ($-3k/yr) — negative.
- To cash-flow at today's rent, offer at most $306k (12.2% below list).
- To meet the 1% rule (rent ≥ 1% of price), the offer needs to be $235k (32.7% below list).
- Recommended offer: $235k (32.7% below list) — sets the bar for 1% rule.
- Cap rate 5.5% vs local median 3.6% in Bixby — top-decile yield for the area; either an underpriced asset or a hidden risk that comps aren't pricing in. Stress-test before assuming the spread holds.
Location & tenants
- Location reads 72/100 on livability (#24 in OK) — a middle-class / working-renter tenant base. Strengths: crime A+, employment A+, housing A+; Watch: amenities F, commute F, health & safety F.
- Bixby (suburban): math 39% / reading 36% proficiency, ranked #15 of 270 in OK (top 6%) — families likely to look elsewhere, expect single-tenant / working-renter base with shorter leases; only 19% free/reduced lunch — higher-income household profile.
- Market conditions: Rents rising (+3.3%/yr); 789 active listings in the ZIP; 3 comparable units currently listed for rent nearby; rentals leasing fast (median 3d on market — plan ~1-2 weeks tenant-placement turnaround); solid renter incomes; 2,818 units permitted in Tulsa County in 2024 (518 in 5+ unit buildings).
Forward outlook
- Local home prices are declining (-3.0%/yr); year-one equity from $2k of loan paydown is wiped out by about $10k of value loss. Plan a longer hold.
- Tulsa County population projected at +30% by 2050 — long-run rental-demand tailwind backs the buy-and-hold thesis.
Negotiation context
- It's been on market 101 days — a 9% lower offer ($318k) is reasonable based on typical stale-listing flexibility.
Questions for the listing agent
- What do current leases actually rent for vs. the listed asking? Can we see a recent rent roll and the last 12 months of T-12 income?
- It's been on market 101 days. Have you received any prior offers? Is the seller open to a 33% concession, seller financing, or rate buy-down credit?
- What does the HOA fee cover, when was the last increase, and are there any pending special assessments or reserve-fund shortfalls?
- Why hasn't it sold? Are there any deal-killer items the seller is aware of (foundation, flood, title, zoning, code violations)?
- Is there a deadline driving the sale (1031 exchange, divorce, estate, relocation)? That informs how much negotiation room exists.
- Schools are B-rated — typically a magnet for longer-tenancy family renters. What's the average tenant stay here, and is there a school-zone premium baked into asking?
- The area grade is low — what's the realistic commute time and amenity access for the typical tenant pool here? Any planned neighborhood developments (good or bad) we should know about?
- What's the average days-on-market for RENTAL listings here right now (not sales)? A rising rental-DOM trend means longer vacancies and softer asking-rent achievability than the comps imply.
- What's the recent tenant-quality profile in this submarket — average credit score on applications, eviction rate, late-payment / NSF rate, and stable-employment percentage? A property-management company in the area should have these aggregated.
- How much new for-sale + rental construction is in the pipeline within 1–3 miles? Heavy new supply typically softens prices + rents 12–24 months out; constrained supply supports both.
Investment metrics
- 1% rule
- 0.67% ✗
- Cap rate
- 5.46%
- Cash-on-cash
- -2.96%
- DSCR
- 0.87
- GRM
- 12.4
CMA / ARV
- ARV (on-the-fly)
- $306,775
- Comps found
- 12
Show comp detail 12 sales within ~0.75 mi
| Address | Dist | Beds/Ba | Sqft | Sold | Price | $/sf | Match |
|---|---|---|---|---|---|---|---|
| 10113 E 132nd St S | 0.12mi | 4/2.0 | 1,796 (+2%) | 0mo | $309,900 | $173 | 90 |
| 10208 E 131st Pl S | 0.09mi | 4/2.0 | 1,831 (+4%) | 1mo | $326,000 | $178 | 87 |
| 13154 S 100th EastAvenue | 0.21mi | 4/2.0 | 1,796 (+2%) | 1mo | $314,900 | $175 | 85 |
| 13508 S 100th EastAvenue | 0.19mi | 4/2.0 | 1,831 (+4%) | 1mo | $314,900 | $172 | 83 |
| 9915 E 135th St S | 0.37mi | 4/2.0 | 1,748 (-0%) | 1mo | $302,425 | $173 | 82 |
| 13125 S 105th EastAvenue | 0.11mi | 3/2.0 (-1) | 1,905 (+9%) | 2mo | $359,000 | $188 | 74 |
| 9903 E 135th St S | 0.38mi | 4/2.0 | 1,831 (+4%) | 1mo | $314,900 | $172 | 74 |
| 9909 E 135th St S | 0.50mi | 4/2.0 | 1,796 (+2%) | 2mo | $311,840 | $174 | 71 |
| 10328 E 132nd St S | 0.02mi | 3/2.0 (-1) | 2,013 (+15%) | 2mo | $368,000 | $183 | 67 |
| 13135 S 105th EastAvenue | 0.10mi | 3/2.0 (-1) | 2,013 (+15%) | 2mo | $369,900 | $184 | 64 |
| 9323 E 132nd Pl S | 0.60mi | 4/2.0 | 1,853 (+6%) | 2mo | $322,250 | $174 | 60 |
| 9417 E 131st Pl S | 0.56mi | 3/2.0 (-1) | 1,512 (-14%) | 1mo | $285,000 | $188 | 45 |
Match score weights: distance 35% · size 25% · config 20% · recency 20%. Top-matched comps best support the ARV.
Projected returns pro-forma
-3.0% appreciation · 3.34% rent growth · sell at horizon
- IRR
- -21.0%
- Equity multiple
- 0.27×
- Total profit
- $-71,257
- Equity at exit
- $52,037
- IRR
- -13.9%
- Equity multiple
- 0.19×
- Total profit
- $-79,130
- Equity at exit
- $30,175
Cash invested: $97,720 (down + closing). Projections, not guarantees.
Landlord ↔ Tenant lean methodology
- Overall (STATE)
- 83 Strongly Landlord-Friendly
- State Oklahoma
- 83 Strongly Landlord-Friendly · R+20
- County
- — inherits STATE
- City
- — inherits STATE
ZIP-level market 74008
- Rents YoY
- 3.3%
- Active inventory
- 789
- Price-to-rent
- 12.4×
Monthly cashflow live
- Estimated rent
- $2,348 medium interval (Pro) →
- Mortgage (P&I)
- −$1,830
- Tax from tax record
- −$79 /mo · $943/yr
- Insurance
- −$145
- HOA
- −$42
- Vacancy / Maint / Mgmt
- −$493
- Net cashflow
- $-241
Break-even live
UW: 25.0% down · 7.5% · 30yr · 1.5% tax · 5.0% vac · 8.0% maint · 8.0% mgmt
Financing live
Cash to close
- Down payment
- $87,250
- Closing costs
- $10,470
- Reserves months
- —
- Total cash needed
- —
Loan-product check · same deal, 3 products live
Conventional
25% down · 7.5% · 30yr
- Down + closing
- —
- Monthly P&I
- —
- Monthly cashflow
- —
- DSCR
- —
- Eligible?
- —
Personal DTI + credit; lowest rate.
DSCR
20% down · 8.5% · 30yr
- Down + closing
- —
- Monthly P&I
- —
- Monthly cashflow
- —
- DSCR
- —
- Eligible?
- —
No personal income docs; deal must DSCR.
Hard money
10% down · 12.0% · 12mo
- Down + closing
- —
- Monthly P&I
- —
- Monthly cashflow
- —
- DSCR
- —
- Eligible?
- —
Short-term bridge; refi at stabilization.
Rent comps 3 comps
| Address | Beds | Baths | Sqft | Rent | $/sqft | DOM | Units | Dist |
|---|---|---|---|---|---|---|---|---|
| 8950 E 133rd St S Bixby, OK | 4.0 | 3.0 | 2207 | $2,195 | $0.99 | 19d | 1 | 0.83mi |
| 8554 E 127th St S Bixby, OK | 4.0 | 2.0 | 1515 | $1,795 | $1.18 | 3d | 1 | 1.17mi |
| 4500 W Winston St Broken Arrow, OK | 4.0 | 2.0 | 1812 | $2,445 | $1.35 | 1d | 1 | 1.49mi |
HOA detail
- Monthly dues
- $42 · $504/yr
- Likely covers
- pool
Listing history 15 events
-
2026-06-18days on market $349,000 Active 101 DOM
-
2026-06-17days on market $349,000 Active 100 DOM
-
2026-06-16days on market $349,000 Active 99 DOM
-
2026-06-15days on market $349,000 Active 98 DOM
-
2026-06-13days on market $349,000 Active 96 DOM
-
2026-06-13days on market $349,000 Active 95 DOM
-
2026-06-10days on market $349,000 Active 93 DOM
-
2026-06-09days on market $349,000 Active 92 DOM
-
2026-06-08days on market $349,000 Active 91 DOM
-
2026-06-07days on market $349,000 Active 90 DOM
-
2026-06-03days on market $349,000 Active 86 DOM
-
2026-06-02days on market $349,000 Active 85 DOM
-
2026-06-01days on market $349,000 Active 84 DOM
-
2026-05-31days on market $349,000 Active 83 DOM
-
2026-03-09$349,000 Active
ⓘ Source: listings_history table (triggers on properties + properties_extension) + one-shot
backfill from property_details.listing_events for pre-trigger history.
Tax reassessment forecast OK · Resets to sale price
- Current annual tax
- $943 · $79/mo
- Projected year-2 tax
- $3,141 · $262/mo
- Expected delta
- +$2,198/yr (+$183/mo · 233.1%)
ⓘ Screening estimate from a state-policy table — verify with the county assessor before closing.
Nearby sold comps map
Loading sold comps map…
Walkable amenities ~0.75 mi
Loading nearby amenities…
Taxation est. · year 1
- Rental income
- $28,180
- − Mortgage interest
- −$19,549
- − Property taxes
- −$943
- − Insurance
- −$1,745
- − Repairs & maintenance
- −$2,254
- − Management
- −$2,254
- − HOA
- −$504
- − Depreciation
- −$10,153
- Taxable loss
- −$9,223
- Est. tax savings @ 24.0%
- +$2,214
- After-tax cash flow
- $-679/yr
For passive investors: Depreciation is non-cash, so a rental often shows a tax loss while cash-flowing — sheltering income. Rental losses are passive: they offset passive income freely, and up to $25,000/yr can offset ordinary (W-2) income if you actively participate and your MAGI is under $100k (phasing out to $0 by $150k); unused losses carry forward. On sale, claimed depreciation is recaptured at up to 25%, and gains may owe capital-gains tax (a 1031 exchange can defer both). Figures are a year-1 estimate at your 24.0% rate — not tax advice; consult a CPA.
Schools (NCES district)
- District
- Bixby
- NCES district ID
- 4004500
- Math proficiency
- 39% ▼ -13.00%
- Reading proficiency
- 36% ▼ -14.00%
- Median HH income
- $75,727
- Composite
- 34.9/100
- National rank
- #5081
- State rank
- #15 of 270 in OK
Livability — Bixby
- Score
- 72/100
- State rank
- #24
- US rank
- #6029
Category grades
Schools grade is shown separately in the Schools card above.
Census & demographics
- Census place
- Bixby, OK
- County
- Tulsa County · 640,811 people
- City population
- 34,006
- Metro
- Tulsa, OK
- Population (ZIP)
- 34,006
- Household income
- $104,000
- Rent vs Own
- Severe rent burden
- 525.0
Population outlook (Tulsa County) Hauer SSP2
- Today (2025)
- 723,846 people
- By 2030
- 766,033 · +5.8%
- By 2040
- 851,386 · +17.6%
- By 2050
- 938,389 · +29.6%
- By 2075
- 1,166,011 · +61.1%
- By 2100
- 1,350,277 · +86.5%
Race, ethnicity, and origin ACS 2023
- Neighborhood character
- Predominantly White (73%)
- Race & ethnicity
- White 73% Two or more races 15% Hispanic / Latino 9% Native American 5% Asian 2% Black 2%
- Hispanic origin (detail)
- Mexican 5%
- Common ancestry
- Italian 4% Slovak 2% Lithuanian 2%
- Foreign-born
- 5% · Canada
- Languages at home
- 92% English-only · Spanish 5% Other Indo-European 1%
Political lean MEDSL · Tulsa
- 2024 margin
- R (+15.2) · D 41.3% · R 56.5% · Other 2.2%
- 2008→2024 swing
- +9.2pp toward D · 2008: -24.5pp · 2024: -15.2pp
- All cycles
- 2024: R+15.2 2020: R+15.6 2016: R+22.9 2012: R+27.4 2008: R+24.5
Not yet ingested
- Civics
- —
Market trends
- HPI YoY
- ▼ -127.20%
- Current HPI
- 195.2538
- Rent YoY
- ▲ 3.34%
- Metro
- Tulsa, OK
- State GDP YoY
- ▲ 1.55%
- F500 in state
- 6
Industry mix (Fortune 500 HQ in OK)
| Industry | F500 HQs | Revenue |
|---|---|---|
| Energy | 3 | $48B |
|
||
Price history
1 event — show timeline
- 2026-03-09 Listed $349,000 MLS Technology, Inc.
Cash-flow waterfall
monthlySold comps — $/sqft
last 12 mo · ≤1 miLoading sold comps…