 Multi-family
17 Tessa Ct · New York, NY
Flood risk 1/10 · Minimal
- FEMA flood zone
- X (unshaded)
- Chance of flooding over 30 yrs
- 0.0%
- Est. flood insurance / yr
- $507 – $1,088
Fire risk 1/10 · Minimal
- Est. fire insurance / yr
- $691 – $1,283
Heat risk 7/10 · Major
- Hot days now (above 98°F)
- 7 days/yr
- Hot days in 30 yrs
- 16 days/yr
Wind risk 6/10 · Moderate
- Chance of severe wind over 30 yrs
- 61.0%
Air-quality risk 4/10 · Minor
- Unhealthy air days now
- 5 days/yr
- Unhealthy air days in 30 yrs
- 7 days/yr
Risk factors via First Street. Map © Google.
Why this score? — see what drove the C- grade
The composite is a weighted blend of 9 inputs, each scored 0–100. Each bar is that input's sub-score; the figure is the points it added to the 100-point composite (weight × sub-score).
- Cash flow +17.2/30.0
- ARV discount +13.0/15.0
- DSCR +5.4/10.0
- Schools +5.0/10.0
- 1% rule +3.9/10.0
- Livability +3.8/5.0
- Rent growth +3.0/5.0
- Condition / age +2.5/5.0
- Appreciation +0.0/10.0
$695,000
🖨 Deal sheet 📄 Offer letter ✓ Due diligence
Multi-family units
County records classify this as Multi-Family (2-4 Unit). Listing-text estimate: 1 unit. estimate disagrees with records
Listing remarks
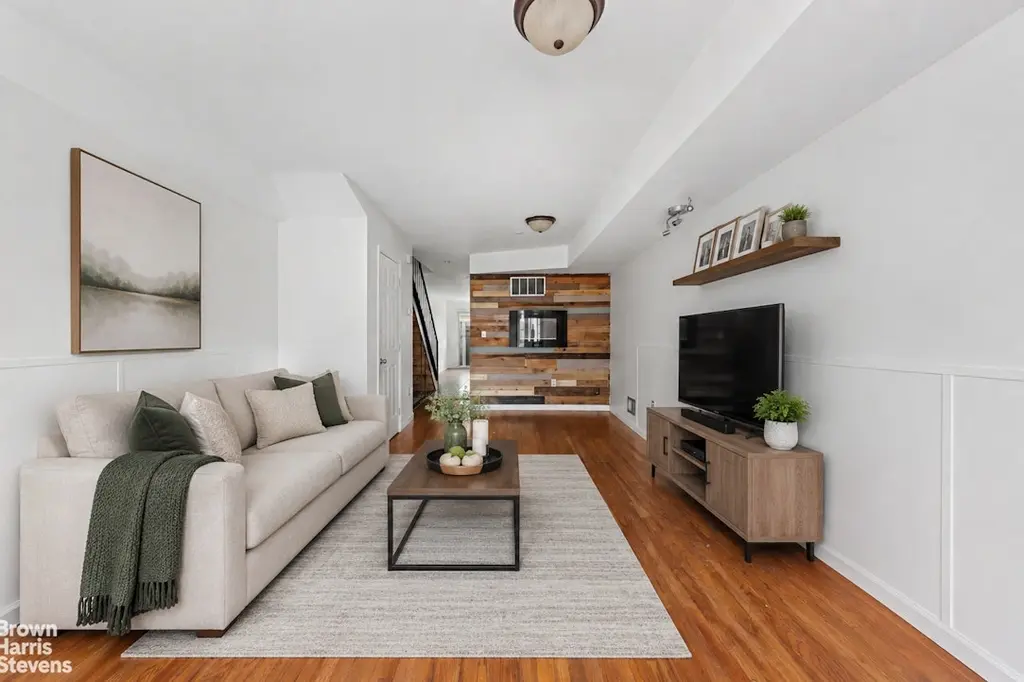
Welcome to 17 Tessa Ct - a beautifully designed 4-bedroom, 3.5-bath townhouse that blends modern comfort with sophisticated style in a private residential setting. This spacious home offers thoughtfully designed living across multiple levels, featuring sun-filled interiors, elegant architectural details, and seamless functionality for today's lifestyle. Step inside to discover bright open-concept living and dining spaces complemented by oversized windows, soaring ceilings, and contemporary finishes throughout. The modern kitchen flows effortlessly into the main entertaining areas, creating the perfect atmosphere for both everyday living and hosting guests. The generously sized bedrooms
Key facts
- 1,442 sq ft lot
- 2 garage spots
- Built 2004
Property features AI
Finance
- Financial info: Pets allowed in building
Exterior
- Parking: Assigned parking; 2-car garage
- Home design: 3 stories; Entry level: 1; Has a view; Green building
- Construction: Lot dimensions approximately 103.00 x 14.00; Lot area approximately 1,442 sqft
- Exterior features: Private outdoor space (over 60 sqft); Patio
Interior
- Kitchen: No kitchen appliance details provided
- Bedrooms: Total units: 2
- Bathrooms: 3 full bathrooms; 1 half bathroom
- Heating & cooling: Central air conditioning
- Interior features: High ceilings; Smoke-free
- Laundry & utility: In-unit laundry
Neighborhood map
What this means for you Summary
Snapshot
- This is a 4-bed/3.5-bath multifamily listed at $695k.
Deal economics
- At list price, monthly cash flow is $498 ($6k/yr) — positive.
- The deal already cash-flows at list — no discount required.
- To meet the 1% rule (rent ≥ 1% of price), the offer needs to be $616k (11.4% below list).
- Recommended offer: $616k (11.4% below list) — sets the bar for 1% rule.
- Cap rate 7.2% vs local median 2.6% in New York — top-decile yield for the area; either an underpriced asset or a hidden risk that comps aren't pricing in. Stress-test before assuming the spread holds.
Location & tenants
- Location reads 75/100 on livability (#268 in NY, #4,188 nationally) — a middle-class / working-renter tenant base. Strengths: amenities A+, commute A+, health & safety A; Watch: crime F, cost of living F.
- Market conditions: Rents rising (+2.0%/yr); 203 active listings in the ZIP; 3 comparable units currently listed for rent nearby; rentals leasing fast (median 8d on market — plan ~1-2 weeks tenant-placement turnaround); 480 units permitted in Richmond County in 2024 (22 in 5+ unit buildings).
- At $6,161/mo this rent would consume 103% of the median local household income ($72k/yr) (locally 2401% of renters already pay >50% of income on rent) — very limited rent-growth headroom before tenants either downsize or default.
Forward outlook
- Local home prices are declining (-3.0%/yr); year-one equity from $5k of loan paydown is wiped out by about $21k of value loss. Plan a longer hold.
- Richmond County population projected to shrink 5% by 2050 — rents likely to lag national; underwrite the cash flow, not the appreciation.
Negotiation context
- It's been on market 22 days — a 2% lower offer ($685k) is reasonable based on typical stale-listing flexibility.
Risks & watch-outs
- Climate carrying-cost: major wind risk, 61% chance of damaging wind over 30y; extreme-heat days projected 7→16/yr by 2055 (HVAC capex compounding) — expect insurance premiums to compound above CPI over the hold.
Questions for the listing agent
- Is there a deadline driving the sale (1031 exchange, divorce, estate, relocation)? That informs how much negotiation room exists.
- Schools are B-rated — typically a magnet for longer-tenancy family renters. What's the average tenant stay here, and is there a school-zone premium baked into asking?
- Crime grade is F in this area — have there been break-ins, vandalism, or insurance claims at this property in the last 3 years? What carrier currently insures it and at what premium?
- What's the average days-on-market for RENTAL listings here right now (not sales)? A rising rental-DOM trend means longer vacancies and softer asking-rent achievability than the comps imply.
- What's the recent tenant-quality profile in this submarket — average credit score on applications, eviction rate, late-payment / NSF rate, and stable-employment percentage? A property-management company in the area should have these aggregated.
- How much new apartment / multifamily construction is in the pipeline within 1–3 miles? Heavy new supply (>2% of stock underway) typically softens rents 12–24 months out; light construction supports rent growth.
Investment metrics
- 1% rule
- 0.89% ✗
- Cap rate
- 7.15%
- Cash-on-cash
- 3.07%
- DSCR
- 1.14
- GRM
- 9.4
CMA / ARV
- ARV (on-the-fly)
- $791,160
- Comps found
- 10
Show comp detail 10 sales within ~0.75 mi
| Address | Dist | Beds/Ba | Sqft | Sold | Price | $/sf | Match |
|---|---|---|---|---|---|---|---|
| 806 Van Duzer St | 0.11mi | 4/2.5 | 2,150 (-6%) | 4mo | $938,000 | $436 | 78 |
| 21 Maxie Ct | 0.03mi | 3/2.5 (-1) | 2,352 (+3%) | 12mo | $648,000 | $276 | 74 |
| 810 Van Duzer St | 0.12mi | 5/1.5 (+1) | 2,150 (-6%) | 4mo | $830,000 | $386 | 68 |
| 17 Maxie Ct | 0.04mi | 4/1.5 | 2,010 (-12%) | 5mo | $635,000 | $316 | 66 |
| 57 Broad St | 0.53mi | 4/5.0 | 2,480 (+9%) | 2mo | $430,000 | $173 | 53 |
| 58 Vanderbilt Ave | 0.63mi | 5/2.5 (+1) | 2,272 (-0%) | 10mo | $780,000 | $343 | 53 |
| 243 Tompkins Ave | 0.55mi | 3/3.5 (-1) | 2,006 (-12%) | 2mo | $660,000 | $329 | 48 |
| 241 Tompkins Ave | 0.55mi | 4/2.5 | 2,016 (-12%) | 6mo | $700,000 | $347 | 46 |
| 330 Van Duzer St | 0.71mi | 5/4.5 (+1) | 2,012 (-12%) | 1mo | $740,000 | $368 | 37 |
| 76 Highland Ave | 0.67mi | 3/1.0 (-1) | 1,976 (-13%) | 7mo | $810,000 | $410 | 26 |
Match score weights: distance 35% · size 25% · config 20% · recency 20%. Top-matched comps best support the ARV.
Projected returns pro-forma
-3.0% appreciation · 1.99% rent growth · sell at horizon
- IRR
- -12.5%
- Equity multiple
- 0.55×
- Total profit
- $-87,255
- Equity at exit
- $103,627
- IRR
- -5.0%
- Equity multiple
- 0.69×
- Total profit
- $-60,743
- Equity at exit
- $60,091
Cash invested: $194,600 (down + closing). Projections, not guarantees.
Landlord ↔ Tenant lean methodology
- Overall (CITY)
- 0 Strongly Tenant-Friendly
- State New York
- 15 Strongly Tenant-Friendly · D+10
- County
- — inherits STATE
- City New York
- 0 Strongly Tenant-Friendly · D+34
ZIP-level market 10304
- Rents YoY
- 2.0%
- Active inventory
- 203
- Price-to-rent
- 18.8×
Monthly cashflow live
- Estimated rent
- $6,161 high interval (Pro) →
- Mortgage (P&I)
- −$3,645
- Tax from tax record
- −$435 /mo · $5,216/yr
- Insurance
- −$290
- HOA
- −$0
- Vacancy / Maint / Mgmt
- −$1,294
- Net cashflow
- $498
Break-even live
2-unit breakdown (identical units grouped — click to expand)
| Units | Beds | Baths | Est. rent |
|---|---|---|---|
| 2× units | 2 | 1 | $6,162 |
| #1 | 2 | 1 | $3,081 |
| #2 | 2 | 1 | $3,081 |
| Total (2 units) | $6,161 | ||
UW: 25.0% down · 7.5% · 30yr · 1.5% tax · 5.0% vac · 8.0% maint · 8.0% mgmt
Financing live
Cash to close
- Down payment
- $173,750
- Closing costs
- $20,850
- Reserves months
- —
- Total cash needed
- —
Loan-product check · same deal, 3 products live
Conventional
25% down · 7.5% · 30yr
- Down + closing
- —
- Monthly P&I
- —
- Monthly cashflow
- —
- DSCR
- —
- Eligible?
- —
Personal DTI + credit; lowest rate.
DSCR
20% down · 8.5% · 30yr
- Down + closing
- —
- Monthly P&I
- —
- Monthly cashflow
- —
- DSCR
- —
- Eligible?
- —
No personal income docs; deal must DSCR.
Hard money
10% down · 12.0% · 12mo
- Down + closing
- —
- Monthly P&I
- —
- Monthly cashflow
- —
- DSCR
- —
- Eligible?
- —
Short-term bridge; refi at stabilization.
Rent comps 3 comps
| Address | Beds | Baths | Sqft | Rent | $/sqft | DOM | Units | Dist |
|---|---|---|---|---|---|---|---|---|
| 17 Cunard Ave Staten Island, NY | 3.0 | 2.0 | 1700 | $3,650 | $2.15 | 24d | 1 | 0.47mi |
| 37 Ely St Staten Island, NY | 4.0 | 2.0 | 2600 | $3,999 | $1.54 | 6d | 1 | 1.09mi |
| 64 Claradon Ln Staten Island, NY | 3.0 | 2.5 | 1976 | $3,500 | $1.77 | 8d | 1 | 1.45mi |
Listing history 9 events
-
2026-06-10days on market $695,000 Active 22 DOM
-
2026-06-08days on market $695,000 Active 21 DOM
-
2026-06-08days on market $695,000 Active 20 DOM
-
2026-06-04days on market $695,000 Active 17 DOM
-
2026-06-03days on market $695,000 Active 16 DOM
-
2026-06-02days on market $695,000 Active 15 DOM
-
2026-06-01days on market $695,000 Active 14 DOM
-
2026-05-31days on market $695,000 Active 13 DOM
-
2026-05-18$695,000 Active
ⓘ Source: listings_history table (triggers on properties + properties_extension) + one-shot
backfill from property_details.listing_events for pre-trigger history.
Tax reassessment forecast NY · Partial reset (capped growth)
- Current annual tax
- $5,216 · $435/mo
- Projected year-2 tax
- $8,481 · $707/mo
- Expected delta
- +$3,265/yr (+$272/mo · 62.6%)
ⓘ Screening estimate from a state-policy table — verify with the county assessor before closing.
Climate risk First Street
- Flood 1/10 Low FEMA zone X (unshaded) · 0% chance over 30 yrs
- Wildfire 1/10 Low
- Heat 7/10 Severe 7 d/yr ≥98°F today · 16 d/yr by 30 yrs out
- Wind 6/10 Major 61% chance of damaging wind over 30 yrs
- Air quality 4/10 Moderate 5 unhealthy d/yr today · 7 by 30 yrs out
Nearby sold comps map
Loading sold comps map…
Walkable amenities ~0.75 mi
Loading nearby amenities…
Taxation est. · year 1
- Rental income
- $73,932
- − Mortgage interest
- −$38,931
- − Property taxes
- −$5,216
- − Insurance
- −$3,475
- − Repairs & maintenance
- −$5,915
- − Management
- −$5,915
- − Depreciation
- −$20,218
- Taxable loss
- −$5,737
- Est. tax savings @ 24.0%
- +$1,377
- After-tax cash flow
- $7,357/yr
For passive investors: Depreciation is non-cash, so a rental often shows a tax loss while cash-flowing — sheltering income. Rental losses are passive: they offset passive income freely, and up to $25,000/yr can offset ordinary (W-2) income if you actively participate and your MAGI is under $100k (phasing out to $0 by $150k); unused losses carry forward. On sale, claimed depreciation is recaptured at up to 25%, and gains may owe capital-gains tax (a 1031 exchange can defer both). Figures are a year-1 estimate at your 24.0% rate — not tax advice; consult a CPA.
Schools (NCES district)
No district data.
Livability — New York
- Score
- 75/100
- State rank
- #268
- US rank
- #4188
Category grades
Schools grade is shown separately in the Schools card above.
Census & demographics
- Census place
- New York, NY
- County
- Richmond County · 404,174 people
- City population
- 7,731,280
- Metro
- New York-Newark-Jersey City, NY-NJ-PA
- Population (ZIP)
- 45,658
- Household income
- $71,561
- Rent vs Own
- Severe rent burden
- 2401.0
Population outlook (Richmond County) Hauer SSP2
- Today (2025)
- 482,784 people
- By 2030
- 481,831 · -0.2%
- By 2040
- 473,159 · -2.0%
- By 2050
- 457,242 · -5.3%
- By 2075
- 408,029 · -15.5%
- By 2100
- 341,459 · -29.3%
Race, ethnicity, and origin ACS 2023
- Neighborhood character
- Highly diverse neighborhood (Simpson 0.73)
- Race & ethnicity
- White 36% Black 25% Hispanic / Latino 24% Asian 13% Two or more races 8% Native American 1%
- Hispanic origin (detail)
- Mexican 4% Puerto Rican 10% Dominican 2%
- Common ancestry
- Scotch-Irish 3% Romanian 2% Swiss 2%
- Foreign-born
- 32% · Canada, China, Jamaica
- Languages at home
- 54% English-only · Spanish 16% Chinese 8% Other Indo-European 5%
Political lean MEDSL · Richmond
- 2024 margin
- Strong R (+29.8) · D 35.1% · R 64.9%
- 2008→2024 swing
- -25.7pp toward R · 2008: -4.0pp · 2024: -29.8pp
- All cycles
- 2024: R+29.8 2020: R+14.9 2016: R+16.8 2012: D+0.8 2008: R+4.0
Not yet ingested
- Civics
- —
Market trends
- HPI YoY
- ▼ -254.93%
- Current HPI
- 346.7976
- Rent YoY
- ▲ 1.99%
- Metro
- New York-Newark-Jersey City, NY-NJ-PA
- State GDP YoY
- ▲ 2.60%
- F500 in state
- 92
Industry mix (Fortune 500 HQ in NY)
| Industry | F500 HQs | Revenue |
|---|---|---|
| Financial Services | 10 | $950B |
|
||
| Consumer Goods | 9 | $162B |
|
||
| Insurance | 4 | $225B |
|
||
| Telecommunications | 2 | $144B |
|
||
| Pharmaceuticals | 2 | $112B |
|
||
| Media / Entertainment | 2 | $69B |
|
||
Price history
1 event — show timeline
- 2026-05-18 Listed $695,000 RLS at REBNY
Property tax history
+8.0%/yrLatest (2025): $5,216 · +6.0% YoY. Source: county tax records.
Cash-flow waterfall
monthlySold comps — $/sqft
last 12 mo · ≤1 miLoading sold comps…