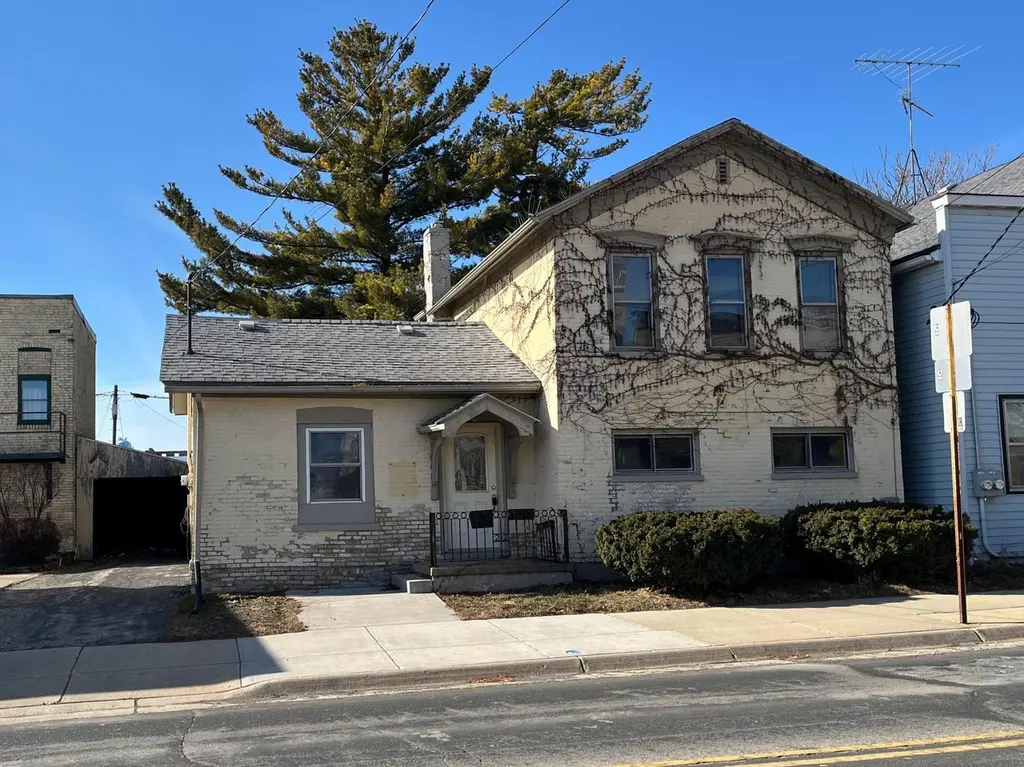
212 N 4th St · Watertown, WI
Flood risk No data
- FEMA flood zone
- —
- Chance of flooding over 30 yrs
- —
- Est. flood insurance / yr
- —
Fire risk No data
- Est. fire insurance / yr
- —
Heat risk No data
- Hot days now (above threshold)
- —
- Hot days in 30 yrs
- —
Wind risk No data
- Chance of severe wind over 30 yrs
- —
Air-quality risk No data
- Unhealthy air days now
- —
- Unhealthy air days in 30 yrs
- —
Risk factors via First Street. Map © Google.
Why this score? — see what drove the B grade
The composite is a weighted blend of 9 inputs, each scored 0–100. Each bar is that input's sub-score; the figure is the points it added to the 100-point composite (weight × sub-score).
- Cash flow +30.0/30.0
- ARV discount +15.0/15.0
- DSCR +10.0/10.0
- 1% rule +9.4/10.0
- Livability +3.6/5.0
- Schools +3.1/10.0
- Rent growth +2.5/5.0
- Condition / age +1.0/5.0
- Appreciation +0.0/10.0
$99,900
🖨 Deal sheet 📄 Offer letter ✓ Due diligence
Listing remarks MLS
This diamond in the ruff has been gutted and is waiting to be turned into a gem again. Bring your ideas to make it your own. This home previously was used as an office on the first floor and living area upstairs.
Key facts
- 3,049 sq ft lot
- Garage
- Built 1900
Neighborhood map
What this means for you Summary
Snapshot
- This is a 3-bed/1.0-bath single-family listed at $100k. Condition is rated poor.
Deal economics
- At list price, monthly cash flow is $447 ($5k/yr) — positive.
- The deal already cash-flows at list — no discount required.
- Meets the 1% rule at list price ($1k rent vs $100k).
- Recommended offer: $91k (9.0% below list) — sets the bar for market timing.
- Cap rate 11.7% vs local median 2.2% in Watertown — top-decile yield for the area; either an underpriced asset or a hidden risk that comps aren't pricing in. Stress-test before assuming the spread holds.
Location & tenants
- Location reads 72/100 on livability (#224 in WI) — a middle-class / working-renter tenant base. Strengths: cost of living A+, housing A+, health & safety A+; Watch: amenities C-, employment D+, commute F.
- Watertown Unified School District (town): math 36% / reading 34% proficiency, ranked #221 of 342 in WI (top 65%) — families likely to look elsewhere, expect single-tenant / working-renter base with shorter leases.
- Market conditions: 94 active listings in the ZIP; 5 comparable units currently listed for rent nearby; rentals at typical pace (median 17d on market — plan ~3-4 weeks tenant-placement turnaround); 145 units permitted in Jefferson County in 2024 (0 in 5+ unit buildings).
Forward outlook
- Local home prices are declining (-3.0%/yr); year-one equity from $691 of loan paydown is wiped out by about $3k of value loss. Plan a longer hold.
- Jefferson County population projected to shrink 6% by 2050 — rents likely to lag national; underwrite the cash flow, not the appreciation.
- At projected returns (-3.0% appreciation + 3.0% rent growth), your $28k cash investment doubles in ~7 years — after that, you're playing with house money.
Negotiation context
- It's been on market 91 days — a 9% lower offer ($91k) is reasonable based on typical stale-listing flexibility.
Risks & watch-outs
- Watch-outs: built in 1900 — expect roof / HVAC / electrical / plumbing capex.
Questions for the listing agent
- It's been on market 91 days. Have you received any prior offers? Is the seller open to a 9% concession, seller financing, or rate buy-down credit?
- Have any recent inspections been done? Can we get a copy of the seller's disclosures and any deferred-maintenance estimates?
- Built in 1900 — when were the roof, HVAC, electrical panel, plumbing, and water heater last replaced?
- Why hasn't it sold? Are there any deal-killer items the seller is aware of (foundation, flood, title, zoning, code violations)?
- Is there a deadline driving the sale (1031 exchange, divorce, estate, relocation)? That informs how much negotiation room exists.
- What's the average days-on-market for RENTAL listings here right now (not sales)? A rising rental-DOM trend means longer vacancies and softer asking-rent achievability than the comps imply.
- What's the recent tenant-quality profile in this submarket — average credit score on applications, eviction rate, late-payment / NSF rate, and stable-employment percentage? A property-management company in the area should have these aggregated.
- How much new for-sale + rental construction is in the pipeline within 1–3 miles? Heavy new supply typically softens prices + rents 12–24 months out; constrained supply supports both.
Investment metrics
- 1% rule
- 1.44% ✓
- Cap rate
- 11.66%
- Cash-on-cash
- 19.17%
- DSCR
- 1.85
- GRM
- 5.8
CMA / ARV
- ARV (median comp)
- $197,776
- List price
- $99,900
- Delta
- -49.49%
- Verdict
- UNDERPRICED
- Comps
- 20 within 1.0 mi
Show comp detail 12 sales within ~0.75 mi
| Address | Dist | Beds/Ba | Sqft | Sold | Price | $/sf | Match |
|---|---|---|---|---|---|---|---|
| 409 O'Connell St | 0.40mi | 3/1.5 | 1,092 (-1%) | 2mo | $235,000 | $215 | 77 |
| 411 E Division St | 0.17mi | 3/1.5 | 1,251 (+14%) | 0mo | $150,000 | $120 | 67 |
| 414 S Montgomery St | 0.58mi | 3/2.0 | 1,100 (0%) | 3mo | $205,000 | $186 | 67 |
| 915 Cleveland St | 0.38mi | 2/1.5 (-1) | 1,155 (+5%) | 4mo | $225,000 | $195 | 64 |
| 1009 Wisconsin St | 0.53mi | 3/1.0 | 1,186 (+8%) | 2mo | $245,000 | $207 | 61 |
| 517 W Cady St | 0.49mi | 3/1.5 | 1,197 (+9%) | 2mo | $220,000 | $184 | 59 |
| 401 S Montgomery St | 0.53mi | 3/1.0 | 1,004 (-9%) | 4mo | $175,000 | $174 | 57 |
| 114 N 10th St | 0.33mi | 3/2.0 | 1,248 (+14%) | 1mo | $275,000 | $220 | 57 |
| 211 Lynn St | 0.30mi | 2/1.5 (-1) | 1,247 (+13%) | 1mo | $275,800 | $221 | 56 |
| 612 Elm St | 0.68mi | 3/1.0 | 1,008 (-8%) | 1mo | $270,000 | $268 | 53 |
| 520 N Montgomery St | 0.58mi | 3/1.0 | 1,232 (+12%) | 2mo | $250,055 | $203 | 51 |
| 26 Park View Ln | 0.71mi | 3/1.5 | 1,200 (+9%) | 3mo | $300,000 | $250 | 47 |
Match score weights: distance 35% · size 25% · config 20% · recency 20%. Top-matched comps best support the ARV.
Projected returns pro-forma
-3.0% appreciation · 3.0% rent growth · sell at horizon
- IRR
- 11.1%
- Equity multiple
- 1.44×
- Total profit
- $12,295
- Equity at exit
- $14,895
- IRR
- 20.1%
- Equity multiple
- 2.70×
- Total profit
- $47,444
- Equity at exit
- $8,638
Cash invested: $27,972 (down + closing). Projections, not guarantees.
Landlord ↔ Tenant lean methodology
- Overall (STATE)
- 73 Landlord-Friendly
- State Wisconsin
- 73 Landlord-Friendly · R+2
- County
- — inherits STATE
- City
- — inherits STATE
ZIP-level market 53094
- Active inventory
- 94
- Price-to-rent
- 5.8×
Monthly cashflow live
- Estimated rent
- $1,440 high interval (Pro) →
- Mortgage (P&I)
- −$524
- Tax est. 1.5%
- −$125 /mo · $1,498/yr
- Insurance
- −$42
- HOA
- −$0
- Vacancy / Maint / Mgmt
- −$302
- Net cashflow
- $447
Break-even live
UW: 25.0% down · 7.5% · 30yr · 1.5% tax · 5.0% vac · 8.0% maint · 8.0% mgmt
Financing live
Cash to close
- Down payment
- $24,975
- Closing costs
- $2,997
- Reserves months
- —
- Total cash needed
- —
Loan-product check · same deal, 3 products live
Conventional
25% down · 7.5% · 30yr
- Down + closing
- —
- Monthly P&I
- —
- Monthly cashflow
- —
- DSCR
- —
- Eligible?
- —
Personal DTI + credit; lowest rate.
DSCR
20% down · 8.5% · 30yr
- Down + closing
- —
- Monthly P&I
- —
- Monthly cashflow
- —
- DSCR
- —
- Eligible?
- —
No personal income docs; deal must DSCR.
Hard money
10% down · 12.0% · 12mo
- Down + closing
- —
- Monthly P&I
- —
- Monthly cashflow
- —
- DSCR
- —
- Eligible?
- —
Short-term bridge; refi at stabilization.
Rent comps 5 comps
| Address | Beds | Baths | Sqft | Rent | $/sqft | DOM | Units | Dist |
|---|---|---|---|---|---|---|---|---|
| 210 N Church St Unit 210 1/2 Watertown, WI | 2.0 | 1.0 | 1400 | $1,450 | $1.04 | 16d | 1 | 0.40mi |
| 701 S 6th St Apt A Watertown, WI | 3.0 | 1.0 | 950 | $1,425 | $1.50 | 3d | 1 | 0.41mi |
| 1023 W Main St Unit C1 Watertown, WI | 2.0 | 1.0 | 820 | $1,375 | $1.68 | 23d | 1 | 1.40mi |
| 1023 W Main St Apt 3E Watertown, WI | 2.0 | 1.0 | 820 | $1,350 | $1.65 | 23d | 1 | 1.40mi |
| 1023 W Main St Unit D8 Watertown, WI | 2.0 | 1.0 | 820 | $1,400 | $1.71 | 11d | 1 | 1.40mi |
Listing history 14 events
-
2026-06-18days on market $99,900 Active 91 DOM
-
2026-06-17days on market $99,900 Active 90 DOM
-
2026-06-16days on market $99,900 Active 89 DOM
-
2026-06-15days on market $99,900 Active 88 DOM
-
2026-06-13days on market $99,900 Active 86 DOM
-
2026-06-09days on market $99,900 Active 82 DOM
-
2026-06-08days on market $99,900 Active 81 DOM
-
2026-06-07days on market $99,900 Active 80 DOM
-
2026-06-05days on market $99,900 Active 77 DOM
-
2026-06-03days on market $99,900 Active 76 DOM
-
2026-06-02days on market $99,900 Active 75 DOM
-
2026-06-01days on market $99,900 Active 74 DOM
-
2026-05-31days on market $99,900 Active 73 DOM
-
2026-02-19$99,900 Active 212-char remark
Show marketing remark (212 chars)
This diamond in the ruff has been gutted and is waiting to be turned into a gem again. Bring your ideas to make it your own. This home previously was used as an office on the first floor and living area upstairs.
ⓘ Source: listings_history table (triggers on properties + properties_extension) + one-shot
backfill from property_details.listing_events for pre-trigger history.
Nearby sold comps map
Loading sold comps map…
Walkable amenities ~0.75 mi
Loading nearby amenities…
Taxation est. · year 1
- Rental income
- $17,275
- − Mortgage interest
- −$5,596
- − Property taxes
- −$1,498
- − Insurance
- −$500
- − Repairs & maintenance
- −$1,382
- − Management
- −$1,382
- − Depreciation
- −$2,906
- Taxable income
- $4,011
- Est. tax owed @ 24.0%
- −$963
- After-tax cash flow
- $4,400/yr
For passive investors: Depreciation is non-cash, so a rental often shows a tax loss while cash-flowing — sheltering income. Rental losses are passive: they offset passive income freely, and up to $25,000/yr can offset ordinary (W-2) income if you actively participate and your MAGI is under $100k (phasing out to $0 by $150k); unused losses carry forward. On sale, claimed depreciation is recaptured at up to 25%, and gains may owe capital-gains tax (a 1031 exchange can defer both). Figures are a year-1 estimate at your 24.0% rate — not tax advice; consult a CPA.
Condition & rehab AI · 1 photo
This property requires extensive exterior and interior renovations to bring it up to current standards and increase its value.
Repairs flagged
- Major exterior siding — Vines covering the exterior walls
- Major exterior paint — Vines covering the exterior walls
- Major exterior roof — No visible damage
Value-add opportunities
- Both exterior siding and paint — Enhances curb appeal and value
- Both interior paint — Improves interior appearance and value
- Both kitchen and bathrooms — Modernizes and increases value
Renovation cost estimate screening
| Repair item | Severity | Est. cost |
|---|---|---|
| exterior siding · Vines covering the exterior walls | Major | $15,000–50,000 |
| exterior paint · Vines covering the exterior walls | Major | $15,000–50,000 |
| exterior roof · No visible damage | Major | $15,000–50,000 |
| Total estimated repair cost · 3 items | $45,000–150,000 |
Value-add ROI direction
- Both exterior siding and paint — Enhances curb appeal and value ↑
- Both interior paint — Improves interior appearance and value ↑
- Both kitchen and bathrooms — Modernizes and increases value ↑
ⓘ Cost ranges are severity-bucket heuristics (US national rule-of-thumb). Get contractor quotes + a written scope before underwriting a rehab budget.
Schools (NCES district)
- District
- Watertown Unified School District
- NCES district ID
- 5515750
- Math proficiency
- 36% ▼ -4.00%
- Reading proficiency
- 34% ▼ -2.00%
- Median HH income
- $51,521
- Composite
- 30.51/100
- National rank
- #6216
- State rank
- #221 of 342 in WI
Livability — Watertown
- Score
- 72/100
- State rank
- #224
- US rank
- #5940
Category grades
Schools grade is shown separately in the Schools card above.
Census & demographics
- Census place
- Watertown, WI
- County
- Jefferson County · 17,998 people
- City population
- 29,351
- Metro
- Watertown-Fort Atkinson, WI
- Population (ZIP)
- 17,998
- Household income
- $73,443
- Rent vs Own
- Severe rent burden
- 394.0
Population outlook (Jefferson County) Hauer SSP2
- Today (2025)
- 86,617 people
- By 2030
- 86,818 · +0.2%
- By 2040
- 85,552 · -1.2%
- By 2050
- 81,765 · -5.6%
- By 2075
- 68,937 · -20.4%
- By 2100
- 55,854 · -35.5%
Race, ethnicity, and origin ACS 2023
- Neighborhood character
- Predominantly White (87%)
- Race & ethnicity
- White 87% Hispanic / Latino 9% Two or more races 7%
- Hispanic origin (detail)
- Mexican 6%
- Common ancestry
- Romanian 8% Portuguese 5% Lithuanian 3%
- Foreign-born
- 2% · Canada
- Languages at home
- 95% English-only · Spanish 3% German/W. Germanic 1% Other Indo-European 1%
Political lean MEDSL · Jefferson
- 2024 margin
- R (+16.4) · D 41.1% · R 57.5% · Other 1.4%
- 2008→2024 swing
- -17.2pp toward R · 2008: 0.8pp · 2024: -16.4pp
- All cycles
- 2024: R+16.4 2020: R+15.2 2016: R+16.2 2012: R+7.6 2008: D+0.8
Not yet ingested
- Civics
- —
Market trends
- HPI YoY
- ▼ -139.27%
- Current HPI
- 203.7595
- Rent YoY
- —
- Metro
- Watertown-Fort Atkinson, WI
- State GDP YoY
- ▲ 2.10%
- F500 in state
- 20
Industry mix (Fortune 500 HQ in WI)
| Industry | F500 HQs | Revenue |
|---|---|---|
| Industrial Machinery | 4 | $23B |
|
||
| Industrial Technology | 2 | $36B |
|
||
| Insurance | 1 | $36B |
|
||
| Professional Services | 1 | $19B |
|
||
| Utilities | 1 | $9B |
|
||
| Consumer Goods | 1 | $3B |
|
||
Price history
1 event — show timeline
- 2026-02-19 Listed $99,900 METROMLS
Cash-flow waterfall
monthlySold comps — $/sqft
last 12 mo · ≤1 miLoading sold comps…