 10-Plex
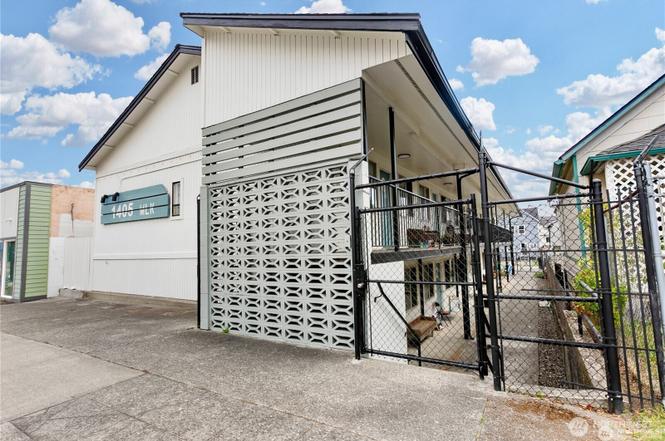
1405 Martin Luther King Jr Way · Tacoma, WA
Flood risk 1/10 · Minimal
- FEMA flood zone
- X (unshaded)
- Chance of flooding over 30 yrs
- 0.0%
- Est. flood insurance / yr
- $507 – $1,088
Fire risk 1/10 · Minimal
- Est. fire insurance / yr
- $604 – $1,122
Heat risk 3/10 · Minor
- Hot days now (above 87°F)
- 7 days/yr
- Hot days in 30 yrs
- 15 days/yr
Wind risk 1/10 · Minimal
- Chance of severe wind over 30 yrs
- —
Air-quality risk 7/10 · Major
- Unhealthy air days now
- 11 days/yr
- Unhealthy air days in 30 yrs
- 12 days/yr
Risk factors via First Street. Map © Google.
Why this score? — see what drove the B grade
The composite is a weighted blend of 9 inputs, each scored 0–100. Each bar is that input's sub-score; the figure is the points it added to the 100-point composite (weight × sub-score).
- Cash flow +30.0/30.0
- 1% rule +10.0/10.0
- DSCR +10.0/10.0
- ARV discount +7.5/15.0
- Schools +4.2/10.0
- Livability +3.9/5.0
- Rent growth +3.5/5.0
- Condition / age +2.5/5.0
- Appreciation +0.0/10.0
$1,350,000
🖨 Deal sheet 📄 Offer letter ✓ Due diligence
Multi-family units
County records classify this as Multi-Family (5+ Unit). Listing-text estimate: 10 units. confirmed
5+ unit building — per-unit beds/baths from public records are typically unavailable; the breakdown below (if shown) is an estimate from the listing text.
Listing remarks
Are you looking for your next multi family investment? Maybe 1031 exchange? Look no further! This 10 unit apartment complex in Hilltop is an incredible opportunity and perfect for your portfolio! Very conforming 2 story complex with 5 units down, 5 units up, a laundry room, and storage room! Each unit is a 1 bed 1 bath and all separately metered! Various updates have been done throughout the interiors and exterior of the property! This is a prime location conveniently located on the Tacoma Link Light Rail, nearby UW Tacoma, Stadium District, Hospitals, restaurants, shops, entertainment, and more! Fully gated property for security and a dog run out back! This has everything you need for your
Key facts
- Storage room
- Laundry room
- Fully gated property
Tags
Property features AI
Finance
- Other: Calculated building area: 5,680 square feet; Site listed as GPS friendly
- Financial info: Gross scheduled income: $142,560; Gross adjusted income: $142,560; Total monthly income: $11,880; Net operating income: $98,482; Total expenses: $44,078; Electric expense: $10,000; Insurance expense: $7,860; Other expenses: $7,209; Gross rent multiplier: 10.52; Listing terms include Cash, Conventional, FHA, and VA financing
- HOA & community: On-site storage available
Exterior
- Parking: Open/uncovered parking with 6 spaces
- Security: Partially fenced and gated entry for added security; Security gate
- Utilities: Electric energy source; Public water (TPU); Sewer connected (TPU); Power provided by TPU
- Home design: Residential income property (multi-family); Building has 2 stories; 10-unit building
- Construction: Wood construction; Composition roof; Poured concrete foundation; Effective year built: 1993
- Exterior features: Partially fenced lot with gated entry; Wood exterior products; Alley access, curbs, paved surfaces and sidewalks
Interior
- Kitchen: Each unit includes a range/oven; Most units include a refrigerator; No units list a dishwasher
- Bedrooms: Ten 1-bedroom units
- Flooring: Vinyl and vinyl plank
- Bathrooms: Each unit has 1 bathroom
- Heating & cooling: Baseboard heating; No central cooling
- Interior features: Vinyl and vinyl plank flooring
- Laundry & utility: Coin-operated laundry available; Individual units do not include washer/dryer
Neighborhood map
What this means for you Summary
Snapshot
- This is a 10 × 10-bed/10.0-bath units multifamily listed at $1.35M.
Deal economics
- At list price, monthly cash flow is $9k ($109k/yr) — positive. Per door: $908/mo.
- The deal already cash-flows at list — no discount required.
- Meets the 1% rule at list price ($22k rent vs $1.35M).
- Recommended offer: $1.19M (12.0% below list) — sets the bar for market timing.
- Cap rate 14.4% vs local median 2.9% in Tacoma — top-decile yield for the area; either an underpriced asset or a hidden risk that comps aren't pricing in. Stress-test before assuming the spread holds.
Location & tenants
- Location reads 78/100 on livability (#127 in WA, #2,535 nationally) — a middle-class / working-renter tenant base. Strengths: amenities A+, commute A+, housing A+; Watch: cost of living D, crime F.
- Tacoma School District (urban): math 40% / reading 53% proficiency, ranked #169 of 291 in WA (top 58%) — families likely to look elsewhere, expect single-tenant / working-renter base with shorter leases.
- Market conditions: Rents rising (+3.9%/yr); 122 active listings in the ZIP; solid renter incomes; 3,209 units permitted in Pierce County in 2024 (1,269 in 5+ unit buildings).
- At $22,408/mo this rent would consume 354% of the median local household income ($76k/yr) (locally 1313% of renters already pay >50% of income on rent) — very limited rent-growth headroom before tenants either downsize or default.
Forward outlook
- Local home prices are declining (-3.0%/yr); year-one equity from $9k of loan paydown is wiped out by about $40k of value loss. Plan a longer hold.
- Pierce County population projected at +26% by 2050 — long-run rental-demand tailwind backs the buy-and-hold thesis.
- At projected returns (-3.0% appreciation + 3.9% rent growth), your $378k cash investment doubles in ~5 years — after that, you're playing with house money.
Negotiation context
- It's been on market 160 days — a 12% lower offer ($1.19M) is reasonable based on typical stale-listing flexibility.
- 2 sale attempts since 3y ago; this cycle's ask has dropped $100k (7%) from the opening price — seller is motivated, your offer sets the floor, not the list.
Questions for the listing agent
- It's been on market 160 days. Have you received any prior offers? Is the seller open to a 12% concession, seller financing, or rate buy-down credit?
- Can we see the unit-by-unit rent roll, current vacancy, and any below-market leases? What's the average tenancy length?
- What capital expenditures (roof, boiler, parking lot, exteriors) have been made in the last 5 years, and what's planned in the next 2?
- Built in 1968 — when were the roof, HVAC, electrical panel, plumbing, and water heater last replaced?
- Why hasn't it sold? Are there any deal-killer items the seller is aware of (foundation, flood, title, zoning, code violations)?
- Is there a deadline driving the sale (1031 exchange, divorce, estate, relocation)? That informs how much negotiation room exists.
- Schools are B-rated — typically a magnet for longer-tenancy family renters. What's the average tenant stay here, and is there a school-zone premium baked into asking?
- Crime grade is F in this area — have there been break-ins, vandalism, or insurance claims at this property in the last 3 years? What carrier currently insures it and at what premium?
- What's the average days-on-market for RENTAL listings here right now (not sales)? A rising rental-DOM trend means longer vacancies and softer asking-rent achievability than the comps imply.
- What's the recent tenant-quality profile in this submarket — average credit score on applications, eviction rate, late-payment / NSF rate, and stable-employment percentage? A property-management company in the area should have these aggregated.
- How much new apartment / multifamily construction is in the pipeline within 1–3 miles? Heavy new supply (>2% of stock underway) typically softens rents 12–24 months out; light construction supports rent growth.
Investment metrics
- 1% rule
- 1.66% ✓
- Cap rate
- 14.36%
- Cash-on-cash
- 28.82%
- DSCR
- 2.28
- GRM
- 5.0
CMA / ARV
No comps found within radius.
Projected returns pro-forma
-3.0% appreciation · 3.9% rent growth · sell at horizon
- IRR
- 24.1%
- Equity multiple
- 2.00×
- Total profit
- $379,731
- Equity at exit
- $201,289
- IRR
- 32.5%
- Equity multiple
- 4.07×
- Total profit
- $1,160,251
- Equity at exit
- $116,723
Cash invested: $378,000 (down + closing). Projections, not guarantees.
Landlord ↔ Tenant lean methodology
- Overall (STATE)
- 28 Tenant-Leaning
- State Washington
- 28 Tenant-Leaning · D+8
- County
- — inherits STATE
- City
- — inherits STATE
ZIP-level market 98405
- Rents YoY
- 3.9%
- Active inventory
- 122
- Price-to-rent
- 50.2×
Monthly cashflow live
- Estimated rent
- $22,408 medium interval (Pro) →
- Mortgage (P&I)
- −$7,080
- Tax from tax record
- −$983 /mo · $11,801/yr
- Insurance
- −$562
- HOA
- −$0
- Vacancy / Maint / Mgmt
- −$4,706
- Net cashflow
- $9,077
Break-even live
10-unit breakdown (identical units grouped — click to expand)
| Units | Beds | Baths | Est. rent |
|---|---|---|---|
| 10× units | 10 | 10 | $22,410 |
| #1 | 10 | 10 | $2,241 |
| #2 | 10 | 10 | $2,241 |
| #3 | 10 | 10 | $2,241 |
| #4 | 10 | 10 | $2,241 |
| #5 | 10 | 10 | $2,241 |
| #6 | 10 | 10 | $2,241 |
| #7 | 10 | 10 | $2,241 |
| #8 | 10 | 10 | $2,241 |
| #9 | 10 | 10 | $2,241 |
| #10 | 10 | 10 | $2,241 |
| Total (10 units) | $22,408 | ||
UW: 25.0% down · 7.5% · 30yr · 1.5% tax · 5.0% vac · 8.0% maint · 8.0% mgmt
Financing live
Cash to close
- Down payment
- $337,500
- Closing costs
- $40,500
- Reserves months
- —
- Total cash needed
- —
Loan-product check · same deal, 3 products live
Conventional
25% down · 7.5% · 30yr
- Down + closing
- —
- Monthly P&I
- —
- Monthly cashflow
- —
- DSCR
- —
- Eligible?
- —
Personal DTI + credit; lowest rate.
DSCR
20% down · 8.5% · 30yr
- Down + closing
- —
- Monthly P&I
- —
- Monthly cashflow
- —
- DSCR
- —
- Eligible?
- —
No personal income docs; deal must DSCR.
Hard money
10% down · 12.0% · 12mo
- Down + closing
- —
- Monthly P&I
- —
- Monthly cashflow
- —
- DSCR
- —
- Eligible?
- —
Short-term bridge; refi at stabilization.
Listing history 27 events
-
2026-06-18days on market $1,350,000 Active 160 DOM
-
2026-06-17days on market $1,350,000 Active 159 DOM
-
2026-06-16days on market $1,350,000 Active 158 DOM
-
2026-06-15days on market $1,350,000 Active 157 DOM
-
2026-06-13days on market $1,350,000 Active 155 DOM
-
2026-06-13days on market $1,350,000 Active 154 DOM
-
2026-06-09days on market $1,350,000 Active 151 DOM
-
2026-06-08days on market $1,350,000 Active 150 DOM
-
2026-06-07days on market $1,350,000 Active 149 DOM
-
2026-06-04days on market $1,350,000 Active 146 DOM
-
2026-06-03days on market $1,350,000 Active 145 DOM
-
2026-06-02days on market $1,350,000 Active 144 DOM
-
2026-06-01days on market $1,350,000 Active 143 DOM
-
2026-05-31days on market $1,350,000 Active 142 DOM
-
2026-05-13price $1,350,000
-
2026-02-11price $1,400,000
-
2026-01-09$1,450,000 Active
-
2023-05-22soldstatus $1,300,000 Closed
-
2023-01-27status Pending
-
2023-01-20$1,300,000 Active
-
2002-06-13soldstatus $195,000
-
1996-02-15soldstatus $197,521
-
1987-06-16soldstatus $150,000
-
1986-12-30soldstatus $77,250
-
1982-08-17soldstatus $150,000
-
1981-09-02soldstatus $111,694
-
1979-06-08soldstatus $108,100
ⓘ Source: listings_history table (triggers on properties + properties_extension) + one-shot
backfill from property_details.listing_events for pre-trigger history.
Tax reassessment forecast WA · Resets to sale price
- Current annual tax
- $11,801 · $983/mo
- Projected year-2 tax
- $13,230 · $1,102/mo
- Expected delta
- +$1,429/yr (+$119/mo · 12.1%)
ⓘ Screening estimate from a state-policy table — verify with the county assessor before closing.
Climate risk First Street
- Flood 1/10 Low FEMA zone X (unshaded) · 0% chance over 30 yrs
- Wildfire 1/10 Low
- Heat 3/10 Moderate 7 d/yr ≥87°F today · 15 d/yr by 30 yrs out
- Wind 1/10 Low
- Air quality 7/10 Severe 11 unhealthy d/yr today · 12 by 30 yrs out
Nearby sold comps map
Loading sold comps map…
Walkable amenities ~0.75 mi
Loading nearby amenities…
Taxation est. · year 1
- Rental income
- $268,896
- − Mortgage interest
- −$75,621
- − Property taxes
- −$11,801
- − Insurance
- −$6,750
- − Repairs & maintenance
- −$21,512
- − Management
- −$21,512
- − Depreciation
- −$39,273
- Taxable income
- $92,428
- Est. tax owed @ 24.0%
- −$22,183
- After-tax cash flow
- $86,740/yr
For passive investors: Depreciation is non-cash, so a rental often shows a tax loss while cash-flowing — sheltering income. Rental losses are passive: they offset passive income freely, and up to $25,000/yr can offset ordinary (W-2) income if you actively participate and your MAGI is under $100k (phasing out to $0 by $150k); unused losses carry forward. On sale, claimed depreciation is recaptured at up to 25%, and gains may owe capital-gains tax (a 1031 exchange can defer both). Figures are a year-1 estimate at your 24.0% rate — not tax advice; consult a CPA.
Schools (NCES district)
- District
- Tacoma School District
- NCES district ID
- 5308700
- Math proficiency
- 40% ▬ 0.00%
- Reading proficiency
- 53% ▲ 1.00%
- Median HH income
- $52,467
- Composite
- 42.25/100
- National rank
- #6987
- State rank
- #169 of 291 in WA
Livability — Tacoma
- Score
- 78/100
- State rank
- #127
- US rank
- #2535
Category grades
Schools grade is shown separately in the Schools card above.
Census & demographics
- Census place
- Tacoma, WA
- County
- Pierce County · 788,257 people
- City population
- 212,935
- Metro
- Seattle-Tacoma-Bellevue, WA
- Population (ZIP)
- 25,939
- Household income
- $75,946
- Rent vs Own
- Severe rent burden
- 1313.0
Population outlook (Pierce County) Hauer SSP2
- Today (2025)
- 956,648 people
- By 2030
- 1,010,862 · +5.7%
- By 2040
- 1,113,170 · +16.4%
- By 2050
- 1,206,524 · +26.1%
- By 2075
- 1,436,425 · +50.2%
- By 2100
- 1,563,654 · +63.5%
Race, ethnicity, and origin ACS 2023
- Neighborhood character
- Diverse neighborhood (Simpson 0.63)
- Race & ethnicity
- White 58% Two or more races 16% Black 13% Hispanic / Latino 11% Asian 5%
- Hispanic origin (detail)
- Mexican 9% Puerto Rican 1%
- Common ancestry
- Portuguese 4% Scottish 3% Slovak 3%
- Foreign-born
- 8% · Canada, Vietnam
- Languages at home
- 88% English-only · Spanish 6% Vietnamese 2% Russian/Polish/Slavic 1%
Political lean MEDSL · Pierce
- 2024 margin
- D (+10.8) · D 53.9% · R 43.1% · Other 3.0%
- 2008→2024 swing
- -1.4pp toward R · 2008: 12.2pp · 2024: 10.8pp
- All cycles
- 2024: D+10.8 2020: D+11.2 2016: D+7.5 2012: D+11.0 2008: D+12.2
Not yet ingested
- Civics
- —
Market trends
- HPI YoY
- ▼ -570.22%
- Current HPI
- 378.3973
- Rent YoY
- ▲ 3.90%
- Metro
- Seattle-Tacoma-Bellevue, WA
- State GDP YoY
- ▲ 4.65%
- F500 in state
- 22
Industry mix (Fortune 500 HQ in WA)
| Industry | F500 HQs | Revenue |
|---|---|---|
| Retail | 2 | $269B |
|
||
| Technology / Retail | 1 | $638B |
|
||
| Technology | 1 | $245B |
|
||
| Telecommunications | 1 | $38B |
|
||
| Food / Beverage | 1 | $36B |
|
||
| Automotive / Trucks | 1 | $34B |
|
||
Price history
+1148.8% since first listed13 events — show timeline
- 2026-05-13 Price Changed $1,350,000 NWMLS as Distributed by MLS Grid
- 2026-02-11 Price Changed $1,400,000 NWMLS as Distributed by MLS Grid
- 2026-01-09 Listed $1,450,000 NWMLS as Distributed by MLS Grid
- 2023-05-22 Sold (MLS) $1,300,000 NWMLS as Distributed by MLS Grid
- 2023-01-27 Pending — NWMLS as Distributed by MLS Grid
- 2023-01-20 Listed $1,300,000 NWMLS as Distributed by MLS Grid
- 2002-06-13 Sold (Public Records) $195,000 Public Records
- 1996-02-15 Sold (Public Records) $197,521 Public Records
- 1987-06-16 Sold (Public Records) $150,000 Public Records
- 1986-12-30 Sold (Public Records) $77,250 Public Records
- 1982-08-17 Sold (Public Records) $150,000 Public Records
- 1981-09-02 Sold (Public Records) $111,694 Public Records
- 1979-06-08 Sold (Public Records) $108,100 Public Records
Property tax history
+5.0%/yrLatest (2026): $11,801 · -13.7% YoY. Source: county tax records.
Cash-flow waterfall
monthlySold comps — $/sqft
last 12 mo · ≤1 miLoading sold comps…