7660 Mansfield Hollow Rd · Delray Beach, FL
Flood risk 1/10 · Minimal
- FEMA flood zone
- X (unshaded)
- Chance of flooding over 30 yrs
- 0.0%
- Est. flood insurance / yr
- $507 – $1,088
Fire risk 4/10 · Minor
- Est. fire insurance / yr
- $947 – $1,759
Heat risk 10/10 · Severe
- Hot days now (above 107°F)
- 7 days/yr
- Hot days in 30 yrs
- 27 days/yr
Wind risk 10/10 · Severe
- Chance of severe wind over 30 yrs
- 99.0%
Air-quality risk 2/10 · Minimal
- Unhealthy air days now
- 0 days/yr
- Unhealthy air days in 30 yrs
- 2 days/yr
Risk factors via First Street. Map © Google.
Why this score? — see what drove the D+ grade
The composite is a weighted blend of 9 inputs, each scored 0–100. Each bar is that input's sub-score; the figure is the points it added to the 100-point composite (weight × sub-score).
- ARV discount +15.0/15.0
- Cash flow +8.1/30.0
- Appreciation +5.3/10.0
- Schools +4.3/10.0
- Livability +3.9/5.0
- 1% rule +3.4/10.0
- Rent growth +2.6/5.0
- Condition / age +2.5/5.0
- DSCR +2.2/10.0
$450,000
🖨 Deal sheet (PDF) 📄 Offer letter ✓ Due diligence
Listing remarks
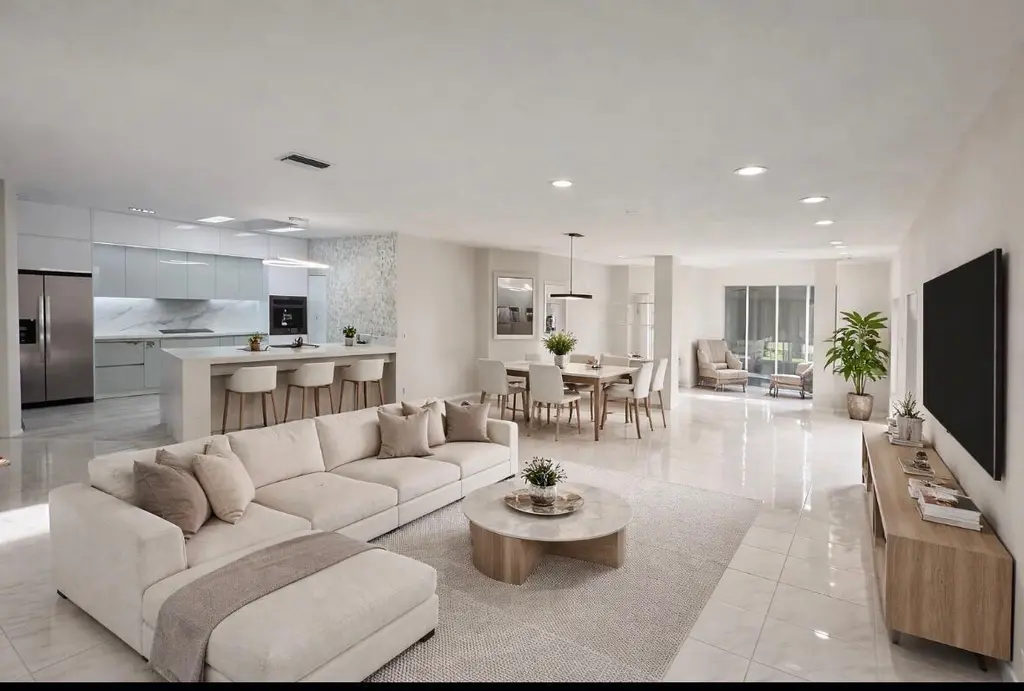
Charming updated 3BR/2BA residence with 1-car garage in Pine Ridge, Delray Beach. Interior features include fully renovated kitchen and bathrooms, white cabinetry, stunning oversized kitchen island, and skylight providing natural light. Fresh interior paint. New appliances, including range, refrigerator, dishwasher, washer and dryer. New Air Condition. Spacious floor plan with ample natural light. Convenient location close to shopping, dining and major roadways.
Key facts
- Renovated bathrooms
- Natural light
- Renovated kitchen
Tags
Property features AI
Finance
- Other: Pets allowed with restrictions (cats and dogs OK; breed, number and size limits may apply)
- HOA & community: Part of Pine Ridge at Delray Beach association; Quarterly HOA fee; HOA includes cable TV, grounds maintenance, security, common areas, and recreation facilities; Community amenities include clubhouse, pool, spa/hot tub, tennis courts, pickleball courts, shuffleboard, jogging path, and sidewalks; Senior community
Exterior
- Parking: Attached garage (1 car) with additional covered space; Driveway with one open parking space; Total parking for 2 vehicles
- Security: Community security (included in association amenities)
- Utilities: Public water; Public sewer; Electricity available; Cable available
- Home design: Single-family residence; One story; First-floor entry; Faces south; Private road frontage
- Construction: Block/CBS construction; Composition shingle roof; Built with a foundation suitable for one-story construction; Resale condition
- Exterior features: Open patio; Screened porch; Patio; Porch; Terrace; Glass-enclosed area; Paved road access; Not waterfront
Interior
- Kitchen: Dishwasher; Electric range; Microwave; Refrigerator; Kitchen island
- Bedrooms: One main-level bedroom
- Flooring: Ceramic tile; Tile; Vinyl
- Bathrooms: Two full bathrooms; One main-level bathroom
- Heating & cooling: Electric heating; Central air conditioning; Ceiling fans
- Interior features: Built-in features; Cathedral ceilings; Entrance foyer; High ceilings; Kitchen island; Walk-in closets; Split bedroom layout; Closet cabinetry; Custom mirrors; Skylight(s)
- Laundry & utility: In-unit laundry room; Electric water heater (owned)
Neighborhood map
What this means for you Summary
Snapshot
- This is a 2-bed/2.0-bath single-family listed at $450k.
Deal economics
- At list price, monthly cash flow is $-431 ($-5k/yr) — negative.
- To cash-flow at today's rent, offer at most $374k (16.9% below list).
- To meet the 1% rule (rent ≥ 1% of price), the offer needs to be $378k (16.0% below list).
- Recommended offer: $374k (16.9% below list) — sets the bar for cash-flow.
Location & tenants
- Location reads 77/100 on livability (#202 in FL, #3,160 nationally) — a middle-class / working-renter tenant base. Strengths: housing A+, health & safety A+, commute A-; Watch: cost of living C-, crime D-, amenities F.
- Palm Beach (suburban): math 46% / reading 53% proficiency, ranked #34 of 73 in FL (top 47%) — families likely to look elsewhere, expect single-tenant / working-renter base with shorter leases.
- Zoned schools: Hagen Road Elementary School (math 55% / reading 63%, grade B-, #722 of 2,144 statewide, top 34%, 773 students, 46% FRL); Carver Middle School (math 22% / reading 34%, grade F, #486 of 571 statewide, top 86%, 732 students, 73% FRL); Spanish River Community High School (math 64% / reading 74%, grade B, #63 of 667 statewide, top 10%, 2,578 students, 25% FRL) — zoned schools at 48% FRL track the district average.
- Market conditions: Rents flat; 584 active listings in the ZIP; 15 comparable units currently listed for rent nearby; rentals at typical pace (median 20d on market — plan ~3-4 weeks tenant-placement turnaround); solid renter incomes; 3,974 units permitted in Palm Beach County in 2024 (1,012 in 5+ unit buildings).
- At $3,779/mo this rent would consume 57% of the median local household income ($80k/yr) (locally 494% of renters already pay >50% of income on rent) — very limited rent-growth headroom before tenants either downsize or default.
Forward outlook
- In year one you build about $6k of equity ($3k loan paydown + $3k appreciation (0.7% local appreciation)).
- Palm Beach County population projected at +30% by 2050 — long-run rental-demand tailwind backs the buy-and-hold thesis.
- By year 6, paydown + projected appreciation supports a ~$37k cash-out refi (75% LTV) — recoverable capital for the next deal without selling this one.
Negotiation context
- It's been on market 93 days — a 9% lower offer ($410k) is reasonable based on typical stale-listing flexibility.
- 2 sale attempts since 2y ago with the ask held roughly flat each time — persistent listings suggest the price (not the market) is what's stuck; bring a comps-based counter.
- Current owner paid $325k; 38% above their basis — modest negotiation headroom, anchor on the comps not their cost.
Risks & watch-outs
- Climate carrying-cost: severe wind risk, 99% chance of damaging wind over 30y; extreme-heat days projected 7→27/yr by 2055 (HVAC capex compounding) — expect insurance premiums to compound above CPI over the hold.
Questions for the listing agent
- What do current leases actually rent for vs. the listed asking? Can we see a recent rent roll and the last 12 months of T-12 income?
- It's been on market 93 days. Have you received any prior offers? Is the seller open to a 17% concession, seller financing, or rate buy-down credit?
- What does the HOA fee cover, when was the last increase, and are there any pending special assessments or reserve-fund shortfalls?
- Why hasn't it sold? Are there any deal-killer items the seller is aware of (foundation, flood, title, zoning, code violations)?
- Is there a deadline driving the sale (1031 exchange, divorce, estate, relocation)? That informs how much negotiation room exists.
- Schools are B-rated — typically a magnet for longer-tenancy family renters. What's the average tenant stay here, and is there a school-zone premium baked into asking?
- Crime grade is D in this area — have there been break-ins, vandalism, or insurance claims at this property in the last 3 years? What carrier currently insures it and at what premium?
- The area grade is low — what's the realistic commute time and amenity access for the typical tenant pool here? Any planned neighborhood developments (good or bad) we should know about?
- What's the average days-on-market for RENTAL listings here right now (not sales)? A rising rental-DOM trend means longer vacancies and softer asking-rent achievability than the comps imply.
- What's the recent tenant-quality profile in this submarket — average credit score on applications, eviction rate, late-payment / NSF rate, and stable-employment percentage? A property-management company in the area should have these aggregated.
- How much new for-sale + rental construction is in the pipeline within 1–3 miles? Heavy new supply typically softens prices + rents 12–24 months out; constrained supply supports both.
Investment metrics
- 1% rule
- 0.84% ✗
- Cap rate
- 5.14%
- Cash-on-cash
- -4.10%
- DSCR
- 0.82
- GRM
- 9.9
CMA / ARV
- ARV (on-the-fly)
- $858,608
- Comps found
- 3
Show comp detail 3 sales within ~0.75 mi
| Address | Dist | Beds/Ba | Sqft | Sold | Price | $/sf | Match |
|---|---|---|---|---|---|---|---|
| 13634 Kiltie Ct | 0.38mi | 3/2.0 (+1) | 2,012 (-4%) | 4mo | $800,000 | $398 | 69 |
| 14956 Rapolla Dr | 0.64mi | 2/2.5 | 1,794 (-14%) | 10mo | $740,000 | $412 | 37 |
| 13402 Whistler Mountain Rd | 0.70mi | 3/2.5 (+1) | 2,362 (+13%) | 9mo | $1,180,000 | $500 | 30 |
Match score weights: distance 35% · size 25% · config 20% · recency 20%. Top-matched comps best support the ARV.
Projected returns pro-forma
0.69% appreciation · 0.51% rent growth · sell at horizon
- IRR
- -5.7%
- Equity multiple
- 0.72×
- Total profit
- $-34,852
- Equity at exit
- $146,333
- IRR
- -1.7%
- Equity multiple
- 0.81×
- Total profit
- $-24,550
- Equity at exit
- $188,946
Cash invested: $126,000 (down + closing). Projections, not guarantees.
Landlord ↔ Tenant lean methodology
- Overall (STATE)
- 87 Strongly Landlord-Friendly
- State Florida
- 87 Strongly Landlord-Friendly · R+3
- County
- — inherits STATE
- City
- — inherits STATE
ZIP-level market 33446
- Home prices YoY
- 0.3%
- Rents YoY
- 0.5%
- Active inventory
- 584
- Price-to-rent
- 9.9×
Monthly cashflow live
- Estimated rent
- $3,779 high interval (Pro) →
- Mortgage (P&I)
- −$2,360
- Tax from tax record
- −$562 /mo · $6,742/yr
- Insurance
- −$188
- HOA
- −$307
- Vacancy / Maint / Mgmt
- −$794
- Net cashflow
- $-431
Break-even live
Sensitivity live
| Price | -10% $-176 | -5% $-303 | +0% $-431 | +5% $-558 | +10% $-685 |
|---|---|---|---|---|---|
| Rent | -10% $-729 | -5% $-580 | +0% $-431 | +5% $-281 | +10% $-132 |
| Rate | -1.0pp $-204 | -0.5pp $-316 | base $-431 | +0.5pp $-547 | +1.0pp $-666 |
UW: 25.0% down · 7.5% · 30yr · 1.5% tax · 5.0% vac · 8.0% maint · 8.0% mgmt
Financing live
Cash to close
- Down payment
- $112,500
- Closing costs
- $13,500
- Reserves months
- —
- Total cash needed
- —
Loan-product check · same deal, 3 products live
Conventional
25% down · 7.5% · 30yr
- Down + closing
- —
- Monthly P&I
- —
- Monthly cashflow
- —
- DSCR
- —
- Eligible?
- —
Personal DTI + credit; lowest rate.
DSCR
20% down · 8.5% · 30yr
- Down + closing
- —
- Monthly P&I
- —
- Monthly cashflow
- —
- DSCR
- —
- Eligible?
- —
No personal income docs; deal must DSCR.
Hard money
10% down · 12.0% · 12mo
- Down + closing
- —
- Monthly P&I
- —
- Monthly cashflow
- —
- DSCR
- —
- Eligible?
- —
Short-term bridge; refi at stabilization.
Rent comps 15 comps
| Address | Beds | Baths | Sqft | Rent | $/sqft | DOM | Units | Dist |
|---|---|---|---|---|---|---|---|---|
| 7904 Mansfield Hollow Rd Delray Beach, FL | 3.0 | 2.0 | 1865 | $3,950 | $2.12 | 26d | 1 | 0.21mi |
| 13851 Oneida Dr Unit D2 Delray Beach, FL | 3.0 | 2.0 | 1557 | $2,850 | $1.83 | 5d | 1 | 0.26mi |
| 14131 Rock Salt Rd Delray Beach, FL | 3.0 | 2.0 | 1490 | $4,800 | $3.22 | 4d | 1 | 0.34mi |
| 14131 Rock Salt Rd Delray Beach, FL | 3.0 | 2.0 | 1490 | $4,800 | $3.22 | 1d | 1 | 0.34mi |
| 13542 Weyburne Dr Delray Beach, FL | 3.0 | 2.0 | 1727 | $3,145 | $1.82 | 24d | 1 | 0.54mi |
| 14856 Barletta Way Delray Beach, FL | 2.0 | 2.0 | 1406 | $3,200 | $2.28 | 26d | 1 | 0.61mi |
| 15018 Three Ponds Trl Delray Beach, FL | 3.0 | 2.0 | 1703 | $4,150 | $2.44 | 14d | 1 | 0.93mi |
| 15018 Three Ponds Trl Delray Beach, FL | 3.0 | 2.0 | 1703 | $4,150 | $2.44 | 26d | 1 | 0.93mi |
| 6812 Belmont Shore Dr Delray Beach, FL | 3.0 | 2.5 | 2353 | $4,250 | $1.81 | 20d | 1 | 1.01mi |
| 7512 Eagle Point Dr Unit 7512 Delray Beach, FL | 3.0 | 2.0 | 1463 | $4,000 | $2.73 | 20d | 1 | 1.11mi |
| 7512 Eagle Point Dr Delray Beach, FL | 3.0 | 2.0 | 1461 | $4,000 | $2.74 | 1d | 1 | 1.11mi |
| 7512 Eagle Point Dr Delray Beach, FL | 3.0 | 2.0 | 1463 | $4,000 | $2.73 | 6d | 1 | 1.11mi |
| 7657 Lexington Club Blvd Delray Beach, FL | 3.0 | 2.0 | 1645 | $4,500 | $2.74 | 26d | 1 | 1.13mi |
| 14624 Three Ponds Trl Delray Beach, FL | 3.0 | 2.0 | 1411 | $3,250 | $2.30 | 19d | 1 | 1.14mi |
| 12882 Granite Mountain Pass Boynton Beach, FL | 3.0 | 3.0 | 2679 | $10,000 | $3.73 | 1d | 1 | 1.14mi |
HOA detail
- Monthly dues
- $307 · $3,684/yr
Listing history 21 events
-
2026-06-21days on market $450,000 Active 93 DOM
-
2026-06-18days on market $450,000 Active 90 DOM
-
2026-06-17days on market $450,000 Active 89 DOM
-
2026-06-16days on market $450,000 Active 88 DOM
-
2026-06-15days on market $450,000 Active 87 DOM
-
2026-06-13days on market $450,000 Active 85 DOM
-
2026-06-09days on market $450,000 Active 81 DOM
-
2026-06-08days on market $450,000 Active 80 DOM
-
2026-06-07days on market $450,000 Active 79 DOM
-
2026-06-04days on market $450,000 Active 76 DOM
-
2026-06-03days on market $450,000 Active 75 DOM
-
2026-06-02days on market $450,000 Active 74 DOM
-
2026-06-01days on market $450,000 Active 73 DOM
-
2026-05-31days on market $450,000 Active 72 DOM
-
2026-03-17$450,000 Active
-
2025-12-17soldstatus $325,000
-
2025-03-18historical
-
2025-02-16price $375,000
-
2024-12-19$400,000 Active
-
1993-02-11soldstatus $133,000
-
1990-07-10soldstatus $120,000
ⓘ Source: listings_history table (triggers on properties + properties_extension) + one-shot
backfill from property_details.listing_events for pre-trigger history.
Tax reassessment forecast FL · Resets to sale price
- Current annual tax
- $6,742 · $562/mo
- Projected year-2 tax
- $6,742 · $562/mo
- Expected delta
- $0/yr ($0/mo · 0.0%)
ⓘ Screening estimate from a state-policy table — verify with the county assessor before closing.
Climate risk First Street
- Flood 1/10 Low FEMA zone X (unshaded) · 0% chance over 30 yrs
- Wildfire 4/10 Moderate
- Heat 10/10 Extreme 7 d/yr ≥107°F today · 27 d/yr by 30 yrs out
- Wind 10/10 Extreme 99% chance of damaging wind over 30 yrs
- Air quality 2/10 Low 0 unhealthy d/yr today · 2 by 30 yrs out
Nearby sold comps map
Loading sold comps map…
Walkable amenities ~0.75 mi
Loading nearby amenities…
Taxation est. · year 1
- Rental income
- $45,352
- − Mortgage interest
- −$25,207
- − Property taxes
- −$6,742
- − Insurance
- −$2,250
- − Repairs & maintenance
- −$3,628
- − Management
- −$3,628
- − HOA
- −$3,684
- − Depreciation
- −$13,091
- Taxable loss
- −$12,879
- Est. tax savings @ 24.0%
- +$3,091
- After-tax cash flow
- $-2,076/yr
For passive investors: Depreciation is non-cash, so a rental often shows a tax loss while cash-flowing — sheltering income. Rental losses are passive: they offset passive income freely, and up to $25,000/yr can offset ordinary (W-2) income if you actively participate and your MAGI is under $100k (phasing out to $0 by $150k); unused losses carry forward. On sale, claimed depreciation is recaptured at up to 25%, and gains may owe capital-gains tax (a 1031 exchange can defer both). Figures are a year-1 estimate at your 24.0% rate — not tax advice; consult a CPA.
Schools (NCES district)
- District
- Palm Beach
- NCES district ID
- 1201500
- Math proficiency
- 46% ▼ -16.00%
- Reading proficiency
- 53% ▼ -4.00%
- Median HH income
- $53,943
- Composite
- 42.72/100
- National rank
- #3160
- State rank
- #34 of 73 in FL
Livability — Delray Beach
- Score
- 77/100
- State rank
- #202
- US rank
- #3160
Category grades
Schools grade is shown separately in the Schools card above.
Census & demographics
- County
- Palm Beach County · 1,438,312 people
- City population
- 123,167
- Metro
- Miami-Fort Lauderdale-Pompano Beach, FL
- Population (ZIP)
- 28,431
- Household income
- $80,187
- Rent vs Own
- Severe rent burden
- 494.0
Population outlook (Palm Beach County) Hauer SSP2
- Today (2025)
- 1,637,487 people
- By 2030
- 1,743,255 · +6.5%
- By 2040
- 1,948,712 · +19.0%
- By 2050
- 2,132,979 · +30.3%
- By 2075
- 2,530,027 · +54.5%
- By 2100
- 2,706,979 · +65.3%
Race, ethnicity, and origin ACS 2023
- Neighborhood character
- Predominantly White (79%)
- Race & ethnicity
- White 79% Hispanic / Latino 13% Two or more races 9% Black 4%
- Hispanic origin (detail)
- Puerto Rican 3% Dominican 1%
- Common ancestry
- Romanian 9% Scotch-Irish 9% Italian 2%
- Foreign-born
- 20% · Canada, Jamaica, Guatemala
- Languages at home
- 80% English-only · Spanish 12% Other Indo-European 2% French/Haitian/Cajun 2%
Political lean MEDSL · Palm Beach
- 2024 margin
- Toss-up / Even · D 50.0% · R 49.2%
- 2008→2024 swing
- -22.1pp toward R · 2008: 22.9pp · 2024: 0.8pp
- All cycles
- 2024: D+0.8 2020: D+12.8 2016: D+15.3 2012: D+17.0 2008: D+22.9
Not yet ingested
- Civics
- —
Market trends
- HPI YoY
- ▲ 0.69%
- Current HPI
- 242.5138
- Rent YoY
- ▲ 0.51%
- Metro
- Miami-Fort Lauderdale-Pompano Beach, FL
- State GDP YoY
- ▲ 3.28%
- F500 in state
- 36
Industry mix (Fortune 500 HQ in FL)
| Industry | F500 HQs | Revenue |
|---|---|---|
| Industrial Technology | 2 | $29B |
|
||
| Insurance | 2 | $17B |
|
||
| Retail | 1 | $60B |
|
||
| Technology Distribution | 1 | $58B |
|
||
| Homebuilding | 1 | $35B |
|
||
| Technology Manufacturing | 1 | $35B |
|
||
Price history
+275.0% since first listed7 events — show timeline
- 2026-03-17 Listed $450,000 Beaches MLS
- 2025-12-17 Sold (Public Records) $325,000 Public Records
- 2025-03-18 Listing Removed — Beaches MLS
- 2025-02-16 Price Changed $375,000 Beaches MLS
- 2024-12-19 Listed $400,000 Beaches MLS
- 1993-02-11 Sold (Public Records) $133,000 Public Records
- 1990-07-10 Sold (Public Records) $120,000 Public Records
Property tax history
+8.4%/yrLatest (2025): $6,742 · +3.0% YoY. Source: county tax records.
Cash-flow waterfall
monthlySold comps — $/sqft
last 12 mo · ≤1 miLoading sold comps…