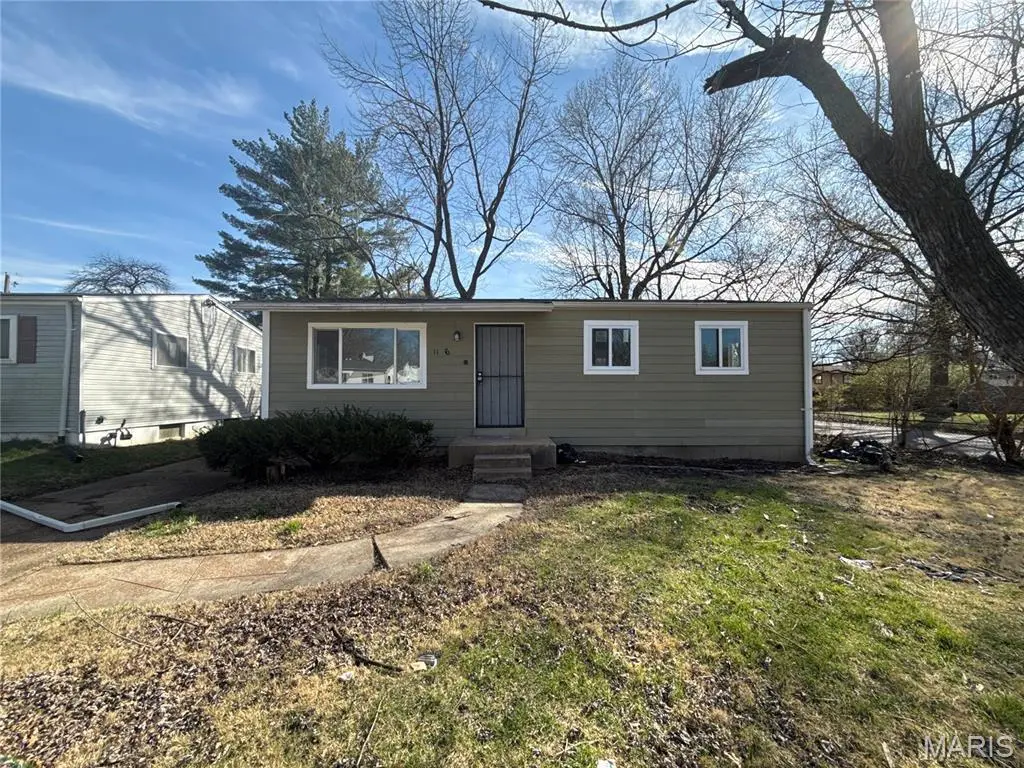
1156 Scott Ave · Spanish Lake, MO
Flood risk 3/10 · Minor
- FEMA flood zone
- X (unshaded)
- Chance of flooding over 30 yrs
- 0.2%
- Est. flood insurance / yr
- $473 – $860
Fire risk 1/10 · Minimal
- Est. fire insurance / yr
- $1,054 – $1,958
Heat risk 5/10 · Moderate
- Hot days now (above 107°F)
- 7 days/yr
- Hot days in 30 yrs
- 21 days/yr
Wind risk 2/10 · Minimal
- Chance of severe wind over 30 yrs
- 1.0%
Air-quality risk 4/10 · Minor
- Unhealthy air days now
- 4 days/yr
- Unhealthy air days in 30 yrs
- 5 days/yr
Risk factors via First Street. Map © Google.
Why this score? — see what drove the C+ grade
The composite is a weighted blend of 9 inputs, each scored 0–100. Each bar is that input's sub-score; the figure is the points it added to the 100-point composite (weight × sub-score).
- Cash flow +30.0/30.0
- DSCR +10.0/10.0
- 1% rule +9.2/10.0
- ARV discount +3.0/15.0
- Livability +2.6/5.0
- Condition / age +2.5/5.0
- Rent growth +2.1/5.0
- Schools +1.7/10.0
- Appreciation +0.0/10.0
$99,900
🖨 Deal sheet 📄 Offer letter ✓ Due diligence
Listing remarks MLS
Perfect investment opportunity to add to your portfolio! This fully remodeled three bedroom; one bathroom single family home in North St. Louis County has brand new luxury vinyl plank flooring, freshly painted all neutral colors. Brand new windows, doors, trim, comes with kitchen appliances and a fully remodeled kitchen, brand new bathtub and shower surround with a new bathroom vanity, all new light fixtures, full unfinished basement. Schedule your showing today!
Key facts
- Brand new bathtub
- Brand new windows
- 5,201 sq ft lot
Tags
Neighborhood map
What this means for you Summary
Snapshot
- This is a 3-bed/1.0-bath single-family listed at $100k.
Deal economics
- At list price, monthly cash flow is $474 ($6k/yr) — positive.
- The deal already cash-flows at list — no discount required.
- Meets the 1% rule at list price ($1k rent vs $100k).
- Recommended offer: $97k (3.0% below list) — sets the bar for market timing.
- Cap rate 12.0% vs local median 7.9% in Spanish Lake — top-decile yield for the area; either an underpriced asset or a hidden risk that comps aren't pricing in. Stress-test before assuming the spread holds.
Location & tenants
- Location reads 51/100 on livability (#870 in MO) — a working-class tenant base; expect higher turnover. Strengths: cost of living A+, housing A+; Watch: schools F, crime F, amenities F.
- Hazelwood (suburban): math 11% / reading 26% proficiency, ranked #306 of 324 in MO (top 94%) — low school quality limits family demand, transient renter base, plan for 1-2y turnover.
- Market conditions: Rents soft (-1.5%/yr); 101 active listings in the ZIP; 19 comparable units currently listed for rent nearby; rentals at typical pace (median 24d on market — plan ~3-4 weeks tenant-placement turnaround); 920 units permitted in St. Louis County in 2024 (250 in 5+ unit buildings).
- This rent runs 30% of the median local income ($56k/yr) — at the standard rent-burdened threshold; future hikes will face affordability resistance.
Forward outlook
- Local home prices are declining (-3.0%/yr); year-one equity from $691 of loan paydown is wiped out by about $3k of value loss. Plan a longer hold.
- At projected returns (-3.0% appreciation + 0.0% rent growth), your $28k cash investment doubles in ~8 years — after that, you're playing with house money.
Negotiation context
- It's been on market 43 days — a 3% lower offer ($97k) is reasonable based on typical stale-listing flexibility.
- 2 sale attempts with the ask held roughly flat each time — persistent listings suggest the price (not the market) is what's stuck; bring a comps-based counter.
- Current owner paid $42k; list at $100k implies a 138% gain — meaningful room to come down on a strong offer.
Risks & watch-outs
- Watch-outs: built in 1958 — expect roof / HVAC / electrical / plumbing capex.
- Climate carrying-cost: extreme-heat days projected 7→21/yr by 2055 (HVAC capex compounding) — expect insurance premiums to compound above CPI over the hold.
Questions for the listing agent
- It's been on market 43 days. Have you received any prior offers? Is the seller open to a 3% concession, seller financing, or rate buy-down credit?
- Built in 1958 — when were the roof, HVAC, electrical panel, plumbing, and water heater last replaced?
- Is there a deadline driving the sale (1031 exchange, divorce, estate, relocation)? That informs how much negotiation room exists.
- Schools are F-rated, which usually means shorter tenancies and higher turnover. Who's the typical renter profile here, and what's been the actual vacancy rate?
- Crime grade is F in this area — have there been break-ins, vandalism, or insurance claims at this property in the last 3 years? What carrier currently insures it and at what premium?
- What's the average days-on-market for RENTAL listings here right now (not sales)? A rising rental-DOM trend means longer vacancies and softer asking-rent achievability than the comps imply.
- What's the recent tenant-quality profile in this submarket — average credit score on applications, eviction rate, late-payment / NSF rate, and stable-employment percentage? A property-management company in the area should have these aggregated.
- How much new for-sale + rental construction is in the pipeline within 1–3 miles? Heavy new supply typically softens prices + rents 12–24 months out; constrained supply supports both.
Investment metrics
- 1% rule
- 1.42% ✓
- Cap rate
- 11.99%
- Cash-on-cash
- 20.36%
- DSCR
- 1.91
- GRM
- 5.9
CMA / ARV
- ARV (median comp)
- $90,904
- List price
- $99,900
- Delta
- 9.90%
- Verdict
- FAIR
- Comps
- 20 within 1.0 mi
Show comp detail 12 sales within ~0.75 mi
| Address | Dist | Beds/Ba | Sqft | Sold | Price | $/sf | Match |
|---|---|---|---|---|---|---|---|
| 1157 Scott | 0.02mi | 3/1.0 | 864 (0%) | 3mo | $137,900 | $160 | 96 |
| 1219 Congress Ave | 0.06mi | 3/1.0 | 864 (0%) | 4mo | $29,900 | $35 | 94 |
| 1200 Baron Ave | 0.10mi | 3/1.0 | 864 (0%) | 2mo | $77,500 | $90 | 94 |
| 1221 Scott Ave | 0.07mi | 3/1.0 | 864 (0%) | 4mo | $85,000 | $98 | 94 |
| 1136 Walker Ave | 0.17mi | 3/1.0 | 864 (0%) | 3mo | $125,000 | $145 | 90 |
| 1125 Walker Ave | 0.20mi | 3/1.0 | 864 (0%) | 3mo | $114,999 | $133 | 88 |
| 1141 Walker Ave | 0.18mi | 2/1.5 (-1) | 864 (0%) | 3mo | $105,000 | $122 | 82 |
| 1231 Reale Ave | 0.23mi | 2/1.5 (-1) | 864 (0%) | 2mo | $69,900 | $81 | 80 |
| 1209 Northdale Ave | 0.48mi | 2/1.0 (-1) | 864 (0%) | 1mo | $79,900 | $92 | 72 |
| 1072 Prigge Rd | 0.19mi | 3/1.5 | 960 (+11%) | 0mo | $99,900 | $104 | 70 |
| 1135 Cove Ln | 0.28mi | 2/1.0 (-1) | 936 (+8%) | 2mo | $85,000 | $91 | 67 |
| 1459 Cove Ln | 0.55mi | 3/1.5 | 988 (+14%) | 3mo | $79,900 | $81 | 46 |
Match score weights: distance 35% · size 25% · config 20% · recency 20%. Top-matched comps best support the ARV.
Projected returns pro-forma
-3.0% appreciation · 0.0% rent growth · sell at horizon
- IRR
- 9.3%
- Equity multiple
- 1.35×
- Total profit
- $9,870
- Equity at exit
- $14,895
- IRR
- 15.9%
- Equity multiple
- 2.12×
- Total profit
- $31,421
- Equity at exit
- $8,638
Cash invested: $27,972 (down + closing). Projections, not guarantees.
Landlord ↔ Tenant lean methodology
- Overall (STATE)
- 81 Strongly Landlord-Friendly
- State Missouri
- 81 Strongly Landlord-Friendly · R+10
- County
- — inherits STATE
- City
- — inherits STATE
ZIP-level market 63138
- Home prices YoY
- -31.0%
- Rents YoY
- -1.5%
- Active inventory
- 101
- Price-to-rent
- 5.9×
Monthly cashflow live
- Estimated rent
- $1,418 high interval (Pro) →
- Mortgage (P&I)
- −$524
- Tax from tax record
- −$80 /mo · $965/yr
- Insurance
- −$42
- HOA
- −$0
- Vacancy / Maint / Mgmt
- −$298
- Net cashflow
- $474
Break-even live
UW: 25.0% down · 7.5% · 30yr · 1.5% tax · 5.0% vac · 8.0% maint · 8.0% mgmt
Financing live
Cash to close
- Down payment
- $24,975
- Closing costs
- $2,997
- Reserves months
- —
- Total cash needed
- —
Loan-product check · same deal, 3 products live
Conventional
25% down · 7.5% · 30yr
- Down + closing
- —
- Monthly P&I
- —
- Monthly cashflow
- —
- DSCR
- —
- Eligible?
- —
Personal DTI + credit; lowest rate.
DSCR
20% down · 8.5% · 30yr
- Down + closing
- —
- Monthly P&I
- —
- Monthly cashflow
- —
- DSCR
- —
- Eligible?
- —
No personal income docs; deal must DSCR.
Hard money
10% down · 12.0% · 12mo
- Down + closing
- —
- Monthly P&I
- —
- Monthly cashflow
- —
- DSCR
- —
- Eligible?
- —
Short-term bridge; refi at stabilization.
Rent comps 19 comps
| Address | Beds | Baths | Sqft | Rent | $/sqft | DOM | Units | Dist |
|---|---|---|---|---|---|---|---|---|
| 1141 Scott Ave Saint Louis, MO | 3.0 | 1.0 | 864 | $1,400 | $1.62 | 21d | 1 | 0.05mi |
| 1218 Walker Ave Saint Louis, MO | 3.0 | 1.0 | 936 | $1,275 | $1.36 | 23d | 1 | 0.18mi |
| 1223 Walker Ave Saint Louis, MO | 4.0 | 1.0 | 936 | $1,800 | $1.92 | 43d | 1 | 0.21mi |
| 1132 Redman Blvd Saint Louis, MO | 4.0 | 1.0 | 1080 | $1,195 | $1.11 | 43d | 1 | 0.33mi |
| 1359 Cove Ln Saint Louis, MO | 3.0 | 1.0 | 925 | $1,427 | $1.54 | 2d | 1 | 0.37mi |
| 1376 Cove Ln Saint Louis, MO | 3.0 | 1.0 | 925 | $1,365 | $1.48 | 23d | 1 | 0.37mi |
| 11891 Bridgevale Ave Saint Louis, MO | 3.0 | 1.0 | 864 | $1,350 | $1.56 | 23d | 1 | 0.39mi |
| 11921 Larimore Rd Saint Louis, MO | 3.0 | 1.0 | 1078 | $1,100 | $1.02 | 43d | 1 | 0.55mi |
| 11930 Criterion Ave Saint Louis, MO | 3.0 | 1.0 | 816 | $1,350 | $1.65 | 43d | 1 | 0.56mi |
| 1504 Redman Blvd Saint Louis, MO | 3.0 | 2.0 | 1014 | $1,299 | $1.28 | 4d | 1 | 0.62mi |
| 1455 Broadlawns Ln Saint Louis, MO | 3.0 | 1.0 | 912 | $1,395 | $1.53 | 12d | 1 | 0.72mi |
| 1473 Broadlawns Ln Saint Louis, MO | 3.0 | 1.0 | 1000 | $1,400 | $1.40 | 43d | 1 | 0.74mi |
| 1333 N Garden Dr St. Louis, MO | 2.0 | 1.0 | 626 | $1,100 | $1.76 | 43d | 1 | 0.88mi |
| 1342 N Garden Dr Saint Louis, MO | 2.0 | 1.0 | 626 | $1,100 | $1.76 | 1d | 3 | 0.91mi |
| 1321 Dominica Dr Saint Louis, MO | 3.0 | 1.0 | 1012 | $1,400 | $1.38 | 43d | 1 | 1.04mi |
| 1708 San Remo Ct St. Louis, MO | 1.0–3.0 | 1.0–1.5 | 1053 | $1,300 | $1.23 | 1d | 9 | 1.07mi |
| 257 Glen Garry Rd Saint Louis, MO | 3.0 | 1.0 | 873 | $1,025 | $1.17 | 14d | 1 | 1.44mi |
| 12367 Horizon Village Dr Unit 12367 I St. Louis, MO | 2.0 | 1.0 | 836 | $995 | $1.19 | 23d | 1 | 1.46mi |
| 10527 Prestwick Dr Saint Louis, MO | 3.0 | 2.0 | 854 | $1,395 | $1.63 | 7d | 1 | 1.47mi |
Listing history 14 events
-
2026-06-09days on market $99,900 Active 43 DOM
-
2026-06-08days on market $99,900 Active 42 DOM
-
2026-06-07days on market $99,900 Active 41 DOM
-
2026-06-05days on market $99,900 Active 38 DOM
-
2026-06-03days on market $99,900 Active 37 DOM
-
2026-06-02days on market $99,900 Active 36 DOM
-
2026-06-01days on market $99,900 Active 35 DOM
-
2026-05-31days on market $99,900 Active 34 DOM
-
2026-05-02status Active 467-char remark
Show marketing remark (467 chars)
Perfect investment opportunity to add to your portfolio! This fully remodeled three bedroom; one bathroom single family home in North St. Louis County has brand new luxury vinyl plank flooring, freshly painted all neutral colors. Brand new windows, doors, trim, comes with kitchen appliances and a fully remodeled kitchen, brand new bathtub and shower surround with a new bathroom vanity, all new light fixtures, full unfinished basement. Schedule your showing today!
-
2026-04-19status Pending 467-char remark
Show marketing remark (467 chars)
Perfect investment opportunity to add to your portfolio! This fully remodeled three bedroom; one bathroom single family home in North St. Louis County has brand new luxury vinyl plank flooring, freshly painted all neutral colors. Brand new windows, doors, trim, comes with kitchen appliances and a fully remodeled kitchen, brand new bathtub and shower surround with a new bathroom vanity, all new light fixtures, full unfinished basement. Schedule your showing today!
-
2026-04-14$99,900 Active 467-char remark
Show marketing remark (467 chars)
Perfect investment opportunity to add to your portfolio! This fully remodeled three bedroom; one bathroom single family home in North St. Louis County has brand new luxury vinyl plank flooring, freshly painted all neutral colors. Brand new windows, doors, trim, comes with kitchen appliances and a fully remodeled kitchen, brand new bathtub and shower surround with a new bathroom vanity, all new light fixtures, full unfinished basement. Schedule your showing today!
-
2020-08-19soldstatus $42,000
-
2020-08-07soldstatus $15,000
-
2006-06-22soldstatus $92,000
ⓘ Source: listings_history table (triggers on properties + properties_extension) + one-shot
backfill from property_details.listing_events for pre-trigger history.
Tax reassessment forecast MO · Resets to sale price
- Current annual tax
- $965 · $80/mo
- Projected year-2 tax
- $969 · $81/mo
- Expected delta
- +$4/yr ($0/mo · 0.4%)
ⓘ Screening estimate from a state-policy table — verify with the county assessor before closing.
Climate risk First Street
- Flood 3/10 Moderate FEMA zone X (unshaded) · 20% chance over 30 yrs
- Wildfire 1/10 Low
- Heat 5/10 Major 7 d/yr ≥107°F today · 21 d/yr by 30 yrs out
- Wind 2/10 Low 100% chance of damaging wind over 30 yrs
- Air quality 4/10 Moderate 4 unhealthy d/yr today · 5 by 30 yrs out
Nearby sold comps map
Loading sold comps map…
Walkable amenities ~0.75 mi
Loading nearby amenities…
Taxation est. · year 1
- Rental income
- $17,019
- − Mortgage interest
- −$5,596
- − Property taxes
- −$965
- − Insurance
- −$500
- − Repairs & maintenance
- −$1,362
- − Management
- −$1,362
- − Depreciation
- −$2,906
- Taxable income
- $4,329
- Est. tax owed @ 24.0%
- −$1,039
- After-tax cash flow
- $4,655/yr
For passive investors: Depreciation is non-cash, so a rental often shows a tax loss while cash-flowing — sheltering income. Rental losses are passive: they offset passive income freely, and up to $25,000/yr can offset ordinary (W-2) income if you actively participate and your MAGI is under $100k (phasing out to $0 by $150k); unused losses carry forward. On sale, claimed depreciation is recaptured at up to 25%, and gains may owe capital-gains tax (a 1031 exchange can defer both). Figures are a year-1 estimate at your 24.0% rate — not tax advice; consult a CPA.
Schools (NCES district)
- District
- Hazelwood
- NCES district ID
- 2913830
- Math proficiency
- 11% ▼ -13.00%
- Reading proficiency
- 26% ▼ -6.00%
- Median HH income
- $51,621
- Composite
- 16.77/100
- National rank
- #9156
- State rank
- #306 of 324 in MO
Livability — Spanish Lake
- Score
- 51/100
- State rank
- #870
- US rank
- #25189
Category grades
Schools grade is shown separately in the Schools card above.
Census & demographics
- Census place
- Spanish Lake, MO
- County
- Saint Louis County · 888,823 people
- City population
- 18,233
- Metro
- St. Louis, MO-IL
- Population (ZIP)
- 18,233
- Household income
- $56,096
- Rent vs Own
- Severe rent burden
- 925.0
Population outlook (St. Louis County) Hauer SSP2
- Today (2025)
- 1,025,227 people
- By 2030
- 1,028,023 · +0.3%
- By 2040
- 1,020,940 · -0.4%
- By 2050
- 1,007,280 · -1.8%
- By 2075
- 987,277 · -3.7%
- By 2100
- 921,984 · -10.1%
Race, ethnicity, and origin ACS 2023
- Neighborhood character
- Predominantly Black (81%)
- Race & ethnicity
- Black 81% White 14% Two or more races 4% Hispanic / Latino 1%
- Foreign-born
- 2% · Canada
- Languages at home
- 98% English-only · Spanish 1%
Political lean MEDSL · St. Louis
- 2024 margin
- Strong D (+23.4) · D 60.8% · R 37.4% · Other 1.7%
- 2008→2024 swing
- +3.5pp toward D · 2008: 19.9pp · 2024: 23.4pp
- All cycles
- 2024: D+23.4 2020: D+24.0 2016: D+16.2 2012: D+13.7 2008: D+19.9
Not yet ingested
- Civics
- —
Market trends
- HPI YoY
- ▼ -74.09%
- Current HPI
- 165.2146
- Rent YoY
- ▼ -1.54%
- Metro
- St. Louis, MO-IL
- State GDP YoY
- ▲ 1.84%
- F500 in state
- 20
Industry mix (Fortune 500 HQ in MO)
| Industry | F500 HQs | Revenue |
|---|---|---|
| Healthcare | 1 | $163B |
|
||
| Insurance | 1 | $21B |
|
||
| Industrial Technology | 1 | $17B |
|
||
| Retail | 1 | $16B |
|
||
| Industrial Distribution | 1 | $10B |
|
||
| Utilities | 1 | $9B |
|
||
Price history
+8.6% since first listed6 events — show timeline
- 2026-05-02 Relisted — MARIS as Distributed by MLS Grid
- 2026-04-19 Pending — MARIS as Distributed by MLS Grid
- 2026-04-14 Listed $99,900 MARIS as Distributed by MLS Grid
- 2020-08-19 Sold (Public Records) $42,000 Public Records
- 2020-08-07 Sold (Public Records) $15,000 Public Records
- 2006-06-22 Sold (Public Records) $92,000 Public Records
Property tax history
-4.5%/yrLatest (2022): $965 · +1.5% YoY. Source: county tax records.
Cash-flow waterfall
monthlySold comps — $/sqft
last 12 mo · ≤1 miLoading sold comps…