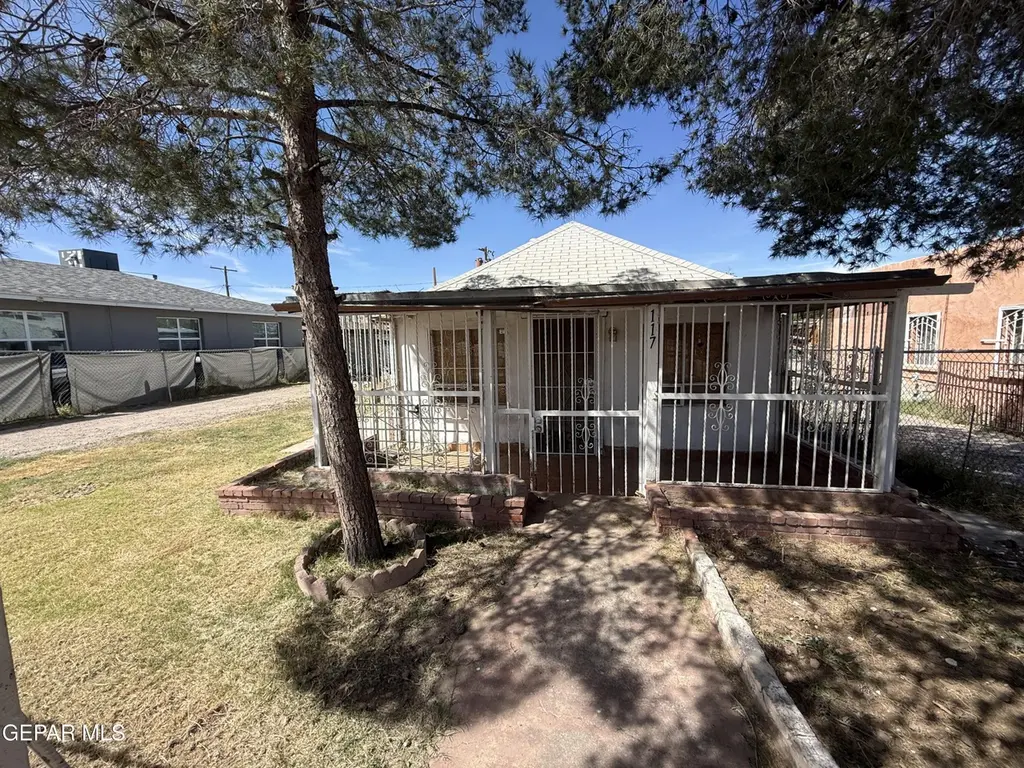
117 Hadlock St · El Paso, TX
Flood risk 1/10 · Minimal
- FEMA flood zone
- X
- Chance of flooding over 30 yrs
- 0.0%
- Est. flood insurance / yr
- $507 – $1,088
Fire risk 1/10 · Minimal
- Est. fire insurance / yr
- $1,222 – $2,270
Heat risk 6/10 · Moderate
- Hot days now (above 102°F)
- 7 days/yr
- Hot days in 30 yrs
- 26 days/yr
Wind risk 1/10 · Minimal
- Chance of severe wind over 30 yrs
- —
Air-quality risk 2/10 · Minimal
- Unhealthy air days now
- 1 days/yr
- Unhealthy air days in 30 yrs
- 2 days/yr
Risk factors via First Street. Map © Google.
Why this score? — see what drove the C grade
The composite is a weighted blend of 9 inputs, each scored 0–100. Each bar is that input's sub-score; the figure is the points it added to the 100-point composite (weight × sub-score).
- Cash flow +17.9/30.0
- Appreciation +10.0/10.0
- ARV discount +7.5/15.0
- 1% rule +5.8/10.0
- DSCR +5.6/10.0
- Livability +4.0/5.0
- Schools +2.7/10.0
- Rent growth +2.5/5.0
- Condition / age +2.5/5.0
$97,000
🖨 Deal sheet 📄 Offer letter ✓ Due diligence
Listing remarks
Investment Opportunity in the Heart of El Paso's Medical District - This 2-bedroom, 2¾-bath home offers 759 sq ft of living space plus a 420 sq ft ADU -- two income-producing units on a 5,000 sq ft lot in one of El Paso's most strategically located neighborhoods. Situated in the Medical Center of the Americas corridor in Central/South El Paso, this property sits walking distance from Texas Tech University Health Sciences Center and the Paul L. Foster School of Medicine -- and just moments from the upcoming Fox Cancer Center at TTUHSC El Paso, a development that will only strengthen demand in this area for years to come. The built-in tenant pool here is hard to replicate: travel nurse
Key facts
- Built-in tenant pool
- Medical district
- 5,000 sq ft lot
Tags
Neighborhood map
What this means for you Summary
Snapshot
- This is a 2-bed/1.0-bath single-family listed at $97k.
Deal economics
- At list price, monthly cash flow is $81 ($973/yr) — positive.
- The deal already cash-flows at list — no discount required.
- Meets the 1% rule at list price ($1k rent vs $97k).
Location & tenants
- Location reads 81/100 on livability (#23 in TX, #1,375 nationally) — a professional / high-income tenant draw. Strengths: commute A+, cost of living A+, housing A+; Watch: employment D+.
- El Paso ISD (urban): math 27% / reading 37% proficiency, ranked #591 of 826 in TX (top 72%) — families likely to look elsewhere, expect single-tenant / working-renter base with shorter leases; 65% free/reduced lunch — lower-income household profile, screen leases tightly.
- Zoned schools: Jefferson H S (math 17% / reading 18%, grade F, #1,451 of 1,632 statewide, top 89%, 1,107 students, 97% FRL) — zoned schools average 97% FRL vs 65% district-wide (32 pts higher); higher-poverty schools than district average — tighter screening recommended.
- Zoned-school proficiency averages 18% at this address vs 32% district-wide (-14 pts) — the specific schools serving this property underperform the El Paso ISD average; the district grade overstates school quality for this exact location.
- Market conditions: 60 active listings in the ZIP; 27 comparable units currently listed for rent nearby; rentals lingering (median 44d on market — plan ~5-8 weeks vacancy on turnover, expect pricing pressure); 56% of comp listings sitting > 30 days — soft ceiling on asking rent; 2,196 units permitted in El Paso County in 2024 (143 in 5+ unit buildings).
Forward outlook
- In year one you build about $10k of equity ($671 loan paydown + $10k appreciation (10.0% local appreciation)).
- El Paso County population projected at +10% by 2050 — modest demand growth; plan on rents tracking national, not racing it.
- At projected returns (10.0% appreciation + 3.0% rent growth), your $27k cash investment doubles in ~3 years — after that, you're playing with house money.
- By year 4, paydown + projected appreciation supports a ~$37k cash-out refi (75% LTV) — recoverable capital for the next deal without selling this one.
Negotiation context
- Only 8 days on market — expect competitive offers; lowballing is unlikely to land.
Risks & watch-outs
- Watch-outs: built in 1937 — expect roof / HVAC / electrical / plumbing capex.
- Climate carrying-cost: extreme-heat days projected 7→26/yr by 2055 (HVAC capex compounding) — expect insurance premiums to compound above CPI over the hold.
Questions for the listing agent
- Built in 1937 — when were the roof, HVAC, electrical panel, plumbing, and water heater last replaced?
- Is there a deadline driving the sale (1031 exchange, divorce, estate, relocation)? That informs how much negotiation room exists.
- Schools are B-rated — typically a magnet for longer-tenancy family renters. What's the average tenant stay here, and is there a school-zone premium baked into asking?
- What's the average days-on-market for RENTAL listings here right now (not sales)? A rising rental-DOM trend means longer vacancies and softer asking-rent achievability than the comps imply.
- What's the recent tenant-quality profile in this submarket — average credit score on applications, eviction rate, late-payment / NSF rate, and stable-employment percentage? A property-management company in the area should have these aggregated.
- How much new for-sale + rental construction is in the pipeline within 1–3 miles? Heavy new supply typically softens prices + rents 12–24 months out; constrained supply supports both.
Investment metrics
- 1% rule
- 1.08% ✓
- Cap rate
- 7.30%
- Cash-on-cash
- 3.58%
- DSCR
- 1.16
- GRM
- 7.7
CMA / ARV
No comps found within radius.
Projected returns pro-forma
10.0% appreciation · 3.0% rent growth · sell at horizon
- IRR
- 26.9%
- Equity multiple
- 3.14×
- Total profit
- $58,054
- Equity at exit
- $87,385
- IRR
- 23.5%
- Equity multiple
- 7.15×
- Total profit
- $167,022
- Equity at exit
- $188,450
Cash invested: $27,160 (down + closing). Projections, not guarantees.
Landlord ↔ Tenant lean methodology
- Overall (STATE)
- 87 Strongly Landlord-Friendly
- State Texas
- 87 Strongly Landlord-Friendly · R+5
- County
- — inherits STATE
- City
- — inherits STATE
ZIP-level market 79905
- Home prices YoY
- 12.8%
- Active inventory
- 60
- Price-to-rent
- 7.7×
Monthly cashflow live
- Estimated rent
- $1,047 high interval (Pro) →
- Mortgage (P&I)
- −$509
- Tax from tax record
- −$197 /mo · $2,361/yr
- Insurance
- −$40
- HOA
- −$0
- Vacancy / Maint / Mgmt
- −$220
- Net cashflow
- $81
Break-even live
UW: 25.0% down · 7.5% · 30yr · 1.5% tax · 5.0% vac · 8.0% maint · 8.0% mgmt
Financing live
Cash to close
- Down payment
- $24,250
- Closing costs
- $2,910
- Reserves months
- —
- Total cash needed
- —
Loan-product check · same deal, 3 products live
Conventional
25% down · 7.5% · 30yr
- Down + closing
- —
- Monthly P&I
- —
- Monthly cashflow
- —
- DSCR
- —
- Eligible?
- —
Personal DTI + credit; lowest rate.
DSCR
20% down · 8.5% · 30yr
- Down + closing
- —
- Monthly P&I
- —
- Monthly cashflow
- —
- DSCR
- —
- Eligible?
- —
No personal income docs; deal must DSCR.
Hard money
10% down · 12.0% · 12mo
- Down + closing
- —
- Monthly P&I
- —
- Monthly cashflow
- —
- DSCR
- —
- Eligible?
- —
Short-term bridge; refi at stabilization.
Rent comps 27 comps
| Address | Beds | Baths | Sqft | Rent | $/sqft | DOM | Units | Dist |
|---|---|---|---|---|---|---|---|---|
| 231 Francis St Unit A El Paso, TX | 1.0 | 1.0 | 784 | $1,100 | $1.40 | 3d | 1 | 0.32mi |
| 231 Francis St Unit 1B El Paso, TX | 1.0 | 1.0 | 600 | $750 | $1.25 | 43d | 1 | 0.32mi |
| 231 Francis St Unit A El Paso, TX | 1.0 | 1.0 | 800 | $900 | $1.12 | 43d | 1 | 0.32mi |
| 422 Val Verde St El Paso, TX | 3.0 | 1.0 | 1049 | $1,045 | $1.00 | 43d | 1 | 0.65mi |
| 4006 Laredo Ave Unit 1 El Paso, TX | 2.0 | 1.0 | 952 | $895 | $0.94 | 3d | 1 | 0.69mi |
| 3906 Tularosa Ave El Paso, TX | 2.0 | 1.0 | 1013 | $1,050 | $1.04 | 43d | 1 | 0.92mi |
| 821 Olson St El Paso, TX | 2.0 | 2.0 | 800 | $1,250 | $1.56 | 3d | 1 | 0.94mi |
| 1111 Radford St Unit B El Paso, TX | 1.0 | 1.0 | 545 | $950 | $1.74 | 23d | 1 | 0.98mi |
| 608 Barcelona Dr El Paso, TX | 2.0 | 1.0 | 769 | $1,150 | $1.50 | 3d | 1 | 0.99mi |
| 608 Barcelona Dr El Paso, TX | 2.0 | 1.0 | 769 | $1,200 | $1.56 | 23d | 1 | 0.99mi |
| 4821 Flower Dr El Paso, TX | 3.0 | 1.5 | 900 | $1,385 | $1.54 | 14d | 1 | 1.03mi |
| 3900 La Luz Ave Unit D El Paso, TX | 1.0 | 1.0 | 561 | $1,000 | $1.78 | 14d | 1 | 1.05mi |
| 187 N Awbrey St Unit 1 El Paso, TX | 2.0 | 1.0 | 891 | $850 | $0.95 | 19d | 1 | 1.12mi |
| 4514 Bliss Ave El Paso, TX | 2.0 | 1.0 | 840 | $1,100 | $1.31 | 43d | 1 | 1.14mi |
| 3121 Frutas Ave Unit 04 El Paso, TX | 2.0 | 1.0 | 540 | $700 | $1.30 | 23d | 1 | 1.18mi |
| 3119 Frutas Ave Apt 6 El Paso, TX | 2.0 | 1.0 | 600 | $700 | $1.17 | 43d | 1 | 1.20mi |
| 3814 Hueco Ave El Paso, TX | 2.0 | 1.0 | 897 | $1,245 | $1.39 | 43d | 1 | 1.20mi |
| 1307 Chadbourne St El Paso, TX | 2.0 | 1.0 | 700 | $1,200 | $1.71 | 43d | 1 | 1.21mi |
| 3030 Pera Ave Unit A El Paso, TX | 2.0 | 1.5 | 1050 | $1,350 | $1.29 | 43d | 1 | 1.22mi |
| 1226 Huckleberry St El Paso, TX | 2.0 | 1.0 | 700 | $995 | $1.42 | 43d | 1 | 1.23mi |
| 4012 Trowbridge Dr Unit A El Paso, TX | 2.0 | 1.0 | 1064 | $1,450 | $1.36 | 23d | 1 | 1.26mi |
| 1421 Saint Johns Dr Unit 2 El Paso, TX | 1.0 | 1.0 | 525 | $755 | $1.44 | 43d | 1 | 1.32mi |
| 6005 Tampa Ave El Paso, TX | 3.0 | 2.0 | 906 | $1,450 | $1.60 | 43d | 1 | 1.35mi |
| 3025 E Missouri Ave El Paso, TX | 2.0 | 1.0 | 1008 | $1,395 | $1.38 | 43d | 1 | 1.37mi |
| 4116 Chester Ave El Paso, TX | 3.0 | 1.0 | 1076 | $1,600 | $1.49 | 43d | 1 | 1.38mi |
| 3403 Pershing Dr #3 El Paso, TX | 2.0 | 1.0 | 850 | $995 | $1.17 | 23d | 1 | 1.41mi |
| 3505 Douglas Ave El Paso, TX | 2.0 | 1.0 | 1025 | $925 | $0.90 | 43d | 1 | 1.46mi |
Listing history 3 events
-
2026-03-31status Pending
-
2026-03-26historical Active Under Contract
-
2026-03-22$97,000 Active
ⓘ Source: listings_history table (triggers on properties + properties_extension) + one-shot
backfill from property_details.listing_events for pre-trigger history.
Tax reassessment forecast TX · Resets to sale price
- Current annual tax
- $2,361 · $197/mo
- Projected year-2 tax
- $2,361 · $197/mo
- Expected delta
- $0/yr ($0/mo · 0.0%)
ⓘ Screening estimate from a state-policy table — verify with the county assessor before closing.
Climate risk First Street
- Flood 1/10 Low FEMA zone X · 0% chance over 30 yrs
- Wildfire 1/10 Low
- Heat 6/10 Major 7 d/yr ≥102°F today · 26 d/yr by 30 yrs out
- Wind 1/10 Low
- Air quality 2/10 Low 1 unhealthy d/yr today · 2 by 30 yrs out
Nearby sold comps map
Loading sold comps map…
Walkable amenities ~0.75 mi
Loading nearby amenities…
Taxation est. · year 1
- Rental income
- $12,561
- − Mortgage interest
- −$5,434
- − Property taxes
- −$2,361
- − Insurance
- −$485
- − Repairs & maintenance
- −$1,005
- − Management
- −$1,005
- − Depreciation
- −$2,822
- Taxable loss
- −$550
- Est. tax savings @ 24.0%
- +$132
- After-tax cash flow
- $1,105/yr
For passive investors: Depreciation is non-cash, so a rental often shows a tax loss while cash-flowing — sheltering income. Rental losses are passive: they offset passive income freely, and up to $25,000/yr can offset ordinary (W-2) income if you actively participate and your MAGI is under $100k (phasing out to $0 by $150k); unused losses carry forward. On sale, claimed depreciation is recaptured at up to 25%, and gains may owe capital-gains tax (a 1031 exchange can defer both). Figures are a year-1 estimate at your 24.0% rate — not tax advice; consult a CPA.
Schools (NCES district)
- District
- El Paso ISD
- NCES district ID
- 4818300
- Math proficiency
- 27% ▼ -24.00%
- Reading proficiency
- 37% ▼ -7.00%
- Median HH income
- $38,704
- Composite
- 26.75/100
- National rank
- #7138
- State rank
- #591 of 826 in TX
Livability — El Paso
- Score
- 81/100
- State rank
- #23
- US rank
- #1375
Category grades
Schools grade is shown separately in the Schools card above.
Census & demographics
- Census place
- El Paso, TX
- City population
- 630,223
- Population (ZIP)
- 22,062
Population outlook (El Paso County) Hauer SSP2
- Today (2025)
- 897,899 people
- By 2030
- 922,694 · +2.8%
- By 2040
- 960,492 · +7.0%
- By 2050
- 982,919 · +9.5%
- By 2075
- 997,266 · +11.1%
- By 2100
- 900,630 · +0.3%
Race, ethnicity, and origin ACS 2023
- Neighborhood character
- Predominantly Hispanic (93%)
- Race & ethnicity
- Hispanic / Latino 93% Two or more races 50% White 2% Native American 1% Pacific Islander 1%
- Hispanic origin (detail)
- Mexican 89%
- Foreign-born
- 32% · Canada
- Languages at home
- 14% English-only · Spanish 86%
Political lean MEDSL · El Paso
- 2024 margin
- D (+15.1) · D 57.0% · R 41.8% · Other 1.2%
- 2008→2024 swing
- -17.4pp toward R · 2008: 32.5pp · 2024: 15.1pp
- All cycles
- 2024: D+15.1 2020: D+35.1 2016: D+43.2 2012: D+32.6 2008: D+32.5
Not yet ingested
- Civics
- —
Market trends
- HPI YoY
- ▲ 29.29%
- Current HPI
- 258.3487
- Rent YoY
- —
- Metro
- —
- State GDP YoY
- ▲ 3.95%
- F500 in state
- 110
Industry mix (Fortune 500 HQ in TX)
| Industry | F500 HQs | Revenue |
|---|---|---|
| Energy | 16 | $1,198B |
|
||
| Technology | 5 | $198B |
|
||
| Engineering / Construction | 4 | $72B |
|
||
| Energy Services | 3 | $60B |
|
||
| Utilities | 3 | $41B |
|
||
| Healthcare | 2 | $330B |
|
||
Price history
3 events — show timeline
- 2026-03-31 Pending — GEPARMLS
- 2026-03-26 Contingent — GEPARMLS
- 2026-03-22 Listed $97,000 GEPARMLS
Property tax history
+13.6%/yrLatest (2025): $2,361 · +22.2% YoY. Source: county tax records.
Cash-flow waterfall
monthlySold comps — $/sqft
last 12 mo · ≤1 miLoading sold comps…