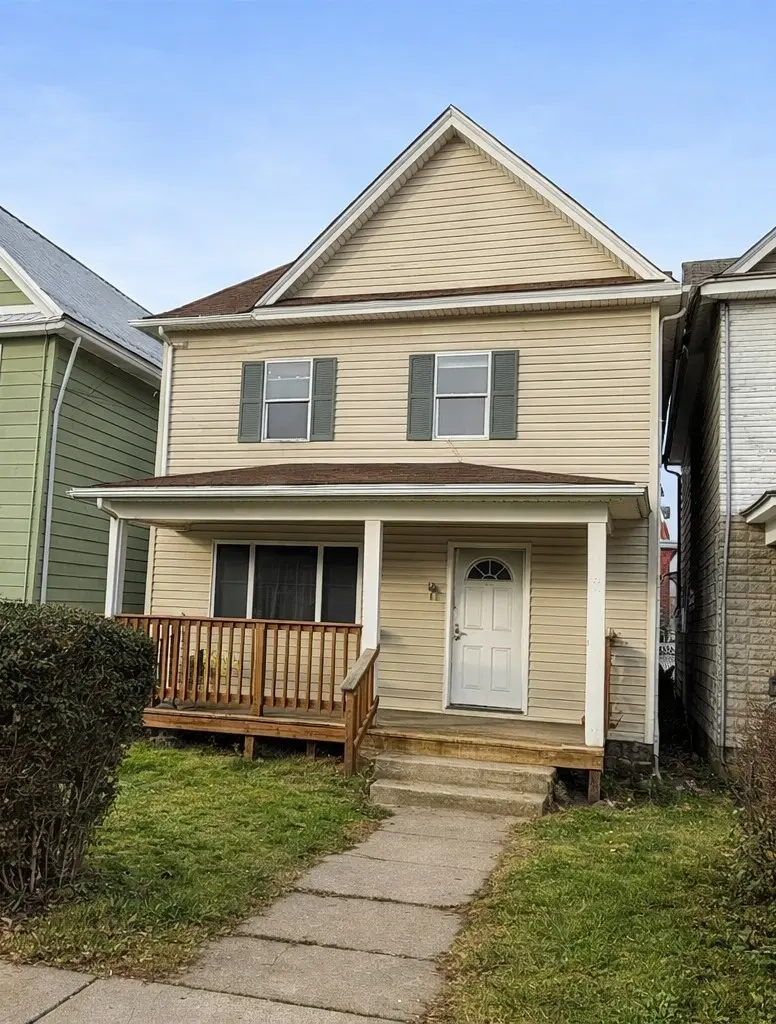
422 Negley Ave · Butler, PA
Flood risk 1/10 · Minimal
- FEMA flood zone
- X (unshaded)
- Chance of flooding over 30 yrs
- 0.0%
- Est. flood insurance / yr
- $473 – $860
Fire risk 1/10 · Minimal
- Est. fire insurance / yr
- $511 – $949
Heat risk 3/10 · Minor
- Hot days now (above 94°F)
- 7 days/yr
- Hot days in 30 yrs
- 18 days/yr
Wind risk 1/10 · Minimal
- Chance of severe wind over 30 yrs
- —
Air-quality risk 3/10 · Minor
- Unhealthy air days now
- 2 days/yr
- Unhealthy air days in 30 yrs
- 4 days/yr
Risk factors via First Street. Map © Google.
Why this score? — see what drove the D+ grade
The composite is a weighted blend of 9 inputs, each scored 0–100. Each bar is that input's sub-score; the figure is the points it added to the 100-point composite (weight × sub-score).
- Cash flow +17.6/30.0
- ARV discount +7.5/15.0
- DSCR +5.5/10.0
- Rent growth +5.0/5.0
- Schools +4.3/10.0
- 1% rule +4.0/10.0
- Livability +3.6/5.0
- Condition / age +2.5/5.0
- Appreciation +0.0/10.0
$121,500
🖨 Deal sheet 📄 Offer letter ✓ Due diligence
Listing remarks MLS
422 Negley Ave. in Butler, Pa is a charming two-story home located in a well-established neighborhood. This tenant-occupied property features 3 spacious bedrooms and 1 bathroom, offering a functional and comfortable layout. The home’s classic two-story design provides a welcoming feel with ample living space throughout. Its convenient location places it close to local amenities, schools, shopping, and major routes, making it appealing for both residents and investors alike. With steady tenancy already in place, this property presents a great opportunity for long-term value and appeal.
Key facts
- Major routes
- Convenient location
- Local amenities
Tags
Neighborhood map
What this means for you Summary
Snapshot
- This is a 3-bed/1.0-bath single-family listed at $122k.
Deal economics
- At list price, monthly cash flow is $97 ($1k/yr) — positive.
- The deal already cash-flows at list — no discount required.
- To meet the 1% rule (rent ≥ 1% of price), the offer needs to be $109k (10.5% below list).
- Recommended offer: $107k (12.0% below list) — sets the bar for market timing.
- Cap rate 7.2% vs local median 3.8% in Butler — top-decile yield for the area; either an underpriced asset or a hidden risk that comps aren't pricing in. Stress-test before assuming the spread holds.
Location & tenants
- Location reads 71/100 on livability (#705 in PA) — a middle-class / working-renter tenant base. Strengths: cost of living A+, health & safety A+, schools A-; Watch: crime D-, amenities F, commute F.
- Butler Area SD (town): math 41% / reading 59% proficiency, ranked #181 of 539 in PA (top 34%) — acceptable for families but not a draw, mixed tenant base, ~2y average lease.
- Market conditions: Rents rising fast (+20.4%/yr); 206 active listings in the ZIP; 9 comparable units currently listed for rent nearby; rentals at typical pace (median 17d on market — plan ~3-4 weeks tenant-placement turnaround); 987 units permitted in Butler County in 2024 (0 in 5+ unit buildings).
Forward outlook
- Local home prices are declining (-3.0%/yr); year-one equity from $840 of loan paydown is wiped out by about $4k of value loss. Plan a longer hold.
- Butler County population projected to shrink 5% by 2050 — rents likely to lag national; underwrite the cash flow, not the appreciation.
- At projected returns (-3.0% appreciation + 8.0% rent growth), your $34k cash investment doubles in ~10 years — after that, you're playing with house money.
Negotiation context
- It's been on market 171 days — a 12% lower offer ($107k) is reasonable based on typical stale-listing flexibility.
Risks & watch-outs
- Watch-outs: built in 1900 — expect roof / HVAC / electrical / plumbing capex.
Questions for the listing agent
- It's been on market 171 days. Have you received any prior offers? Is the seller open to a 12% concession, seller financing, or rate buy-down credit?
- Built in 1900 — when were the roof, HVAC, electrical panel, plumbing, and water heater last replaced?
- Why hasn't it sold? Are there any deal-killer items the seller is aware of (foundation, flood, title, zoning, code violations)?
- Is there a deadline driving the sale (1031 exchange, divorce, estate, relocation)? That informs how much negotiation room exists.
- Schools are A-rated — typically a magnet for longer-tenancy family renters. What's the average tenant stay here, and is there a school-zone premium baked into asking?
- Crime grade is D in this area — have there been break-ins, vandalism, or insurance claims at this property in the last 3 years? What carrier currently insures it and at what premium?
- The area grade is low — what's the realistic commute time and amenity access for the typical tenant pool here? Any planned neighborhood developments (good or bad) we should know about?
- What's the average days-on-market for RENTAL listings here right now (not sales)? A rising rental-DOM trend means longer vacancies and softer asking-rent achievability than the comps imply.
- What's the recent tenant-quality profile in this submarket — average credit score on applications, eviction rate, late-payment / NSF rate, and stable-employment percentage? A property-management company in the area should have these aggregated.
- How much new for-sale + rental construction is in the pipeline within 1–3 miles? Heavy new supply typically softens prices + rents 12–24 months out; constrained supply supports both.
Investment metrics
- 1% rule
- 0.90% ✗
- Cap rate
- 7.25%
- Cash-on-cash
- 3.41%
- DSCR
- 1.15
- GRM
- 9.3
CMA / ARV
- ARV (median comp)
- $73,935
- List price
- $121,500
- Delta
- 64.33%
- Verdict
- OVERPRICED
- Comps
- 20 within 1.0 mi
Show comp detail 12 sales within ~0.75 mi
| Address | Dist | Beds/Ba | Sqft | Sold | Price | $/sf | Match |
|---|---|---|---|---|---|---|---|
| 421 W Diamond St | 0.16mi | 3/1.5 | 1,367 (-1%) | 3mo | $135,000 | $99 | 86 |
| 514 S Washington St | 0.21mi | 3/2.0 | 1,320 (-4%) | 3mo | $82,400 | $62 | 76 |
| 100 Madison Ave | 0.21mi | 3/1.0 | 1,456 (+6%) | 9mo | $65,000 | $45 | 74 |
| 414 S Washington St | 0.23mi | 3/1.0 | 1,272 (-8%) | 4mo | $20,000 | $16 | 73 |
| 508 Negley Ave | 0.05mi | 4/2.0 (+1) | 1,255 (-9%) | 10mo | $97,335 | $78 | 66 |
| 401 New Castle St | 0.39mi | 3/2.0 | 1,548 (+12%) | 1mo | $119,900 | $77 | 57 |
| 515 W Brady St | 0.51mi | 3/1.0 | 1,210 (-12%) | 4mo | $83,000 | $69 | 52 |
| 208 American Ave | 0.68mi | 4/1.5 (+1) | 1,274 (-8%) | 4mo | $170,000 | $133 | 45 |
| 306 Hempfling St | 0.73mi | 3/1.0 | 1,240 (-10%) | 8mo | $110,300 | $89 | 43 |
| 206 8th Ave | 0.58mi | 3/2.5 | 1,560 (+13%) | 3mo | $210,000 | $135 | 42 |
| 8 Bredin Ave | 0.56mi | 4/2.0 (+1) | 1,520 (+10%) | 7mo | $250,000 | $164 | 42 |
| 310 American Ave | 0.75mi | 3/1.0 | 1,186 (-14%) | 9mo | $126,000 | $106 | 35 |
Match score weights: distance 35% · size 25% · config 20% · recency 20%. Top-matched comps best support the ARV.
Projected returns pro-forma
-3.0% appreciation · 8.0% rent growth · sell at horizon
- IRR
- -5.9%
- Equity multiple
- 0.77×
- Total profit
- $-7,815
- Equity at exit
- $18,116
- IRR
- 8.6%
- Equity multiple
- 1.80×
- Total profit
- $27,157
- Equity at exit
- $10,505
Cash invested: $34,020 (down + closing). Projections, not guarantees.
Landlord ↔ Tenant lean methodology
- Overall (STATE)
- 62 Landlord-Friendly
- State Pennsylvania
- 62 Landlord-Friendly · EVEN
- County
- — inherits STATE
- City
- — inherits STATE
ZIP-level market 16001
- Home prices YoY
- -31.7%
- Rents YoY
- 20.4%
- Active inventory
- 206
- Price-to-rent
- 9.3×
Monthly cashflow live
- Estimated rent
- $1,088 high interval (Pro) →
- Mortgage (P&I)
- −$637
- Tax from tax record
- −$75 /mo · $897/yr
- Insurance
- −$51
- HOA
- −$0
- Vacancy / Maint / Mgmt
- −$228
- Net cashflow
- $97
Break-even live
UW: 25.0% down · 7.5% · 30yr · 1.5% tax · 5.0% vac · 8.0% maint · 8.0% mgmt
Financing live
Cash to close
- Down payment
- $30,375
- Closing costs
- $3,645
- Reserves months
- —
- Total cash needed
- —
Loan-product check · same deal, 3 products live
Conventional
25% down · 7.5% · 30yr
- Down + closing
- —
- Monthly P&I
- —
- Monthly cashflow
- —
- DSCR
- —
- Eligible?
- —
Personal DTI + credit; lowest rate.
DSCR
20% down · 8.5% · 30yr
- Down + closing
- —
- Monthly P&I
- —
- Monthly cashflow
- —
- DSCR
- —
- Eligible?
- —
No personal income docs; deal must DSCR.
Hard money
10% down · 12.0% · 12mo
- Down + closing
- —
- Monthly P&I
- —
- Monthly cashflow
- —
- DSCR
- —
- Eligible?
- —
Short-term bridge; refi at stabilization.
Rent comps 9 comps
| Address | Beds | Baths | Sqft | Rent | $/sqft | DOM | Units | Dist |
|---|---|---|---|---|---|---|---|---|
| 327 W Brady St Unit 2 Butler, PA | 2.0 | 1.0 | 900 | $850 | $0.94 | 21d | 1 | 0.51mi |
| 303 Wilson Ave Unit Wilson-313 Butler, PA | 3.0 | 1.0 | 894 | $1,005 | $1.12 | 16d | 1 | 0.54mi |
| 313 Wilson Ave Butler, PA | 3.0 | 1.0 | 894 | $1,005 | $1.12 | 16d | 1 | 0.56mi |
| 415 Brown Ave Butler, PA | 3.0 | 2.5 | 1640 | $1,500 | $0.91 | 12d | 1 | 0.68mi |
| 529 Federal St Unit 2 Butler, PA | 2.0 | 1.0 | 900 | $850 | $0.94 | 43d | 1 | 0.68mi |
| 208 E Walnut St Butler, PA | 3.0 | 1.5 | 1297 | $1,050 | $0.81 | 23d | 1 | 0.72mi |
| 305 American Ave Butler, PA | 2.0 | 1.0 | 986 | $995 | $1.01 | 43d | 1 | 0.74mi |
| 530 N Main St Butler, PA | 2.0 | 2.0 | 1052 | $1,088 | $1.03 | 1d | 2 | 0.92mi |
| 206 Litman Rd Butler, PA | 1.0–2.0 | 1.0 | 800 | $1,170 | $1.46 | 1d | 3 | 1.05mi |
Listing history 15 events
-
2026-06-18days on market $121,500 Active 171 DOM
-
2026-06-17days on market $121,500 Active 170 DOM
-
2026-06-16days on market $121,500 Active 169 DOM
-
2026-06-15days on market $121,500 Active 168 DOM
-
2026-06-13days on market $121,500 Active 166 DOM
-
2026-06-13days on market $121,500 Active 165 DOM
-
2026-06-09days on market $121,500 Active 162 DOM
-
2026-06-08days on market $121,500 Active 161 DOM
-
2026-06-07days on market $121,500 Active 160 DOM
-
2026-06-03days on market $121,500 Active 156 DOM
-
2026-06-02days on market $121,500 Active 155 DOM
-
2026-06-01days on market $121,500 Active 154 DOM
-
2026-05-31days on market $121,500 Active 153 DOM
-
2026-03-18price $121,500 597-char remark
Show marketing remark (597 chars)
422 Negley Ave. in Butler, Pa is a charming two-story home located in a well-established neighborhood. This tenant-occupied property features 3 spacious bedrooms and 1 bathroom, offering a functional and comfortable layout. The home’s classic two-story design provides a welcoming feel with ample living space throughout. Its convenient location places it close to local amenities, schools, shopping, and major routes, making it appealing for both residents and investors alike. With steady tenancy already in place, this property presents a great opportunity for long-term value and appeal.
-
2025-12-28$135,000 Active 597-char remark
Show marketing remark (597 chars)
422 Negley Ave. in Butler, Pa is a charming two-story home located in a well-established neighborhood. This tenant-occupied property features 3 spacious bedrooms and 1 bathroom, offering a functional and comfortable layout. The home’s classic two-story design provides a welcoming feel with ample living space throughout. Its convenient location places it close to local amenities, schools, shopping, and major routes, making it appealing for both residents and investors alike. With steady tenancy already in place, this property presents a great opportunity for long-term value and appeal.
ⓘ Source: listings_history table (triggers on properties + properties_extension) + one-shot
backfill from property_details.listing_events for pre-trigger history.
Tax reassessment forecast PA · Partial reset (capped growth)
- Current annual tax
- $897 · $75/mo
- Projected year-2 tax
- $1,408 · $117/mo
- Expected delta
- +$511/yr (+$43/mo · 57.0%)
ⓘ Screening estimate from a state-policy table — verify with the county assessor before closing.
Climate risk First Street
- Flood 1/10 Low FEMA zone X (unshaded) · 0% chance over 30 yrs
- Wildfire 1/10 Low
- Heat 3/10 Moderate 7 d/yr ≥94°F today · 18 d/yr by 30 yrs out
- Wind 1/10 Low
- Air quality 3/10 Moderate 2 unhealthy d/yr today · 4 by 30 yrs out
Nearby sold comps map
Loading sold comps map…
Walkable amenities ~0.75 mi
Loading nearby amenities…
Taxation est. · year 1
- Rental income
- $13,051
- − Mortgage interest
- −$6,806
- − Property taxes
- −$897
- − Insurance
- −$608
- − Repairs & maintenance
- −$1,044
- − Management
- −$1,044
- − Depreciation
- −$3,535
- Taxable loss
- −$882
- Est. tax savings @ 24.0%
- +$212
- After-tax cash flow
- $1,372/yr
For passive investors: Depreciation is non-cash, so a rental often shows a tax loss while cash-flowing — sheltering income. Rental losses are passive: they offset passive income freely, and up to $25,000/yr can offset ordinary (W-2) income if you actively participate and your MAGI is under $100k (phasing out to $0 by $150k); unused losses carry forward. On sale, claimed depreciation is recaptured at up to 25%, and gains may owe capital-gains tax (a 1031 exchange can defer both). Figures are a year-1 estimate at your 24.0% rate — not tax advice; consult a CPA.
Schools (NCES district)
- District
- Butler Area SD
- NCES district ID
- 4204590
- Math proficiency
- 41% ▼ -11.00%
- Reading proficiency
- 59% ▼ -10.00%
- Median HH income
- $49,348
- Composite
- 42.65/100
- National rank
- #3180
- State rank
- #181 of 539 in PA
Livability — Butler
- Score
- 71/100
- State rank
- #705
- US rank
- #6951
Category grades
Schools grade is shown separately in the Schools card above.
Census & demographics
- Census place
- Butler, PA
- County
- Butler County · 73,107 people
- City population
- 39,234
- Metro
- Pittsburgh, PA
- Population (ZIP)
- 39,234
- Household income
- $63,635
- Rent vs Own
- Severe rent burden
- 1441.0
Population outlook (Butler County) Hauer SSP2
- Today (2025)
- 190,777 people
- By 2030
- 191,476 · +0.4%
- By 2040
- 189,474 · -0.7%
- By 2050
- 182,050 · -4.6%
- By 2075
- 159,526 · -16.4%
- By 2100
- 129,028 · -32.4%
Race, ethnicity, and origin ACS 2023
- Neighborhood character
- Predominantly White (92%)
- Race & ethnicity
- White 92% Two or more races 4% Hispanic / Latino 2% Black 1%
- Common ancestry
- Romanian 8% Serbian 4% Slovak 2%
- Foreign-born
- 1% · Canada
- Languages at home
- 98% English-only · Spanish 1%
Political lean MEDSL · Butler
- 2024 margin
- Solid R (+32.2) · D 33.5% · R 65.7%
- 2008→2024 swing
- -4.8pp toward R · 2008: -27.4pp · 2024: -32.2pp
- All cycles
- 2024: R+32.2 2020: R+32.5 2016: R+37.5 2012: R+34.9 2008: R+27.4
Not yet ingested
- Civics
- —
Market trends
- HPI YoY
- ▼ -103.40%
- Current HPI
- 222.4445
- Rent YoY
- ▲ 20.36%
- Metro
- Pittsburgh, PA
- State GDP YoY
- ▲ 1.68%
- F500 in state
- 34
Industry mix (Fortune 500 HQ in PA)
| Industry | F500 HQs | Revenue |
|---|---|---|
| Healthcare | 2 | $309B |
|
||
| Insurance | 2 | $27B |
|
||
| Telecommunications / Media | 1 | $124B |
|
||
| Industrial Distribution | 1 | $22B |
|
||
| Financial Services | 1 | $20B |
|
||
| Chemicals / Materials | 1 | $18B |
|
||
Price history
-10.0% since first listed2 events — show timeline
- 2026-03-18 Price Changed $121,500 West Penn MLS
- 2025-12-28 Listed $135,000 West Penn MLS
Property tax history
+0.8%/yrLatest (2026): $897 · -6.3% YoY. Source: county tax records.
Cash-flow waterfall
monthlySold comps — $/sqft
last 12 mo · ≤1 miLoading sold comps…