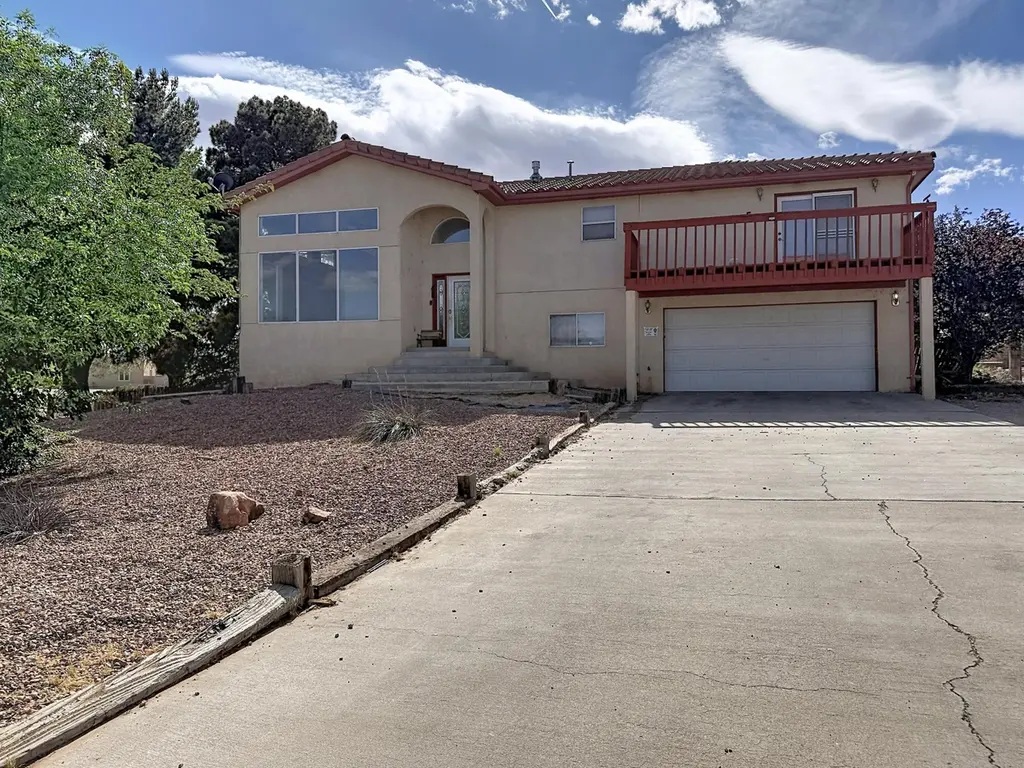
1390 Mesa Ridge Dr SW · Los Lunas, NM
Flood risk 1/10 · Minimal
- FEMA flood zone
- X (unshaded)
- Chance of flooding over 30 yrs
- 0.0%
- Est. flood insurance / yr
- $507 – $1,088
Fire risk 5/10 · Moderate
- Est. fire insurance / yr
- $706 – $1,312
Heat risk 5/10 · Moderate
- Hot days now (above 97°F)
- 7 days/yr
- Hot days in 30 yrs
- 19 days/yr
Wind risk 1/10 · Minimal
- Chance of severe wind over 30 yrs
- —
Air-quality risk 2/10 · Minimal
- Unhealthy air days now
- 1 days/yr
- Unhealthy air days in 30 yrs
- 1 days/yr
Risk factors via First Street. Map © Google.
Why this score? — see what drove the D grade
The composite is a weighted blend of 9 inputs, each scored 0–100. Each bar is that input's sub-score; the figure is the points it added to the 100-point composite (weight × sub-score).
- ARV discount +15.0/15.0
- Cash flow +7.9/30.0
- Rent growth +5.0/5.0
- Livability +3.3/5.0
- Schools +2.6/10.0
- Condition / age +2.5/5.0
- DSCR +2.0/10.0
- 1% rule +1.9/10.0
- Appreciation +0.0/10.0
$345,000
🖨 Deal sheet 📄 Offer letter ✓ Due diligence
Listing remarks
Located in the heart of Los Lunas in the sought-after Valley View neighborhood, this half-acre property offers over 2,500 sq ft with 3-4 bedrooms. Situated at the end of a cul-de-sac, it features backyard access, no HOA, and plenty of space to create your ideal outdoor setup. .. think pool, entertaining area, or expanded living space. Enjoy beautiful views and quick access to Main Street and I-25. Home is being sold as-is and offers a great opportunity for investors, flippers, or buyers looking to personalize and add value over time.
Key facts
- 0.5 acre lot
- 2 garage spots
- Built 1992
Property features AI
Exterior
- Parking: Attached garage with RV access/parking; 2 garage spaces
- Utilities: Electricity connected; Natural gas connected; Public water; Public sewer
- Home design: Two-story residence; Resale property; Faces east; R-1 zoning
- Construction: Frame and stucco construction; Pitched tile roof
- Exterior features: Balcony; Covered and open patio; Private yard; Property boasts views; Located on a cul-de-sac
Interior
- Kitchen: Dishwasher; Free-standing gas range; Refrigerator; Breakfast area adjacent to kitchen
- Bedrooms: Up to 4 bedrooms possible; Sitting room located on upper level
- Flooring: Carpet; Laminate; Tile
- Bathrooms: 3 full bathrooms
- Heating & cooling: Central heating (forced air, natural gas); Evaporative cooling (multiple units)
- Interior features: Breakfast area; Bathtub; Ceiling fan(s); Family/Dining room; Living/Dining room; Multiple living areas; Sitting area in master; Soaking tub; Separate shower; Double pane and insulated windows; Gas-log fireplace with glass doors (1 fireplace)
- Laundry & utility: Washer hookup; Electric dryer hookup; Gas dryer hookup
Neighborhood map
What this means for you Summary
Snapshot
- This is a 3-bed/3.0-bath other listed at $345k.
Deal economics
- At list price, monthly cash flow is $-367 ($-4k/yr) — negative.
- To cash-flow at today's rent, offer at most $280k (18.8% below list).
- To meet the 1% rule (rent ≥ 1% of price), the offer needs to be $237k (31.4% below list).
- Recommended offer: $237k (31.4% below list) — sets the bar for 1% rule.
- Cap rate 5.0% vs local median 3.8% in Los Lunas — top-decile yield for the area; either an underpriced asset or a hidden risk that comps aren't pricing in. Stress-test before assuming the spread holds.
Location & tenants
- Location reads 66/100 on livability (#46 in NM) — a middle-class / working-renter tenant base. Strengths: cost of living A+, housing A+; Watch: schools F, crime F, amenities F.
- Los Lunas Public Schools (suburban): math 20% / reading 34% proficiency, ranked #34 of 95 in NM (top 36%) — low school quality limits family demand, transient renter base, plan for 1-2y turnover; 63% free/reduced lunch — lower-income household profile, screen leases tightly.
- Market conditions: Rents rising fast (+33.2%/yr); 562 active listings in the ZIP; 3 comparable units currently listed for rent nearby; rentals lingering (median 44d on market — plan ~5-8 weeks vacancy on turnover, expect pricing pressure); 100% of comp listings sitting > 30 days — soft ceiling on asking rent; 303 units permitted in Valencia County in 2024 (0 in 5+ unit buildings).
- At $2,365/mo this rent would consume 47% of the median local household income ($61k/yr) (locally 602% of renters already pay >50% of income on rent) — very limited rent-growth headroom before tenants either downsize or default.
Forward outlook
- Local home prices are declining (-3.0%/yr); year-one equity from $2k of loan paydown is wiped out by about $10k of value loss. Plan a longer hold.
- Valencia County population projected at -14% by 2050 — secular population decline; favor cash flow + early exit over multi-decade hold.
Negotiation context
- It's been on market 38 days — a 3% lower offer ($335k) is reasonable based on typical stale-listing flexibility.
- 3 sale attempts since 9y ago with the ask held roughly flat each time — persistent listings suggest the price (not the market) is what's stuck; bring a comps-based counter.
Risks & watch-outs
- Climate carrying-cost: moderate wildfire risk; extreme-heat days projected 7→19/yr by 2055 (HVAC capex compounding) — expect insurance premiums to compound above CPI over the hold.
Questions for the listing agent
- What do current leases actually rent for vs. the listed asking? Can we see a recent rent roll and the last 12 months of T-12 income?
- It's been on market 38 days. Have you received any prior offers? Is the seller open to a 31% concession, seller financing, or rate buy-down credit?
- Is there a deadline driving the sale (1031 exchange, divorce, estate, relocation)? That informs how much negotiation room exists.
- Schools are F-rated, which usually means shorter tenancies and higher turnover. Who's the typical renter profile here, and what's been the actual vacancy rate?
- Crime grade is F in this area — have there been break-ins, vandalism, or insurance claims at this property in the last 3 years? What carrier currently insures it and at what premium?
- The area grade is low — what's the realistic commute time and amenity access for the typical tenant pool here? Any planned neighborhood developments (good or bad) we should know about?
- What's the average days-on-market for RENTAL listings here right now (not sales)? A rising rental-DOM trend means longer vacancies and softer asking-rent achievability than the comps imply.
- What's the recent tenant-quality profile in this submarket — average credit score on applications, eviction rate, late-payment / NSF rate, and stable-employment percentage? A property-management company in the area should have these aggregated.
- How much new for-sale + rental construction is in the pipeline within 1–3 miles? Heavy new supply typically softens prices + rents 12–24 months out; constrained supply supports both.
Investment metrics
- 1% rule
- 0.69% ✗
- Cap rate
- 5.02%
- Cash-on-cash
- -4.56%
- DSCR
- 0.80
- GRM
- 12.2
CMA / ARV
- ARV (median comp)
- $447,672
- List price
- $345,000
- Delta
- -22.93%
- Verdict
- UNDERPRICED
- Comps
- 20 within 1.0 mi
Projected returns pro-forma
-3.0% appreciation · 8.0% rent growth · sell at horizon
- IRR
- -19.0%
- Equity multiple
- 0.31×
- Total profit
- $-66,815
- Equity at exit
- $51,441
- IRR
- -4.1%
- Equity multiple
- 0.67×
- Total profit
- $-31,584
- Equity at exit
- $29,829
Cash invested: $96,600 (down + closing). Projections, not guarantees.
Landlord ↔ Tenant lean methodology
- Overall (STATE)
- 55 Moderately Landlord-Leaning
- State New Mexico
- 55 Moderately Landlord-Leaning · D+3
- County
- — inherits STATE
- City
- — inherits STATE
ZIP-level market 87031
- Home prices YoY
- -29.8%
- Rents YoY
- 33.2%
- Active inventory
- 562
- Price-to-rent
- 12.2×
Monthly cashflow live
- Estimated rent
- $2,365 medium interval (Pro) →
- Mortgage (P&I)
- −$1,809
- Tax from tax record
- −$282 /mo · $3,389/yr
- Insurance
- −$144
- HOA
- −$0
- Vacancy / Maint / Mgmt
- −$497
- Net cashflow
- $-367
Break-even live
UW: 25.0% down · 7.5% · 30yr · 1.5% tax · 5.0% vac · 8.0% maint · 8.0% mgmt
Financing live
Cash to close
- Down payment
- $86,250
- Closing costs
- $10,350
- Reserves months
- —
- Total cash needed
- —
Loan-product check · same deal, 3 products live
Conventional
25% down · 7.5% · 30yr
- Down + closing
- —
- Monthly P&I
- —
- Monthly cashflow
- —
- DSCR
- —
- Eligible?
- —
Personal DTI + credit; lowest rate.
DSCR
20% down · 8.5% · 30yr
- Down + closing
- —
- Monthly P&I
- —
- Monthly cashflow
- —
- DSCR
- —
- Eligible?
- —
No personal income docs; deal must DSCR.
Hard money
10% down · 12.0% · 12mo
- Down + closing
- —
- Monthly P&I
- —
- Monthly cashflow
- —
- DSCR
- —
- Eligible?
- —
Short-term bridge; refi at stabilization.
Rent comps 3 comps
| Address | Beds | Baths | Sqft | Rent | $/sqft | DOM | Units | Dist |
|---|---|---|---|---|---|---|---|---|
| 1831 Camino Cantera SW Los Lunas, NM | 3.0 | 2.0 | 1794 | $2,495 | $1.39 | 43d | 1 | 0.77mi |
| 2870 Desert Sage Ave SW Los Lunas, NM | 3.0 | 2.5 | 2575 | $2,250 | $0.87 | 43d | 1 | 1.09mi |
| 750 Deer Brush Ct SW Los Lunas, NM | 3.0 | 2.5 | 2330 | $2,000 | $0.86 | 43d | 1 | 1.19mi |
Listing history 15 events
-
2026-06-03status $345,000 Pending 38 DOM
-
2026-06-02days on market $345,000 Active 38 DOM
-
2026-06-01days on market $345,000 Active 37 DOM
-
2026-05-31days on market $345,000 Active 36 DOM
-
2026-05-12price $345,000 539-char remark
-
2026-04-15$355,000 Active 539-char remark
-
2017-09-29historical
-
2017-09-29soldstatus
-
2017-08-16status Pending
-
2017-08-10price $225,000
-
2017-07-21price $229,000
-
2017-07-20status Active
-
2017-05-19status Pending
-
2017-05-15$250,000 Active
-
2006-08-01soldstatus
ⓘ Source: listings_history table (triggers on properties + properties_extension) + one-shot
backfill from property_details.listing_events for pre-trigger history.
Tax reassessment forecast NM · Resets to sale price
- Current annual tax
- $3,389 · $282/mo
- Projected year-2 tax
- $3,389 · $282/mo
- Expected delta
- $0/yr ($0/mo · 0.0%)
ⓘ Screening estimate from a state-policy table — verify with the county assessor before closing.
Climate risk First Street
- Flood 1/10 Low FEMA zone X (unshaded) · 0% chance over 30 yrs
- Wildfire 5/10 Major
- Heat 5/10 Major 7 d/yr ≥97°F today · 19 d/yr by 30 yrs out
- Wind 1/10 Low
- Air quality 2/10 Low 1 unhealthy d/yr today · 1 by 30 yrs out
Nearby sold comps map
Loading sold comps map…
Walkable amenities ~0.75 mi
Loading nearby amenities…
Taxation est. · year 1
- Rental income
- $28,385
- − Mortgage interest
- −$19,325
- − Property taxes
- −$3,389
- − Insurance
- −$1,725
- − Repairs & maintenance
- −$2,271
- − Management
- −$2,271
- − Depreciation
- −$10,036
- Taxable loss
- −$10,632
- Est. tax savings @ 24.0%
- +$2,552
- After-tax cash flow
- $-1,849/yr
For passive investors: Depreciation is non-cash, so a rental often shows a tax loss while cash-flowing — sheltering income. Rental losses are passive: they offset passive income freely, and up to $25,000/yr can offset ordinary (W-2) income if you actively participate and your MAGI is under $100k (phasing out to $0 by $150k); unused losses carry forward. On sale, claimed depreciation is recaptured at up to 25%, and gains may owe capital-gains tax (a 1031 exchange can defer both). Figures are a year-1 estimate at your 24.0% rate — not tax advice; consult a CPA.
Schools (NCES district)
- District
- Los Lunas Public Schools
- NCES district ID
- 3501680
- Math proficiency
- 20% —
- Reading proficiency
- 34% —
- Median HH income
- $44,438
- Composite
- 26.11/100
- National rank
- #12724
- State rank
- #34 of 95 in NM
Livability — Los Lunas
- Score
- 66/100
- State rank
- #46
- US rank
- #12347
Category grades
Schools grade is shown separately in the Schools card above.
Census & demographics
- Census place
- Los Lunas, NM
- County
- Valencia County · 68,779 people
- City population
- 47,514
- Metro
- Albuquerque, NM
- Population (ZIP)
- 47,514
- Household income
- $60,902
- Rent vs Own
- Severe rent burden
- 602.0
Population outlook (Valencia County) Hauer SSP2
- Today (2025)
- 73,788 people
- By 2030
- 72,101 · -2.3%
- By 2040
- 67,930 · -7.9%
- By 2050
- 63,191 · -14.4%
- By 2075
- 53,644 · -27.3%
- By 2100
- 40,882 · -44.6%
Race, ethnicity, and origin ACS 2023
- Neighborhood character
- Majority Hispanic (63%)
- Race & ethnicity
- Hispanic / Latino 63% White 30% Two or more races 29% Native American 4% Black 1%
- Hispanic origin (detail)
- Mexican 38%
- Common ancestry
- Serbian 1% Russian 1% Slovak 1%
- Foreign-born
- 8% · Canada
- Languages at home
- 71% English-only · Spanish 27%
Political lean MEDSL · Valencia
- 2024 margin
- R (+16.4) · D 40.9% · R 57.3% · Other 1.8%
- 2008→2024 swing
- -24.1pp toward R · 2008: 7.7pp · 2024: -16.4pp
- All cycles
- 2024: R+16.4 2020: R+9.6 2016: R+8.7 2012: D+2.5 2008: D+7.7
Not yet ingested
- Civics
- —
Market trends
- HPI YoY
- ▼ -85.17%
- Current HPI
- 201.0508
- Rent YoY
- ▲ 33.16%
- Metro
- Albuquerque, NM
- State GDP YoY
- —
- F500 in state
- 0
Price history
+38.0% since first listed13 events — show timeline
- 2026-06-15 Sold (MLS) — Southwest MLS
- 2026-06-02 Pending — Southwest MLS
- 2026-05-12 Price Changed $345,000 Southwest MLS
- 2026-04-15 Listed $355,000 Southwest MLS
- 2017-09-29 Delisted — Southwest MLS
- 2017-09-29 Sold (Public Records) — Public Records
- 2017-08-16 Pending — Southwest MLS
- 2017-08-10 Price Changed $225,000 Southwest MLS
- 2017-07-21 Price Changed $229,000 Southwest MLS
- 2017-07-20 Relisted — Southwest MLS
- 2017-05-19 Pending — Southwest MLS
- 2017-05-15 Listed $250,000 Southwest MLS
- 2006-08-01 Sold (Public Records) — Public Records
Property tax history
+3.9%/yrLatest (2025): $3,389 · +21.5% YoY. Source: county tax records.
Cash-flow waterfall
monthlySold comps — $/sqft
last 12 mo · ≤1 miLoading sold comps…