 🏷️ Likely Rental
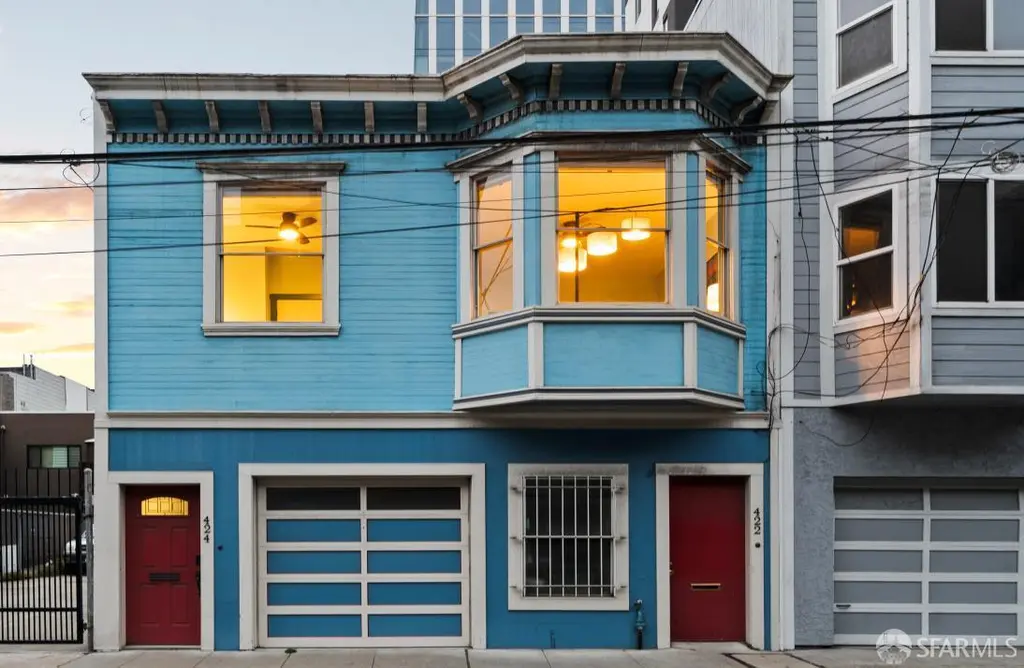
422-424 Tehama St · San Francisco, CA
Flood risk 1/10 · Minimal
- FEMA flood zone
- X (unshaded)
- Chance of flooding over 30 yrs
- 0.0%
- Est. flood insurance / yr
- $507 – $1,088
Fire risk 1/10 · Minimal
- Est. fire insurance / yr
- $659 – $1,223
Heat risk 2/10 · Minimal
- Hot days now (above 79°F)
- 8 days/yr
- Hot days in 30 yrs
- 17 days/yr
Wind risk 1/10 · Minimal
- Chance of severe wind over 30 yrs
- —
Air-quality risk 8/10 · Major
- Unhealthy air days now
- 15 days/yr
- Unhealthy air days in 30 yrs
- 15 days/yr
Risk factors via First Street. Map © Google.
Why this score? — see what drove the C- grade
The composite is a weighted blend of 9 inputs, each scored 0–100. Each bar is that input's sub-score; the figure is the points it added to the 100-point composite (weight × sub-score).
- ARV discount +15.0/15.0
- Cash flow +10.5/30.0
- Appreciation +7.5/10.0
- Rent growth +5.0/5.0
- Schools +5.0/10.0
- Livability +3.8/5.0
- DSCR +3.0/10.0
- 1% rule +2.5/10.0
- Condition / age +2.5/5.0
$945,000
🖨 Deal sheet (PDF) 📄 Offer letter ✓ Due diligence
Multi-family units
County records classify this as Multi-Family (5+ Unit). Listing-text estimate: 1 unit. estimate disagrees with records
5+ unit building — per-unit beds/baths from public records are typically unavailable; the breakdown below (if shown) is an estimate from the listing text.
Listing remarks MLS
Price reduced $50K and TRANSPARENT! Built in 1906 as a flat-over-store in SoMa's post-quake rebuild, 422-424 Tehama sits within one of San Francisco's fastest-evolving corridors shaped by AI, tech, and creative office users. The upper level offers a three-bedroom flat with eat-in kitchen and full bath. The lower level is separately accessed and includes a kitchen, bath, and additional rooms. An accessory rear structure is currently used as a music studio and is not represented as permitted living space. RSD zoning allows a range of residential, live/work, and commercial uses. The 3R Report reflects legal use as a one-family dwelling with commercial, may offer potential pathways for future repositioning, including single-family conversion subject to Planning and DBI approval. Currently tenant occupied, the property offers immediate income with potential for investors, developers, or future owner-users. Property records differ from current configuration; buyers are advised to review disclosures and independently verify legal use, square footage, layout, conversion potential, and tenancy rights with appropriate professionals. Central location with access to downtown, transit, and major commuter routes.
Key facts
- Access to downtown
- Central location
- Music studio
Tags
Property features AI
Finance
- HOA & community: No association fee
Exterior
- Utilities: Lot elevation approximately 0 feet
- Home design: Single family residence; Residential property; Built in 1906
- Construction: Approximately 1,957 total building square feet
- Exterior features: Ground-level entry
Interior
- Bedrooms: 3 bedrooms
- Bathrooms: 2 full bathrooms
- Interior features: Graphic artist source for living area
Neighborhood map
What this means for you Summary
Snapshot
- This is a 5-bed/3.0-bath multifamily listed at $945k.
Deal economics
- At list price, monthly cash flow is $-476 ($-6k/yr) — negative.
- To cash-flow at today's rent, offer at most $861k (8.9% below list).
- To meet the 1% rule (rent ≥ 1% of price), the offer needs to be $713k (24.5% below list).
- Recommended offer: $713k (24.5% below list) — sets the bar for 1% rule.
- Cap rate 5.7% vs local median 2.1% in San Francisco — top-decile yield for the area; either an underpriced asset or a hidden risk that comps aren't pricing in. Stress-test before assuming the spread holds.
Location & tenants
- Location reads 76/100 on livability (#90 in CA, #3,143 nationally) — a middle-class / working-renter tenant base. Strengths: amenities A+, commute A+, employment A+; Watch: crime F, cost of living F.
- San Francisco Unified (urban): math 50% / reading 56% proficiency, ranked #322 of 1,400 in CA (top 23%) — acceptable for families but not a draw, mixed tenant base, ~2y average lease.
- Zoned schools: Lilienthal (Claire) Elementary (669 students, 19% FRL); Giannini (A.P.) Middle (1,192 students, 34% FRL); Lowell High (2,632 students, 37% FRL) — zoned schools average 30% FRL vs 49% district-wide (19 pts lower); this property's tenant base skews higher-income than the district average.
- Market conditions: Rents rising fast (+15.5%/yr); 113 active listings in the ZIP; 3 comparable units currently listed for rent nearby; rentals at typical pace (median 17d on market — plan ~3-4 weeks tenant-placement turnaround); high-income renter base; 750 units permitted in San Francisco County in 2024 (688 in 5+ unit buildings).
- At $7,134/mo this rent would consume 74% of the median local household income ($116k/yr) (locally 2666% of renters already pay >50% of income on rent) — very limited rent-growth headroom before tenants either downsize or default.
Forward outlook
- In year one you build about $53k of equity ($7k loan paydown + $47k appreciation (5.0% local appreciation)).
- San Francisco County population projected at +39% by 2050 — long-run rental-demand tailwind backs the buy-and-hold thesis.
- By year 2, paydown + projected appreciation supports a ~$86k cash-out refi (75% LTV) — recoverable capital for the next deal without selling this one.
Negotiation context
- It's been on market 50 days — a 3% lower offer ($917k) is reasonable based on typical stale-listing flexibility.
- 2 sale attempts; this cycle's ask has dropped $50k (5%) from the opening price — seller is motivated, your offer sets the floor, not the list.
Risks & watch-outs
- Watch-outs: built in 1906 — expect roof / HVAC / electrical / plumbing capex.
Questions for the listing agent
- What do current leases actually rent for vs. the listed asking? Can we see a recent rent roll and the last 12 months of T-12 income?
- It's been on market 50 days. Have you received any prior offers? Is the seller open to a 25% concession, seller financing, or rate buy-down credit?
- Built in 1906 — when were the roof, HVAC, electrical panel, plumbing, and water heater last replaced?
- Is there a deadline driving the sale (1031 exchange, divorce, estate, relocation)? That informs how much negotiation room exists.
- Schools are B-rated — typically a magnet for longer-tenancy family renters. What's the average tenant stay here, and is there a school-zone premium baked into asking?
- Crime grade is F in this area — have there been break-ins, vandalism, or insurance claims at this property in the last 3 years? What carrier currently insures it and at what premium?
- What's the average days-on-market for RENTAL listings here right now (not sales)? A rising rental-DOM trend means longer vacancies and softer asking-rent achievability than the comps imply.
- What's the recent tenant-quality profile in this submarket — average credit score on applications, eviction rate, late-payment / NSF rate, and stable-employment percentage? A property-management company in the area should have these aggregated.
- How much new apartment / multifamily construction is in the pipeline within 1–3 miles? Heavy new supply (>2% of stock underway) typically softens rents 12–24 months out; light construction supports rent growth.
Investment metrics
- 1% rule
- 0.75% ✗
- Cap rate
- 5.69%
- Cash-on-cash
- -2.16%
- DSCR
- 0.90
- GRM
- 11.0
CMA / ARV
- ARV (median comp)
- $1,466,480
- List price
- $945,000
- Delta
- -35.56%
- Verdict
- UNDERPRICED
- Comps
- 16 within 1.0 mi
Projected returns pro-forma
4.96% appreciation · 8.0% rent growth · sell at horizon
- IRR
- 13.0%
- Equity multiple
- 1.84×
- Total profit
- $223,006
- Equity at exit
- $533,367
- IRR
- 15.7%
- Equity multiple
- 3.99×
- Total profit
- $791,696
- Equity at exit
- $918,745
Cash invested: $264,600 (down + closing). Projections, not guarantees.
Landlord ↔ Tenant lean methodology
- Overall (CITY)
- 0 Strongly Tenant-Friendly
- State California
- 18 Strongly Tenant-Friendly · D+13
- County
- — inherits STATE
- City San Francisco
- 0 Strongly Tenant-Friendly · D+57
ZIP-level market 94103
- Home prices YoY
- 2.9%
- Rents YoY
- 15.5%
- Active inventory
- 113
- Price-to-rent
- 11.0×
Monthly cashflow live
- Estimated rent
- $7,134 medium interval (Pro) →
- Mortgage (P&I)
- −$4,956
- Tax from tax record
- −$763 /mo · $9,155/yr
- Insurance
- −$394
- HOA
- −$0
- Vacancy / Maint / Mgmt
- −$1,498
- Net cashflow
- $-476
Break-even live
Sensitivity live
| Price | -10% $59 | -5% $-209 | +0% $-476 | +5% $-744 | +10% $-1,011 |
|---|---|---|---|---|---|
| Rent | -10% $-1,040 | -5% $-758 | +0% $-476 | +5% $-194 | +10% $87 |
| Rate | -1.0pp $0 | -0.5pp $-236 | base $-476 | +0.5pp $-721 | +1.0pp $-970 |
UW: 25.0% down · 7.5% · 30yr · 1.5% tax · 5.0% vac · 8.0% maint · 8.0% mgmt
Financing live
Cash to close
- Down payment
- $236,250
- Closing costs
- $28,350
- Reserves months
- —
- Total cash needed
- —
Loan-product check · same deal, 3 products live
Conventional
25% down · 7.5% · 30yr
- Down + closing
- —
- Monthly P&I
- —
- Monthly cashflow
- —
- DSCR
- —
- Eligible?
- —
Personal DTI + credit; lowest rate.
DSCR
20% down · 8.5% · 30yr
- Down + closing
- —
- Monthly P&I
- —
- Monthly cashflow
- —
- DSCR
- —
- Eligible?
- —
No personal income docs; deal must DSCR.
Hard money
10% down · 12.0% · 12mo
- Down + closing
- —
- Monthly P&I
- —
- Monthly cashflow
- —
- DSCR
- —
- Eligible?
- —
Short-term bridge; refi at stabilization.
Rent comps 3 comps
| Address | Beds | Baths | Sqft | Rent | $/sqft | DOM | Units | Dist |
|---|---|---|---|---|---|---|---|---|
| 1340 Taylor St San Francisco, CA | 4.0 | 3.0 | 2110 | $21,420 | $10.15 | 16d | 1 | 1.05mi |
| 471 S Van Ness Ave San Francisco, CA | 4.0 | 3.0 | 2140 | $11,000 | $5.14 | 16d | 1 | 1.25mi |
| 2256B Van Ness Ave San Francisco, CA | 5.0 | 2.0 | 1990 | $11,995 | $6.03 | 25d | 1 | 1.47mi |
Listing history 17 events
-
2026-06-21days on market $945,000 Active 50 DOM
-
2026-06-18days on market $945,000 Active 47 DOM
-
2026-06-17days on market $945,000 Active 46 DOM
-
2026-06-16days on market $945,000 Active 45 DOM
-
2026-06-15days on market $945,000 Active 44 DOM
-
2026-06-13days on market $945,000 Active 42 DOM
-
2026-06-13days on market $945,000 Active 41 DOM
-
2026-06-09days on market $945,000 Active 38 DOM
-
2026-06-08days on market $945,000 Active 37 DOM
-
2026-06-07days on market $945,000 Active 36 DOM
-
2026-06-04days on market $945,000 Active 33 DOM
-
2026-06-03pricedays on market $945,000 Active 32 DOM
-
2026-06-02days on market $995,000 Active 31 DOM
Show marketing remark (1218 chars)
Price reduced $50K and TRANSPARENT! Built in 1906 as a flat-over-store in SoMa's post-quake rebuild, 422-424 Tehama sits within one of San Francisco's fastest-evolving corridors shaped by AI, tech, and creative office users. The upper level offers a three-bedroom flat with eat-in kitchen and full bath. The lower level is separately accessed and includes a kitchen, bath, and additional rooms. An accessory rear structure is currently used as a music studio and is not represented as permitted living space. RSD zoning allows a range of residential, live/work, and commercial uses. The 3R Report reflects legal use as a one-family dwelling with commercial, may offer potential pathways for future repositioning, including single-family conversion subject to Planning and DBI approval. Currently tenant occupied, the property offers immediate income with potential for investors, developers, or future owner-users. Property records differ from current configuration; buyers are advised to review disclosures and independently verify legal use, square footage, layout, conversion potential, and tenancy rights with appropriate professionals. Central location with access to downtown, transit, and major commuter routes.
-
2026-06-01days on market $995,000 Active 30 DOM
-
2026-05-31days on market $995,000 Active 29 DOM
-
2026-05-02$995,000 Active 1182-char remark
Show marketing remark (1218 chars)
Price reduced $50K and TRANSPARENT! Built in 1906 as a flat-over-store in SoMa's post-quake rebuild, 422-424 Tehama sits within one of San Francisco's fastest-evolving corridors shaped by AI, tech, and creative office users. The upper level offers a three-bedroom flat with eat-in kitchen and full bath. The lower level is separately accessed and includes a kitchen, bath, and additional rooms. An accessory rear structure is currently used as a music studio and is not represented as permitted living space. RSD zoning allows a range of residential, live/work, and commercial uses. The 3R Report reflects legal use as a one-family dwelling with commercial, may offer potential pathways for future repositioning, including single-family conversion subject to Planning and DBI approval. Currently tenant occupied, the property offers immediate income with potential for investors, developers, or future owner-users. Property records differ from current configuration; buyers are advised to review disclosures and independently verify legal use, square footage, layout, conversion potential, and tenancy rights with appropriate professionals. Central location with access to downtown, transit, and major commuter routes.
-
2026-05-02$995,000 Active 1182-char remark
Show marketing remark (1218 chars)
Price reduced $50K and TRANSPARENT! Built in 1906 as a flat-over-store in SoMa's post-quake rebuild, 422-424 Tehama sits within one of San Francisco's fastest-evolving corridors shaped by AI, tech, and creative office users. The upper level offers a three-bedroom flat with eat-in kitchen and full bath. The lower level is separately accessed and includes a kitchen, bath, and additional rooms. An accessory rear structure is currently used as a music studio and is not represented as permitted living space. RSD zoning allows a range of residential, live/work, and commercial uses. The 3R Report reflects legal use as a one-family dwelling with commercial, may offer potential pathways for future repositioning, including single-family conversion subject to Planning and DBI approval. Currently tenant occupied, the property offers immediate income with potential for investors, developers, or future owner-users. Property records differ from current configuration; buyers are advised to review disclosures and independently verify legal use, square footage, layout, conversion potential, and tenancy rights with appropriate professionals. Central location with access to downtown, transit, and major commuter routes.
ⓘ Source: listings_history table (triggers on properties + properties_extension) + one-shot
backfill from property_details.listing_events for pre-trigger history.
Tax reassessment forecast CA · Resets to sale price
- Current annual tax
- $9,155 · $763/mo
- Projected year-2 tax
- $9,155 · $763/mo
- Expected delta
- $0/yr ($0/mo · 0.0%)
ⓘ Screening estimate from a state-policy table — verify with the county assessor before closing.
Climate risk First Street
- Flood 1/10 Low FEMA zone X (unshaded) · 0% chance over 30 yrs
- Wildfire 1/10 Low
- Heat 2/10 Low 8 d/yr ≥79°F today · 17 d/yr by 30 yrs out
- Wind 1/10 Low
- Air quality 8/10 Severe 15 unhealthy d/yr today · 15 by 30 yrs out
Nearby sold comps map
Loading sold comps map…
Walkable amenities ~0.75 mi
Loading nearby amenities…
Taxation est. · year 1
- Rental income
- $85,611
- − Mortgage interest
- −$52,935
- − Property taxes
- −$9,155
- − Insurance
- −$4,725
- − Repairs & maintenance
- −$6,849
- − Management
- −$6,849
- − Depreciation
- −$27,491
- Taxable loss
- −$22,392
- Est. tax savings @ 24.0%
- +$5,374
- After-tax cash flow
- $-341/yr
For passive investors: Depreciation is non-cash, so a rental often shows a tax loss while cash-flowing — sheltering income. Rental losses are passive: they offset passive income freely, and up to $25,000/yr can offset ordinary (W-2) income if you actively participate and your MAGI is under $100k (phasing out to $0 by $150k); unused losses carry forward. On sale, claimed depreciation is recaptured at up to 25%, and gains may owe capital-gains tax (a 1031 exchange can defer both). Figures are a year-1 estimate at your 24.0% rate — not tax advice; consult a CPA.
Schools (NCES district)
- District
- San Francisco Unified
- NCES district ID
- 0634410
- Math proficiency
- 50% ▬ 0.00%
- Reading proficiency
- 56% ▲ 1.00%
- Median HH income
- $81,249
- Composite
- 50.14/100
- National rank
- #4088
- State rank
- #322 of 1400 in CA
Livability — San Francisco
- Score
- 76/100
- State rank
- #90
- US rank
- #3143
Category grades
Schools grade is shown separately in the Schools card above.
Census & demographics
- Census place
- San Francisco, CA
- County
- San Francisco County · 827,552 people
- City population
- 827,552
- Metro
- San Francisco-Oakland-Berkeley, CA
- Population (ZIP)
- 34,964
- Household income
- $116,438
- Rent vs Own
- Severe rent burden
- 2666.0
Population outlook (San Francisco County) Hauer SSP2
- Today (2025)
- 1,030,936 people
- By 2030
- 1,110,409 · +7.7%
- By 2040
- 1,270,010 · +23.2%
- By 2050
- 1,435,001 · +39.2%
- By 2075
- 1,779,074 · +72.6%
- By 2100
- 1,966,767 · +90.8%
Race, ethnicity, and origin ACS 2023
- Neighborhood character
- Highly diverse neighborhood (Simpson 0.75)
- Race & ethnicity
- White 32% Asian 31% Hispanic / Latino 20% Two or more races 11% Black 10% Native American 2%
- Hispanic origin (detail)
- Mexican 11%
- Common ancestry
- Lithuanian 2% Slovak 2% Romanian 2%
- Foreign-born
- 36% · Canada, China, Vietnam
- Languages at home
- 56% English-only · Spanish 16% Chinese 9% Tagalog/Filipino 6%
Political lean MEDSL · San Francisco
- 2024 margin
- Solid D (+64.8) · D 80.3% · R 15.5% · Other 4.1%
- 2008→2024 swing
- -5.7pp toward R · 2008: 70.5pp · 2024: 64.8pp
- All cycles
- 2024: D+64.8 2020: D+72.5 2016: D+76.1 2012: D+70.2 2008: D+70.5
Not yet ingested
- Civics
- —
Market trends
- HPI YoY
- ▲ 4.96%
- Current HPI
- 175.4945
- Rent YoY
- ▲ 15.50%
- Metro
- San Francisco-Oakland-Berkeley, CA
- State GDP YoY
- ▲ 3.21%
- F500 in state
- 116
Industry mix (Fortune 500 HQ in CA)
| Industry | F500 HQs | Revenue |
|---|---|---|
| Technology | 27 | $1,492B |
|
||
| Financial Services | 3 | $174B |
|
||
| Retail | 3 | $44B |
|
||
| Insurance | 3 | $26B |
|
||
| Media / Entertainment | 2 | $115B |
|
||
| Pharmaceuticals / Biotech | 2 | $62B |
|
||
Price history
-5.0% since first listed4 events — show timeline
- 2026-06-02 Price Changed $945,000 San Francisco MLS
- 2026-06-02 Price Changed $945,000 San Francisco MLS
- 2026-05-02 Listed $995,000 San Francisco MLS
- 2026-05-02 Listed $995,000 San Francisco MLS
Property tax history
+7.8%/yrLatest (2025): $9,155 · +3.6% YoY. Source: county tax records.
Cash-flow waterfall
monthlySold comps — $/sqft
last 12 mo · ≤1 miLoading sold comps…