321 Iowa Ave · Lake Arthur, LA
Flood risk 10/10 · Severe
- FEMA flood zone
- X (shaded)
- Chance of flooding over 30 yrs
- 0.99%
- Est. flood insurance / yr
- $507 – $1,088
Fire risk 1/10 · Minimal
- Est. fire insurance / yr
- $1,269 – $2,357
Heat risk 9/10 · Severe
- Hot days now (above 109°F)
- 7 days/yr
- Hot days in 30 yrs
- 21 days/yr
Wind risk 9/10 · Severe
- Chance of severe wind over 30 yrs
- 99.0%
Air-quality risk 1/10 · Minimal
- Unhealthy air days now
- 0 days/yr
- Unhealthy air days in 30 yrs
- 0 days/yr
Risk factors via First Street. Map © Google.
Why this score? — see what drove the B+ grade
The composite is a weighted blend of 9 inputs, each scored 0–100. Each bar is that input's sub-score; the figure is the points it added to the 100-point composite (weight × sub-score).
- Cash flow +30.0/30.0
- ARV discount +14.1/15.0
- DSCR +10.0/10.0
- 1% rule +9.1/10.0
- Appreciation +4.8/10.0
- Livability +3.4/5.0
- Schools +3.0/10.0
- Rent growth +2.5/5.0
- Condition / age +2.5/5.0
$69,900
🖨 Deal sheet 📄 Offer letter ✓ Due diligence
Listing remarks MLS
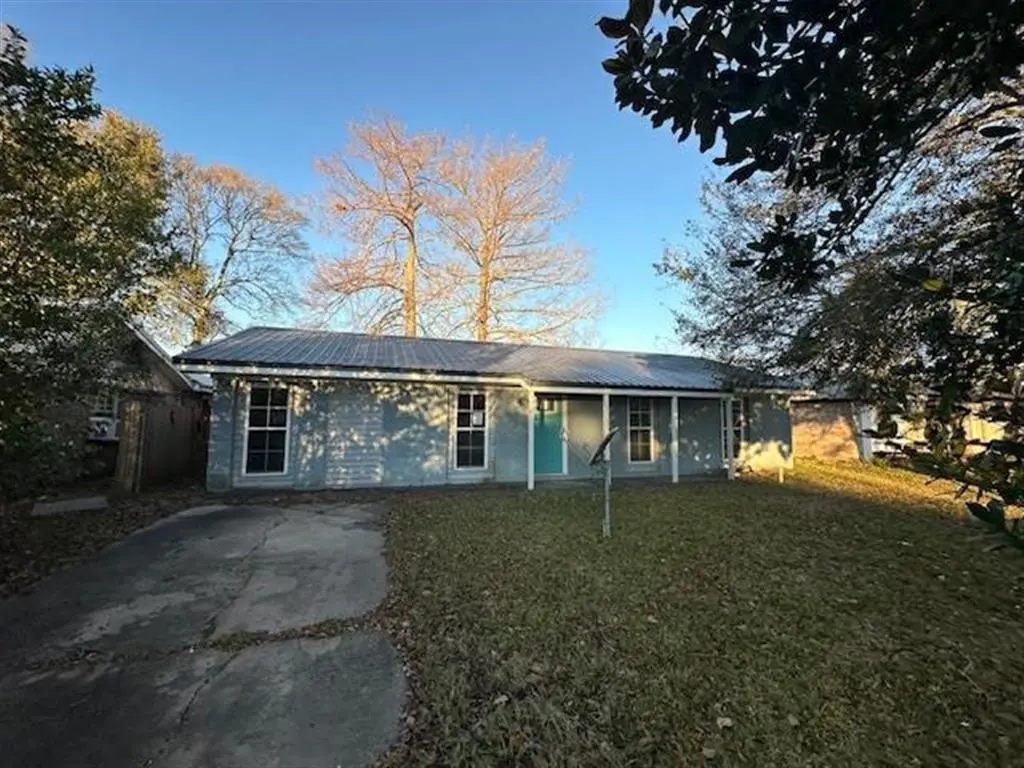
This charming brick house on a slab foundation sits on 0.21 acres and features 3 bedrooms and 1.5 baths within the city limits of Lake Arthur. Schedule your showing today!
Key facts
- 9,148 sq ft lot
- Built 1970
- Listed 93 days
Neighborhood map
What this means for you Summary
Snapshot
- This is a 3-bed/1.5-bath single-family listed at $70k.
Deal economics
- At list price, monthly cash flow is $246 ($3k/yr) — positive.
- The deal already cash-flows at list — no discount required.
- Meets the 1% rule at list price ($986 rent vs $70k).
- Recommended offer: $64k (9.0% below list) — sets the bar for market timing.
Location & tenants
- Location reads 68/100 on livability (#99 in LA) — a middle-class / working-renter tenant base. Strengths: crime A+, cost of living A+, housing A+; Watch: amenities F, commute F, employment F.
- Jefferson Davis Parish (town): math 30% / reading 42% proficiency, ranked #33 of 98 in LA (top 34%) — families likely to look elsewhere, expect single-tenant / working-renter base with shorter leases.
- Market conditions: 10 active listings in the ZIP; 69 units permitted in Jefferson Davis Parish in 2024 (0 in 5+ unit buildings).
Forward outlook
- In year one you build about $195 of equity ($483 loan paydown + $-288 appreciation (-0.4% local appreciation)).
- Jefferson Davis County population projected to shrink 8% by 2050 — rents likely to lag national; underwrite the cash flow, not the appreciation.
- At projected returns (-0.4% appreciation + 3.0% rent growth), your $20k cash investment doubles in ~6 years — after that, you're playing with house money.
Negotiation context
- It's been on market 94 days — a 9% lower offer ($64k) is reasonable based on typical stale-listing flexibility.
- 4 sale attempts since 12y ago with the ask held roughly flat each time — persistent listings suggest the price (not the market) is what's stuck; bring a comps-based counter.
Risks & watch-outs
- Watch-outs: flood insurance adds $66/mo.
- Climate carrying-cost: severe flood risk; severe wind risk, 99% chance of damaging wind over 30y; extreme-heat days projected 7→21/yr by 2055 (HVAC capex compounding) — expect insurance premiums to compound above CPI over the hold.
Questions for the listing agent
- It's been on market 94 days. Have you received any prior offers? Is the seller open to a 9% concession, seller financing, or rate buy-down credit?
- Built in 1970 — when were the roof, HVAC, electrical panel, plumbing, and water heater last replaced?
- What's the actual annual flood-insurance premium (NFIP or private), and is the property in a SFHA with mandatory coverage?
- Why hasn't it sold? Are there any deal-killer items the seller is aware of (foundation, flood, title, zoning, code violations)?
- Is there a deadline driving the sale (1031 exchange, divorce, estate, relocation)? That informs how much negotiation room exists.
- Schools are B-rated — typically a magnet for longer-tenancy family renters. What's the average tenant stay here, and is there a school-zone premium baked into asking?
- What's the average days-on-market for RENTAL listings here right now (not sales)? A rising rental-DOM trend means longer vacancies and softer asking-rent achievability than the comps imply.
- What's the recent tenant-quality profile in this submarket — average credit score on applications, eviction rate, late-payment / NSF rate, and stable-employment percentage? A property-management company in the area should have these aggregated.
- How much new for-sale + rental construction is in the pipeline within 1–3 miles? Heavy new supply typically softens prices + rents 12–24 months out; constrained supply supports both.
Investment metrics
- 1% rule
- 1.41% ✓
- Cap rate
- 11.66%
- Cash-on-cash
- 19.17%
- DSCR
- 1.85
- GRM
- 5.9
CMA / ARV
- ARV (median comp)
- $81,951
- List price
- $69,900
- Delta
- -14.70%
- Verdict
- UNDERPRICED
- Comps
- 12 within 1.0 mi
Show comp detail 4 sales within ~0.75 mi
| Address | Dist | Beds/Ba | Sqft | Sold | Price | $/sf | Match |
|---|---|---|---|---|---|---|---|
| 719 Kellogg Ave | 0.33mi | 3/2.0 | 1,317 (+2%) | 2mo | $28,500 | $22 | 77 |
| 716 Arthur Ave | 0.29mi | 3/2.0 | 1,350 (+5%) | 2mo | $58,200 | $43 | 75 |
| 424 Arthur Ave | 0.57mi | 3/2.0 | 1,300 (+1%) | 15mo | $77,500 | $60 | 57 |
| 425 New Orleans Ave | 0.49mi | 3/2.0 | 1,349 (+5%) | 22mo | $185,000 | $137 | 50 |
Match score weights: distance 35% · size 25% · config 20% · recency 20%. Top-matched comps best support the ARV.
Projected returns pro-forma
-0.41% appreciation · 3.0% rent growth · sell at horizon
- IRR
- 13.5%
- Equity multiple
- 1.63×
- Total profit
- $12,344
- Equity at exit
- $18,870
- IRR
- 18.7%
- Equity multiple
- 2.98×
- Total profit
- $38,813
- Equity at exit
- $21,574
Cash invested: $19,572 (down + closing). Projections, not guarantees.
Landlord ↔ Tenant lean methodology
- Overall (STATE)
- 90 Strongly Landlord-Friendly
- State Louisiana
- 90 Strongly Landlord-Friendly · R+12
- County
- — inherits STATE
- City
- — inherits STATE
ZIP-level market 70549
- Home prices YoY
- -0.3%
- Active inventory
- 10
- Price-to-rent
- 5.9×
Monthly cashflow live
- Estimated rent
- $986 medium interval (Pro) →
- Mortgage (P&I)
- −$367
- Tax from tax record
- −$71 /mo · $847/yr
- Insurance
- −$29
- Flood insurance flood zone
- −$66 /mo · $798/yr
- HOA
- −$0
- Vacancy / Maint / Mgmt
- −$207
- Net cashflow
- $246
Break-even live
UW: 25.0% down · 7.5% · 30yr · 1.5% tax · 5.0% vac · 8.0% maint · 8.0% mgmt
Financing live
Cash to close
- Down payment
- $17,475
- Closing costs
- $2,097
- Reserves months
- —
- Total cash needed
- —
Loan-product check · same deal, 3 products live
Conventional
25% down · 7.5% · 30yr
- Down + closing
- —
- Monthly P&I
- —
- Monthly cashflow
- —
- DSCR
- —
- Eligible?
- —
Personal DTI + credit; lowest rate.
DSCR
20% down · 8.5% · 30yr
- Down + closing
- —
- Monthly P&I
- —
- Monthly cashflow
- —
- DSCR
- —
- Eligible?
- —
No personal income docs; deal must DSCR.
Hard money
10% down · 12.0% · 12mo
- Down + closing
- —
- Monthly P&I
- —
- Monthly cashflow
- —
- DSCR
- —
- Eligible?
- —
Short-term bridge; refi at stabilization.
Listing history 22 events
-
2026-06-19days on market $69,900 Active 94 DOM
-
2026-06-18days on market $69,900 Active 93 DOM
-
2026-06-17days on market $69,900 Active 92 DOM
-
2026-06-16days on market $69,900 Active 91 DOM
-
2026-06-15days on market $69,900 Active 90 DOM
-
2026-06-14days on market $69,900 Active 88 DOM
-
2026-06-13days on market $69,900 Active 87 DOM
-
2026-06-10days on market $69,900 Active 85 DOM
-
2026-06-09days on market $69,900 Active 84 DOM
-
2026-06-08days on market $69,900 Active 83 DOM
-
2026-06-07days on market $69,900 Active 82 DOM
-
2026-06-02days on market $69,900 Active 77 DOM
-
2026-06-01days on market $69,900 Active 76 DOM
-
2026-05-31days on market $69,900 Active 75 DOM
-
2026-05-30days on market $69,900 Active 74 DOM
-
2026-03-17$69,900 Active 171-char remark
Show marketing remark (171 chars)
This charming brick house on a slab foundation sits on 0.21 acres and features 3 bedrooms and 1.5 baths within the city limits of Lake Arthur. Schedule your showing today!
-
2024-10-07price $79,000
-
2024-08-06$88,000 Active
-
2018-06-25soldstatus
-
2018-02-10$80,000
-
2015-02-10soldstatus
-
2014-09-24$74,900
ⓘ Source: listings_history table (triggers on properties + properties_extension) + one-shot
backfill from property_details.listing_events for pre-trigger history.
Tax reassessment forecast LA · Resets to sale price
- Current annual tax
- $847 · $71/mo
- Projected year-2 tax
- $847 · $71/mo
- Expected delta
- $0/yr ($0/mo · -0.0%)
ⓘ Screening estimate from a state-policy table — verify with the county assessor before closing.
Climate risk First Street
- Flood 10/10 Extreme FEMA zone X (shaded) · 99% chance over 30 yrs
- Wildfire 1/10 Low
- Heat 9/10 Extreme 7 d/yr ≥109°F today · 21 d/yr by 30 yrs out
- Wind 9/10 Extreme 99% chance of damaging wind over 30 yrs
- Air quality 1/10 Low 0 unhealthy d/yr today · 0 by 30 yrs out
Nearby sold comps map
Loading sold comps map…
Walkable amenities ~0.75 mi
Loading nearby amenities…
Taxation est. · year 1
- Rental income
- $11,832
- − Mortgage interest
- −$3,915
- − Property taxes
- −$847
- − Insurance
- −$1,147
- − Repairs & maintenance
- −$947
- − Management
- −$947
- − Depreciation
- −$2,033
- Taxable income
- $1,997
- Est. tax owed @ 24.0%
- −$479
- After-tax cash flow
- $2,476/yr
For passive investors: Depreciation is non-cash, so a rental often shows a tax loss while cash-flowing — sheltering income. Rental losses are passive: they offset passive income freely, and up to $25,000/yr can offset ordinary (W-2) income if you actively participate and your MAGI is under $100k (phasing out to $0 by $150k); unused losses carry forward. On sale, claimed depreciation is recaptured at up to 25%, and gains may owe capital-gains tax (a 1031 exchange can defer both). Figures are a year-1 estimate at your 24.0% rate — not tax advice; consult a CPA.
Schools (NCES district)
- District
- Jefferson Davis Parish
- NCES district ID
- 2200810
- Math proficiency
- 30% ▼ -39.00%
- Reading proficiency
- 42% ▼ -33.00%
- Median HH income
- $40,322
- Composite
- 30.21/100
- National rank
- #6302
- State rank
- #33 of 98 in LA
Livability — Lake Arthur
- Score
- 68/100
- State rank
- #99
- US rank
- #9980
Category grades
Schools grade is shown separately in the Schools card above.
Census & demographics
- Census place
- Lake Arthur, LA
- Population (ZIP)
- 3,580
Population outlook (Jefferson Davis County) Hauer SSP2
- Today (2025)
- 31,015 people
- By 2030
- 30,563 · -1.5%
- By 2040
- 29,639 · -4.4%
- By 2050
- 28,456 · -8.3%
- By 2075
- 25,521 · -17.7%
- By 2100
- 21,787 · -29.8%
Race, ethnicity, and origin ACS 2023
- Neighborhood character
- Predominantly White (93%)
- Race & ethnicity
- White 93% Black 4% Two or more races 3% Hispanic / Latino 1%
- Common ancestry
- Lithuanian 25% Slovak 1%
- Foreign-born
- 0%
- Languages at home
- 95% English-only · French/Haitian/Cajun 4%
Political lean MEDSL · Jefferson Davis
- 2024 margin
- Solid R (+61.1) · D 18.8% · R 79.9% · Other 1.3%
- 2008→2024 swing
- -21.5pp toward R · 2008: -39.7pp · 2024: -61.1pp
- All cycles
- 2024: R+61.1 2020: R+55.4 2016: R+53.9 2012: R+47.6 2008: R+39.7
Not yet ingested
- Civics
- —
Market trends
- HPI YoY
- ▼ -0.41%
- Current HPI
- 128.4869
- Rent YoY
- —
- Metro
- —
- State GDP YoY
- ▲ 3.29%
- F500 in state
- 10
Industry mix (Fortune 500 HQ in LA)
| Industry | F500 HQs | Revenue |
|---|---|---|
| Telecommunications | 2 | $23B |
|
||
| Utilities | 1 | $12B |
|
||
| Wholesale / Distribution | 1 | $5B |
|
||
| Advertising | 1 | $2B |
|
||
Price history
-6.7% since first listed7 events — show timeline
- 2026-03-17 Listed $69,900 SWLAR
- 2024-10-07 Price Changed $79,000 AcadianaMLS
- 2024-08-06 Listed $88,000 AcadianaMLS
- 2018-06-25 Sold (MLS) — SWLAR
- 2018-02-10 Listed $80,000 SWLAR
- 2015-02-10 Sold (MLS) — SWLAR
- 2014-09-24 Listed $74,900 SWLAR
Property tax history
+3.3%/yrLatest (2025): $847 · +0.2% YoY. Source: county tax records.
Cash-flow waterfall
monthlySold comps — $/sqft
last 12 mo · ≤1 miLoading sold comps…