188 Lake Dr · Birchwood Lakes, PA
Flood risk 1/10 · Minimal
- FEMA flood zone
- X (unshaded)
- Chance of flooding over 30 yrs
- 0.0%
- Est. flood insurance / yr
- $473 – $860
Fire risk 4/10 · Minor
- Est. fire insurance / yr
- $511 – $949
Heat risk 3/10 · Minor
- Hot days now (above 94°F)
- 7 days/yr
- Hot days in 30 yrs
- 15 days/yr
Wind risk 3/10 · Minor
- Chance of severe wind over 30 yrs
- 7.0%
Air-quality risk 2/10 · Minimal
- Unhealthy air days now
- 1 days/yr
- Unhealthy air days in 30 yrs
- 2 days/yr
Risk factors via First Street. Map © Google.
Why this score? — see what drove the B grade
The composite is a weighted blend of 9 inputs, each scored 0–100. Each bar is that input's sub-score; the figure is the points it added to the 100-point composite (weight × sub-score).
- Cash flow +26.2/30.0
- Appreciation +10.0/10.0
- 1% rule +8.9/10.0
- DSCR +8.8/10.0
- ARV discount +7.5/15.0
- Schools +4.7/10.0
- Livability +3.1/5.0
- Rent growth +2.5/5.0
- Condition / age +2.5/5.0
$135,000
🖨 Deal sheet (PDF) 📄 Offer letter ✓ Due diligence
Listing remarks MLS
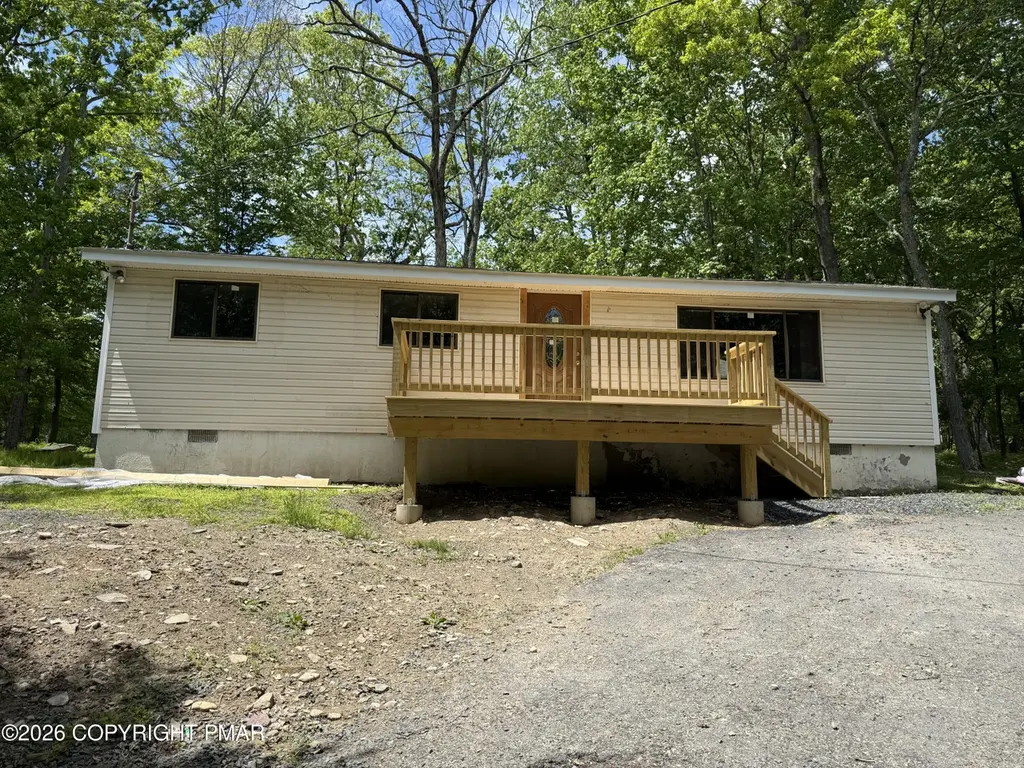
A blacktop drive leads to this well maintained lakeview property. The home offers a living room with brick FP, dining room with sliders to a rear deck, kitchen 3 BRs, bath & laundry area. The larger lot size allows for lots of privacy. Sq. ft. is approx. , Sewer: WS Comm Central
Key facts
- New siding
- Gated lake community
- New roof
Tags
Property features AI
Finance
- Other: Located in the Marcel Lake subdivision; additional parcels included with the lot
- HOA & community: Homeowners association with gated entry, clubhouse and recreation facilities; Annual association fee of $1,692.04 (approximately $141/month); Association fee includes security and grounds maintenance
Exterior
- Parking: Open parking with 3 spaces
- Utilities: Public water; Public sewer
- Home design: Single family house; Residential property; No common walls
- Construction: Vinyl siding; Shingle roof; Concrete perimeter foundation; Built as a single-story (1,008 above-grade finished area)
- Exterior features: Deck; Paved private road access; Private maintained road
Interior
- Kitchen: Gas range; Refrigerator; Vented exhaust fan
- Bedrooms: Total of 5 rooms (includes sleeping areas)
- Flooring: Varies
- Bathrooms: 1 full bathroom
- Interior features: Open floor plan; Unfurnished; Crawl space basement
- Laundry & utility: Washer hookup; Electric dryer hookup
Neighborhood map
What this means for you Summary
Snapshot
- This is a 3-bed/1.0-bath manufactured listed at $135k.
Deal economics
- At list price, monthly cash flow is $343 ($4k/yr) — positive.
- The deal already cash-flows at list — no discount required.
- Meets the 1% rule at list price ($2k rent vs $135k).
- Recommended offer: $133k (1.5% below list) — sets the bar for market timing.
- Cap rate 9.3% vs local median 4.6% in Birchwood Lakes — top-decile yield for the area; either an underpriced asset or a hidden risk that comps aren't pricing in. Stress-test before assuming the spread holds.
Location & tenants
- Location reads 61/100 on livability (#1,407 in PA) — a middle-class / working-renter tenant base. Strengths: crime A+, cost of living A+, housing B+; Watch: employment D+, health & safety D, schools F.
- Delaware Valley SD (rural): math 41% / reading 66% proficiency, ranked #121 of 539 in PA (top 22%) — acceptable for families but not a draw, mixed tenant base, ~2y average lease.
- Market conditions: 213 active listings in the ZIP; 2 comparable units currently listed for rent nearby; 213 units permitted in Pike County in 2024 (0 in 5+ unit buildings).
Forward outlook
- In year one you build about $14k of equity ($933 loan paydown + $14k appreciation (10.0% local appreciation)).
- Pike County population projected at -25% by 2050 — secular population decline; favor cash flow + early exit over multi-decade hold.
- At projected returns (10.0% appreciation + 3.0% rent growth), your $38k cash investment doubles in ~2 years — after that, you're playing with house money.
- By year 3, paydown + projected appreciation supports a ~$37k cash-out refi (75% LTV) — recoverable capital for the next deal without selling this one.
Negotiation context
- It's been on market 21 days — a 2% lower offer ($133k) is reasonable based on typical stale-listing flexibility.
- 2 sale attempts since 14y ago with the ask held roughly flat each time — persistent listings suggest the price (not the market) is what's stuck; bring a comps-based counter.
- Current owner paid $68k; list at $135k implies a 98% gain — meaningful room to come down on a strong offer.
Questions for the listing agent
- Built in 1979 — when were the roof, HVAC, electrical panel, plumbing, and water heater last replaced?
- What does the HOA fee cover, when was the last increase, and are there any pending special assessments or reserve-fund shortfalls?
- Is there a deadline driving the sale (1031 exchange, divorce, estate, relocation)? That informs how much negotiation room exists.
- Schools are F-rated, which usually means shorter tenancies and higher turnover. Who's the typical renter profile here, and what's been the actual vacancy rate?
- What's the average days-on-market for RENTAL listings here right now (not sales)? A rising rental-DOM trend means longer vacancies and softer asking-rent achievability than the comps imply.
- What's the recent tenant-quality profile in this submarket — average credit score on applications, eviction rate, late-payment / NSF rate, and stable-employment percentage? A property-management company in the area should have these aggregated.
- How much new for-sale + rental construction is in the pipeline within 1–3 miles? Heavy new supply typically softens prices + rents 12–24 months out; constrained supply supports both.
Investment metrics
- 1% rule
- 1.39% ✓
- Cap rate
- 9.34%
- Cash-on-cash
- 10.89%
- DSCR
- 1.48
- GRM
- 6.0
CMA / ARV
No comps found within radius.
Projected returns pro-forma
10.0% appreciation · 3.0% rent growth · sell at horizon
- IRR
- 32.3%
- Equity multiple
- 3.53×
- Total profit
- $95,519
- Equity at exit
- $121,619
- IRR
- 27.9%
- Equity multiple
- 8.00×
- Total profit
- $264,421
- Equity at exit
- $262,275
Cash invested: $37,800 (down + closing). Projections, not guarantees.
Landlord ↔ Tenant lean methodology
- Overall (STATE)
- 62 Landlord-Friendly
- State Pennsylvania
- 62 Landlord-Friendly · EVEN
- County
- — inherits STATE
- City
- — inherits STATE
ZIP-level market 18328
- Home prices YoY
- 18.1%
- Active inventory
- 213
- Price-to-rent
- 6.0×
Monthly cashflow live
- Estimated rent
- $1,875 medium interval (Pro) →
- Mortgage (P&I)
- −$708
- Tax from tax record
- −$233 /mo · $2,798/yr
- Insurance
- −$56
- HOA
- −$141
- Vacancy / Maint / Mgmt
- −$394
- Net cashflow
- $343
Break-even live
Sensitivity live
| Price | -10% $419 | -5% $381 | +0% $343 | +5% $305 | +10% $266 |
|---|---|---|---|---|---|
| Rent | -10% $195 | -5% $269 | +0% $343 | +5% $417 | +10% $491 |
| Rate | -1.0pp $411 | -0.5pp $377 | base $343 | +0.5pp $308 | +1.0pp $272 |
UW: 25.0% down · 7.5% · 30yr · 1.5% tax · 5.0% vac · 8.0% maint · 8.0% mgmt
Financing live
Cash to close
- Down payment
- $33,750
- Closing costs
- $4,050
- Reserves months
- —
- Total cash needed
- —
Loan-product check · same deal, 3 products live
Conventional
25% down · 7.5% · 30yr
- Down + closing
- —
- Monthly P&I
- —
- Monthly cashflow
- —
- DSCR
- —
- Eligible?
- —
Personal DTI + credit; lowest rate.
DSCR
20% down · 8.5% · 30yr
- Down + closing
- —
- Monthly P&I
- —
- Monthly cashflow
- —
- DSCR
- —
- Eligible?
- —
No personal income docs; deal must DSCR.
Hard money
10% down · 12.0% · 12mo
- Down + closing
- —
- Monthly P&I
- —
- Monthly cashflow
- —
- DSCR
- —
- Eligible?
- —
Short-term bridge; refi at stabilization.
Rent comps 2 comps
| Address | Beds | Baths | Sqft | Rent | $/sqft | DOM | Units | Dist |
|---|---|---|---|---|---|---|---|---|
| 143 Nichecronk Rd Dingmans Ferry, PA | 3.0 | 1.5 | 1024 | $1,950 | $1.90 | 0d | 1 | 1.48mi |
| 143 Nichecronk Rd Dingmans Ferry, PA | 3.0 | 1.5 | 1024 | $1,800 | $1.76 | 45d | 1 | 1.48mi |
HOA detail
- Monthly dues
- $141 · $1,692/yr
- Likely covers
- sewer
Listing history 15 events
-
2026-06-21days on market $135,000 Active 21 DOM
-
2026-06-18days on market $135,000 Active 18 DOM
-
2026-06-17days on market $135,000 Active 17 DOM
-
2026-06-16days on market $135,000 Active 16 DOM
-
2026-06-15days on market $135,000 Active 15 DOM
-
2026-06-13days on market $135,000 Active 13 DOM
-
2026-06-13days on market $135,000 Active 12 DOM
-
2026-06-09days on market $135,000 Active 9 DOM
-
2026-06-08days on market $135,000 Active 8 DOM
-
2026-06-07days on market $135,000 Active 7 DOM
-
2026-06-04days on market $135,000 Active 4 DOM
-
2026-06-03days on market $135,000 Active 3 DOM
-
2026-06-02days on market $135,000 Active 2 DOM
-
2026-06-01remarks 263-char remark
-
2026-06-01$135,000 Active 1 DOM
ⓘ Source: listings_history table (triggers on properties + properties_extension) + one-shot
backfill from property_details.listing_events for pre-trigger history.
Tax reassessment forecast PA · Partial reset (capped growth)
- Current annual tax
- $2,798 · $233/mo
- Projected year-2 tax
- $2,798 · $233/mo
- Expected delta
- $0/yr ($0/mo · 0.0%)
ⓘ Screening estimate from a state-policy table — verify with the county assessor before closing.
Climate risk First Street
- Flood 1/10 Low FEMA zone X (unshaded) · 0% chance over 30 yrs
- Wildfire 4/10 Moderate
- Heat 3/10 Moderate 7 d/yr ≥94°F today · 15 d/yr by 30 yrs out
- Wind 3/10 Moderate 7% chance of damaging wind over 30 yrs
- Air quality 2/10 Low 1 unhealthy d/yr today · 2 by 30 yrs out
Nearby sold comps map
Loading sold comps map…
Walkable amenities ~0.75 mi
Loading nearby amenities…
Taxation est. · year 1
- Rental income
- $22,500
- − Mortgage interest
- −$7,562
- − Property taxes
- −$2,798
- − Insurance
- −$675
- − Repairs & maintenance
- −$1,800
- − Management
- −$1,800
- − HOA
- −$1,692
- − Depreciation
- −$3,927
- Taxable income
- $2,246
- Est. tax owed @ 24.0%
- −$539
- After-tax cash flow
- $3,576/yr
For passive investors: Depreciation is non-cash, so a rental often shows a tax loss while cash-flowing — sheltering income. Rental losses are passive: they offset passive income freely, and up to $25,000/yr can offset ordinary (W-2) income if you actively participate and your MAGI is under $100k (phasing out to $0 by $150k); unused losses carry forward. On sale, claimed depreciation is recaptured at up to 25%, and gains may owe capital-gains tax (a 1031 exchange can defer both). Figures are a year-1 estimate at your 24.0% rate — not tax advice; consult a CPA.
Schools (NCES district)
- District
- Delaware Valley SD
- NCES district ID
- 4207530
- Math proficiency
- 41% ▼ -12.00%
- Reading proficiency
- 66% ▼ -9.00%
- Median HH income
- $64,202
- Composite
- 46.95/100
- National rank
- #2359
- State rank
- #121 of 539 in PA
Livability — Birchwood Lakes
- Score
- 61/100
- State rank
- #1407
- US rank
- #17785
Category grades
Schools grade is shown separately in the Schools card above.
Census & demographics
- Population (ZIP)
- 8,061
Population outlook (Pike County) Hauer SSP2
- Today (2025)
- 53,548 people
- By 2030
- 51,622 · -3.6%
- By 2040
- 46,490 · -13.2%
- By 2050
- 40,372 · -24.6%
- By 2075
- 31,951 · -40.3%
- By 2100
- 26,821 · -49.9%
Race, ethnicity, and origin ACS 2023
- Neighborhood character
- Predominantly White (85%)
- Race & ethnicity
- White 85% Hispanic / Latino 10% Two or more races 8%
- Hispanic origin (detail)
- Puerto Rican 5%
- Common ancestry
- Scotch-Irish 6% Romanian 6% Iranian 4%
- Foreign-born
- 9% · Canada, Jamaica
- Languages at home
- 86% English-only · Spanish 6% Russian/Polish/Slavic 5% Other Indo-European 2%
Political lean MEDSL · Pike
- 2024 margin
- Strong R (+24.1) · D 37.6% · R 61.6%
- 2008→2024 swing
- -19.8pp toward R · 2008: -4.2pp · 2024: -24.1pp
- All cycles
- 2024: R+24.1 2020: R+19.0 2016: R+26.0 2012: R+11.0 2008: R+4.2
Not yet ingested
- Civics
- —
Market trends
- HPI YoY
- ▲ 38.13%
- Current HPI
- 248.4494
- Rent YoY
- —
- Metro
- —
- State GDP YoY
- ▲ 1.68%
- F500 in state
- 34
Industry mix (Fortune 500 HQ in PA)
| Industry | F500 HQs | Revenue |
|---|---|---|
| Healthcare | 2 | $309B |
|
||
| Insurance | 2 | $27B |
|
||
| Telecommunications / Media | 1 | $124B |
|
||
| Industrial Distribution | 1 | $22B |
|
||
| Financial Services | 1 | $20B |
|
||
| Chemicals / Materials | 1 | $18B |
|
||
Price history
+95.7% since first listed4 events — show timeline
- 2026-05-27 Listed $135,000 PMAR
- 2014-08-04 Sold (Public Records) $68,085 Public Records
- 2014-07-25 Sold (MLS) $68,065 PWMLS
- 2012-07-06 Listed $69,000 PWMLS
Property tax history
+2.4%/yrLatest (2026): $2,798 · +1.5% YoY. Source: county tax records.
Cash-flow waterfall
monthlySold comps — $/sqft
last 12 mo · ≤1 miLoading sold comps…