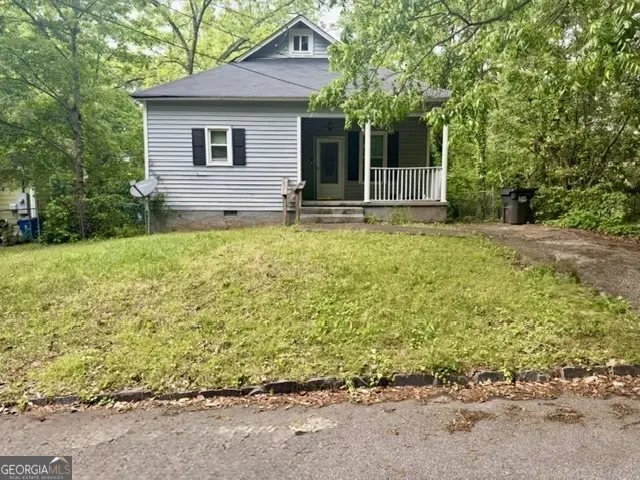
1821 E Farris Ave · East Point, GA
Flood risk 1/10 · Minimal
- FEMA flood zone
- X (unshaded)
- Chance of flooding over 30 yrs
- 0.0%
- Est. flood insurance / yr
- $473 – $860
Fire risk 1/10 · Minimal
- Est. fire insurance / yr
- $963 – $1,789
Heat risk 5/10 · Moderate
- Hot days now (above 103°F)
- 6 days/yr
- Hot days in 30 yrs
- 16 days/yr
Wind risk 6/10 · Moderate
- Chance of severe wind over 30 yrs
- 27.0%
Air-quality risk 4/10 · Minor
- Unhealthy air days now
- 4 days/yr
- Unhealthy air days in 30 yrs
- 6 days/yr
Risk factors via First Street. Map © Google.
Why this score? — see what drove the C- grade
The composite is a weighted blend of 9 inputs, each scored 0–100. Each bar is that input's sub-score; the figure is the points it added to the 100-point composite (weight × sub-score).
- Cash flow +16.6/30.0
- ARV discount +15.0/15.0
- DSCR +5.1/10.0
- 1% rule +4.5/10.0
- Schools +4.5/10.0
- Livability +3.6/5.0
- Rent growth +2.8/5.0
- Condition / age +2.5/5.0
- Appreciation +0.0/10.0
$200,000
🖨 Deal sheet (PDF) 📄 Offer letter ✓ Due diligence
Listing remarks MLS
Hi, investors or cash buyers looking for a renovation project. Situated on a residential lot with convenient access to major roadways, shopping, dining, and Hartsfield-Jackson Airport. The home will require updates and repairs, while presenting an opportunity to add value. Sold as-is. Please review all MLS remarks for details and instructions before submitting offers to the listing agent.
Key facts
- Residential lot
- Convenient access
- Major roadways
Tags
Neighborhood map
What this means for you Summary
Snapshot
- This is a 2-bed/2.0-bath single-family listed at $200k.
Deal economics
- At list price, monthly cash flow is $121 ($1k/yr) — positive.
- The deal already cash-flows at list — no discount required.
- To meet the 1% rule (rent ≥ 1% of price), the offer needs to be $190k (4.9% below list).
- Recommended offer: $190k (4.9% below list) — sets the bar for 1% rule.
- Cap rate 7.0% vs local median 5.1% in East Point — top-decile yield for the area; either an underpriced asset or a hidden risk that comps aren't pricing in. Stress-test before assuming the spread holds.
Location & tenants
- Location reads 72/100 on livability (#72 in GA) — a middle-class / working-renter tenant base. Strengths: commute A+, cost of living A+, housing A+; Watch: employment D+, crime F, amenities F.
- Fulton County (suburban): math 49% / reading 53% proficiency, ranked #12 of 174 in GA (top 7%) — acceptable for families but not a draw, mixed tenant base, ~2y average lease.
- Zoned schools: Amana Academy School (math 47% / reading 52%, grade D, #264 of 1,228 statewide, top 23%, 731 students, 30% FRL, charter); Paul D. West Middle School (math 17% / reading 17%, grade F, #381 of 470 statewide, top 82%, 803 students, 100% FRL); Tri-Cities High School (math 5% / reading 30%, grade F, #264 of 424 statewide, top 63%, 1,483 students, 100% FRL) — zoned schools average 77% FRL vs 41% district-wide (35 pts higher); higher-poverty schools than district average — tighter screening recommended.
- Zoned-school proficiency averages 28% at this address vs 51% district-wide (-23 pts) — the specific schools serving this property underperform the Fulton County average; the district grade overstates school quality for this exact location.
- Market conditions: Rents rising (+1.4%/yr); 295 active listings in the ZIP; 40 comparable units currently listed for rent nearby; rentals at typical pace (median 26d on market — plan ~3-4 weeks tenant-placement turnaround); 45% of comp listings sitting > 30 days — soft ceiling on asking rent; 11,565 units permitted in Fulton County in 2024 (8,159 in 5+ unit buildings).
Forward outlook
- Local home prices are declining (-3.0%/yr); year-one equity from $1k of loan paydown is wiped out by about $6k of value loss. Plan a longer hold.
- Fulton County population projected at +38% by 2050 — long-run rental-demand tailwind backs the buy-and-hold thesis.
Negotiation context
- It's been on market 29 days — a 2% lower offer ($197k) is reasonable based on typical stale-listing flexibility.
- 2 sale attempts since 18y ago with the ask held roughly flat each time — persistent listings suggest the price (not the market) is what's stuck; bring a comps-based counter.
- Current owner paid $14k; list at $200k implies a 1381% gain — meaningful room to come down on a strong offer.
Risks & watch-outs
- Watch-outs: built in 1920 — expect roof / HVAC / electrical / plumbing capex.
- Climate carrying-cost: major wind risk, 27% chance of damaging wind over 30y; extreme-heat days projected 6→16/yr by 2055 (HVAC capex compounding) — expect insurance premiums to compound above CPI over the hold.
Questions for the listing agent
- Built in 1920 — when were the roof, HVAC, electrical panel, plumbing, and water heater last replaced?
- Is there a deadline driving the sale (1031 exchange, divorce, estate, relocation)? That informs how much negotiation room exists.
- Schools are F-rated, which usually means shorter tenancies and higher turnover. Who's the typical renter profile here, and what's been the actual vacancy rate?
- Crime grade is F in this area — have there been break-ins, vandalism, or insurance claims at this property in the last 3 years? What carrier currently insures it and at what premium?
- What's the average days-on-market for RENTAL listings here right now (not sales)? A rising rental-DOM trend means longer vacancies and softer asking-rent achievability than the comps imply.
- What's the recent tenant-quality profile in this submarket — average credit score on applications, eviction rate, late-payment / NSF rate, and stable-employment percentage? A property-management company in the area should have these aggregated.
- How much new for-sale + rental construction is in the pipeline within 1–3 miles? Heavy new supply typically softens prices + rents 12–24 months out; constrained supply supports both.
Investment metrics
- 1% rule
- 0.95% ✗
- Cap rate
- 7.02%
- Cash-on-cash
- 2.58%
- DSCR
- 1.11
- GRM
- 8.8
CMA / ARV
- ARV (on-the-fly)
- $285,012
- Comps found
- 12
Show comp detail 12 sales within ~0.75 mi
| Address | Dist | Beds/Ba | Sqft | Sold | Price | $/sf | Match |
|---|---|---|---|---|---|---|---|
| 1845 Vesta Ave | 0.14mi | 3/2.0 (+1) | 1,581 (+5%) | 6mo | $289,000 | $183 | 76 |
| 1815 Dunlap Ave | 0.05mi | 3/2.0 (+1) | 1,386 (-8%) | 9mo | $375,000 | $271 | 72 |
| 2949 Pearl St | 0.38mi | 2/2.0 | 1,410 (-6%) | 2mo | $186,500 | $132 | 69 |
| 3120 Church St | 0.13mi | 2/2.0 | 1,380 (-8%) | 13mo | $405,000 | $293 | 69 |
| 3200 Lowndes St | 0.19mi | 3/2.0 (+1) | 1,661 (+10%) | 4mo | $275,000 | $166 | 66 |
| 3081 Semmes St | 0.11mi | 3/2.5 (+1) | 1,690 (+12%) | 7mo | $155,000 | $92 | 62 |
| 1866 Thompson Ave | 0.65mi | 3/2.0 (+1) | 1,475 (-2%) | 1mo | $279,000 | $189 | 60 |
| 2852 Kimmeridge Dr | 0.60mi | 3/1.0 (+1) | 1,459 (-3%) | 4mo | $195,000 | $134 | 54 |
| 3472 Victoria St | 0.66mi | 3/1.5 (+1) | 1,476 (-2%) | 10mo | $350,000 | $237 | 51 |
| 1759 Thompson Ave | 0.66mi | 3/1.0 (+1) | 1,420 (-6%) | 1mo | $306,000 | $215 | 50 |
| 1841 Thompson Ave | 0.67mi | 2/2.0 | 1,357 (-10%) | 12mo | $297,100 | $219 | 42 |
| 2907 Cloverhurst Dr | 0.58mi | 3/2.0 (+1) | 1,703 (+13%) | 8mo | $186,000 | $109 | 40 |
Match score weights: distance 35% · size 25% · config 20% · recency 20%. Top-matched comps best support the ARV.
Projected returns pro-forma
-3.0% appreciation · 1.35% rent growth · sell at horizon
- IRR
- -14.1%
- Equity multiple
- 0.50×
- Total profit
- $-27,807
- Equity at exit
- $29,821
- IRR
- -8.2%
- Equity multiple
- 0.53×
- Total profit
- $-26,542
- Equity at exit
- $17,292
Cash invested: $56,000 (down + closing). Projections, not guarantees.
Landlord ↔ Tenant lean methodology
- Overall (STATE)
- 90 Strongly Landlord-Friendly
- State Georgia
- 90 Strongly Landlord-Friendly · R+3
- County
- — inherits STATE
- City
- — inherits STATE
ZIP-level market 30344
- Home prices YoY
- -31.0%
- Rents YoY
- 1.4%
- Active inventory
- 295
- Price-to-rent
- 8.8×
Monthly cashflow live
- Estimated rent
- $1,902 high interval (Pro) →
- Mortgage (P&I)
- −$1,049
- Tax est. 1.5%
- −$250 /mo · $3,000/yr
- Insurance
- −$83
- HOA
- −$0
- Vacancy / Maint / Mgmt
- −$399
- Net cashflow
- $121
Break-even live
Sensitivity live
| Price | -10% $259 | -5% $190 | +0% $121 | +5% $51 | +10% $-18 |
|---|---|---|---|---|---|
| Rent | -10% $-30 | -5% $45 | +0% $121 | +5% $196 | +10% $271 |
| Rate | -1.0pp $221 | -0.5pp $171 | base $121 | +0.5pp $69 | +1.0pp $16 |
UW: 25.0% down · 7.5% · 30yr · 1.5% tax · 5.0% vac · 8.0% maint · 8.0% mgmt
Financing live
Cash to close
- Down payment
- $50,000
- Closing costs
- $6,000
- Reserves months
- —
- Total cash needed
- —
Loan-product check · same deal, 3 products live
Conventional
25% down · 7.5% · 30yr
- Down + closing
- —
- Monthly P&I
- —
- Monthly cashflow
- —
- DSCR
- —
- Eligible?
- —
Personal DTI + credit; lowest rate.
DSCR
20% down · 8.5% · 30yr
- Down + closing
- —
- Monthly P&I
- —
- Monthly cashflow
- —
- DSCR
- —
- Eligible?
- —
No personal income docs; deal must DSCR.
Hard money
10% down · 12.0% · 12mo
- Down + closing
- —
- Monthly P&I
- —
- Monthly cashflow
- —
- DSCR
- —
- Eligible?
- —
Short-term bridge; refi at stabilization.
Rent comps 40 comps
| Address | Beds | Baths | Sqft | Rent | $/sqft | DOM | Units | Dist |
|---|---|---|---|---|---|---|---|---|
| 1827 Dunlap Ave Atlanta, GA | 3.0 | 2.0 | 1250 | $3,200 | $2.56 | 45d | 1 | 0.08mi |
| 3181 Church St Unit A Atlanta, GA | 2.0 | 2.0 | 1646 | $1,750 | $1.06 | 23d | 1 | 0.10mi |
| 3181 Church St Unit A Atlanta, GA | 2.0 | 2.0 | 1646 | $1,750 | $1.06 | 0d | 1 | 0.10mi |
| 1863 Phillips Ave Atlanta, GA | 3.0 | 2.5 | 1470 | $2,115 | $1.44 | 12d | 1 | 0.11mi |
| 3241 Turner St Unit 1 East Point, GA | 2.0 | 1.5 | 1200 | $1,295 | $1.08 | 45d | 1 | 0.14mi |
| 1875 Dunlap Ave Atlanta, GA | 2.0 | 1.0 | 1650 | $1,875 | $1.14 | 45d | 1 | 0.14mi |
| 1809 Vesta Ave Atlanta, GA | 2.0 | 1.0 | 1768 | $2,900 | $1.64 | 45d | 1 | 0.15mi |
| 1845 Vesta Ave Atlanta, GA | 3.0 | 2.0 | 1581 | $2,128 | $1.35 | 26d | 1 | 0.16mi |
| 1755 Lyle Ave Atlanta, GA | 3.0 | 2.5 | 1973 | $2,600 | $1.32 | 20d | 1 | 0.27mi |
| 1861 Lyle Ave Unit 2 Atlanta, GA | 2.0 | 2.0 | 1250 | $1,600 | $1.28 | 45d | 1 | 0.27mi |
| 1717 W Taylor Ave Atlanta, GA | 3.0 | 2.5 | 2100 | $1,791 | $0.85 | 14d | 1 | 0.30mi |
| 1804 Mercer Ave Atlanta, GA | 3.0 | 2.0 | 2250 | $2,600 | $1.16 | 45d | 1 | 0.37mi |
| 3100 Larose St Atlanta, GA | 3.0 | 1.0 | 1121 | $1,600 | $1.43 | 45d | 1 | 0.37mi |
| 3158 Cloverhurst Dr Atlanta, GA | 3.0 | 2.0 | 1196 | $1,700 | $1.42 | 45d | 1 | 0.43mi |
| 1744 Cambridge Ave #2 Atlanta, GA | 2.0 | 1.5 | 1100 | $1,599 | $1.45 | 45d | 1 | 0.60mi |
| 1744 Cambridge Ave College Park, GA | 2.0 | 1.5 | 1100 | $1,600 | $1.45 | 7d | 2 | 0.60mi |
| 3184 Pollard St Atlanta, GA | 3.0 | 2.0 | 1400 | $1,800 | $1.29 | 45d | 1 | 0.63mi |
| 3276 Elm St Atlanta, GA | 3.0 | 1.0 | 1250 | $1,685 | $1.35 | 3d | 1 | 0.67mi |
| 2952 Holland Ct Atlanta, GA | 1.0 | 1.0 | 1400 | $675 | $0.48 | 3d | 1 | 0.68mi |
| 3544 College St Atlanta, GA | 3.0 | 2.5 | 2000 | $2,650 | $1.32 | 3d | 1 | 0.81mi |
| 1914 Montrose Dr Atlanta, GA | 2.0 | 1.0 | 1216 | $2,000 | $1.64 | 45d | 1 | 0.83mi |
| 3447 Pierce St Atlanta, GA | 2.0 | 1.0 | 1560 | $1,345 | $0.86 | 45d | 1 | 0.83mi |
| 1932 Montrose Dr Atlanta, GA | 3.0 | 1.0 | 1200 | $1,750 | $1.46 | 20d | 1 | 0.84mi |
| 3128 Chateau Blvd Unit A-3143 East Point, GA | 2.0 | 1.0 | 1100 | $1,250 | $1.14 | 0d | 1 | 0.84mi |
| 3128 Chateau Blvd East Point, GA | 1.0–2.0 | 1.0 | 1000 | $1,395 | $1.40 | 17d | 12 | 0.84mi |
| 3483 Napoleon St Atlanta, GA | 3.0 | 2.0 | 1749 | $2,589 | $1.48 | 45d | 1 | 0.85mi |
| 1493 Ashley Way Atlanta, GA | 3.0 | 2.5 | 1646 | $1,900 | $1.15 | 45d | 1 | 0.89mi |
| 1656 Ware Ave Atlanta, GA | 3.0 | 2.0 | 1866 | $2,150 | $1.15 | 45d | 1 | 0.89mi |
| 3030 Remington St Atlanta, GA | 3.0 | 1.0 | 1100 | $1,200 | $1.09 | 26d | 1 | 0.95mi |
| 1347 Washington Rd Unit A East Point, GA | 2.0 | 1.0 | 1250 | $1,049 | $0.84 | 45d | 1 | 0.96mi |
| 3437 Harris Dr Atlanta, GA | 3.0 | 1.0 | 1556 | $1,650 | $1.06 | 45d | 1 | 0.97mi |
| 3031 Remington St Atlanta, GA | 3.0 | 2.0 | 1369 | $1,200 | $0.88 | 20d | 1 | 0.98mi |
| 1377 Pine Ave Atlanta, GA | 3.0 | 2.0 | 1100 | $1,675 | $1.52 | 23d | 1 | 1.01mi |
| 1698 Temple Ave Atlanta, GA | 3.0 | 3.0 | 1608 | $2,500 | $1.55 | 26d | 1 | 1.02mi |
| 2627 N Church St East Point, GA | 2.0–3.0 | 1.0–2.0 | 1020 | $1,289 | $1.26 | 23d | 2 | 1.03mi |
| 1658 Temple Ave Atlanta, GA | 3.0 | 2.5 | 1692 | $2,295 | $1.36 | 26d | 1 | 1.04mi |
| 1244 Calhoun Ave Atlanta, GA | 3.0 | 1.5 | 1072 | $1,673 | $1.56 | 45d | 1 | 1.08mi |
| 1777 Harvard Ave Atlanta, GA | 1.0–2.0 | 1.0–2.0 | 832 | $1,850 | $2.22 | 3d | 12 | 1.11mi |
| 2756 Plantation Dr Atlanta, GA | 3.0 | 2.0 | 1119 | $1,950 | $1.74 | 22d | 1 | 1.13mi |
| 3625 Hawthorne Ter Atlanta, GA | 3.0 | 3.5 | 2000 | $2,500 | $1.25 | 19d | 1 | 1.14mi |
Listing history 20 events
-
2026-06-21days on market $200,000 Active 29 DOM
-
2026-06-18days on market $200,000 Active 26 DOM
-
2026-06-17days on market $200,000 Active 25 DOM
-
2026-06-16days on market $200,000 Active 24 DOM
-
2026-06-15days on market $200,000 Active 23 DOM
-
2026-06-13days on market $200,000 Active 21 DOM
-
2026-06-09days on market $200,000 Active 17 DOM
-
2026-06-08days on market $200,000 Active 16 DOM
-
2026-06-07statusdays on market $200,000 Active 15 DOM
-
2026-06-04days on market $200,000 New 12 DOM
-
2026-06-03days on market $200,000 New 11 DOM
-
2026-06-01days on market $200,000 New 9 DOM
-
2026-05-31days on market $200,000 New 8 DOM
-
2026-05-23$200,000 New 397-char remark
Show marketing remark (397 chars)
Hi, investors or cash buyers looking for a renovation project. Situated on a residential lot with convenient access to major roadways, shopping, dining, and Hartsfield-Jackson Airport. The home will require updates and repairs, while presenting an opportunity to add value. Sold as-is. Please review all MLS remarks for details and instructions before submitting offers to the listing agent.
-
2008-12-17soldstatus $13,500 168-char remark
Show marketing remark (168 chars)
Investor special!! Bring your updating ideas to make this a charmer! Potential rental income! Convenient to interstate. Sold as is. See private remarks to submit offer.
-
2008-10-28$19,999 168-char remark
Show marketing remark (168 chars)
Investor special!! Bring your updating ideas to make this a charmer! Potential rental income! Convenient to interstate. Sold as is. See private remarks to submit offer.
-
2007-10-11soldstatus $238,000
-
2007-03-16soldstatus $185,000
-
2000-07-27soldstatus $85,000
-
1981-11-05soldstatus $17,000
ⓘ Source: listings_history table (triggers on properties + properties_extension) + one-shot
backfill from property_details.listing_events for pre-trigger history.
Climate risk First Street
- Flood 1/10 Low FEMA zone X (unshaded) · 0% chance over 30 yrs
- Wildfire 1/10 Low
- Heat 5/10 Major 6 d/yr ≥103°F today · 16 d/yr by 30 yrs out
- Wind 6/10 Major 27% chance of damaging wind over 30 yrs
- Air quality 4/10 Moderate 4 unhealthy d/yr today · 6 by 30 yrs out
Nearby sold comps map
Loading sold comps map…
Walkable amenities ~0.75 mi
Loading nearby amenities…
Taxation est. · year 1
- Rental income
- $22,826
- − Mortgage interest
- −$11,203
- − Property taxes
- −$3,000
- − Insurance
- −$1,000
- − Repairs & maintenance
- −$1,826
- − Management
- −$1,826
- − Depreciation
- −$5,818
- Taxable loss
- −$1,847
- Est. tax savings @ 24.0%
- +$443
- After-tax cash flow
- $1,890/yr
For passive investors: Depreciation is non-cash, so a rental often shows a tax loss while cash-flowing — sheltering income. Rental losses are passive: they offset passive income freely, and up to $25,000/yr can offset ordinary (W-2) income if you actively participate and your MAGI is under $100k (phasing out to $0 by $150k); unused losses carry forward. On sale, claimed depreciation is recaptured at up to 25%, and gains may owe capital-gains tax (a 1031 exchange can defer both). Figures are a year-1 estimate at your 24.0% rate — not tax advice; consult a CPA.
Schools (NCES district)
- District
- Fulton County
- NCES district ID
- 1302280
- Math proficiency
- 49% ▼ -2.00%
- Reading proficiency
- 53% ▬ 0.00%
- Median HH income
- $68,035
- Composite
- 45.33/100
- National rank
- #2640
- State rank
- #12 of 174 in GA
Livability — East Point
- Score
- 72/100
- State rank
- #72
- US rank
- #6314
Category grades
Schools grade is shown separately in the Schools card above.
Census & demographics
- Census place
- East Point, GA
- County
- Fulton County · 1,094,430 people
- City population
- 35,456
- Metro
- Atlanta-Sandy Springs-Alpharetta, GA
- Population (ZIP)
- 35,456
- Household income
- $68,380
- Rent vs Own
- Severe rent burden
- 2226.0
Population outlook (Fulton County) Hauer SSP2
- Today (2025)
- 1,203,707 people
- By 2030
- 1,299,706 · +8.0%
- By 2040
- 1,488,256 · +23.6%
- By 2050
- 1,664,580 · +38.3%
- By 2075
- 2,036,072 · +69.2%
- By 2100
- 2,222,402 · +84.6%
Race, ethnicity, and origin ACS 2023
- Neighborhood character
- Predominantly Black (74%)
- Race & ethnicity
- Black 74% White 11% Hispanic / Latino 11% Two or more races 6%
- Hispanic origin (detail)
- Mexican 7% Puerto Rican 1%
- Common ancestry
- Italian 1% Swiss 1% Russian 1%
- Foreign-born
- 6% · Canada, Jamaica
- Languages at home
- 87% English-only · Spanish 9% Other Indo-European 1% German/W. Germanic 1%
Political lean MEDSL · Fulton
- 2024 margin
- Solid D (+44.9) · D 71.9% · R 27.0% · Other 1.1%
- 2008→2024 swing
- +9.8pp toward D · 2008: 35.0pp · 2024: 44.9pp
- All cycles
- 2024: D+44.9 2020: D+46.4 2016: D+42.1 2012: D+29.6 2008: D+35.0
Not yet ingested
- Civics
- —
Market trends
- HPI YoY
- ▼ -113.15%
- Current HPI
- 251.7916
- Rent YoY
- ▲ 1.35%
- Metro
- Atlanta-Sandy Springs-Alpharetta, GA
- State GDP YoY
- ▲ 2.66%
- F500 in state
- 28
Industry mix (Fortune 500 HQ in GA)
| Industry | F500 HQs | Revenue |
|---|---|---|
| Paper / Packaging | 2 | $29B |
|
||
| Retail | 1 | $160B |
|
||
| Transportation / Logistics | 1 | $91B |
|
||
| Airlines | 1 | $62B |
|
||
| Consumer Goods | 1 | $47B |
|
||
| Utilities | 1 | $25B |
|
||
Price history
+1076.5% since first listed7 events — show timeline
- 2026-05-23 Listed $200,000 GAMLS
- 2008-12-17 Sold (MLS) $13,500 FMLS
- 2008-10-28 Listed $19,999 FMLS
- 2007-10-11 Sold (Public Records) $238,000 Public Records
- 2007-03-16 Sold (Public Records) $185,000 Public Records
- 2000-07-27 Sold (Public Records) $85,000 Public Records
- 1981-11-05 Sold (Public Records) $17,000 Public Records
Property tax history
-18.6%/yrLatest (2021): $110 · +0.0% YoY. Source: county tax records.
Cash-flow waterfall
monthlySold comps — $/sqft
last 12 mo · ≤1 miLoading sold comps…