 Multi-family
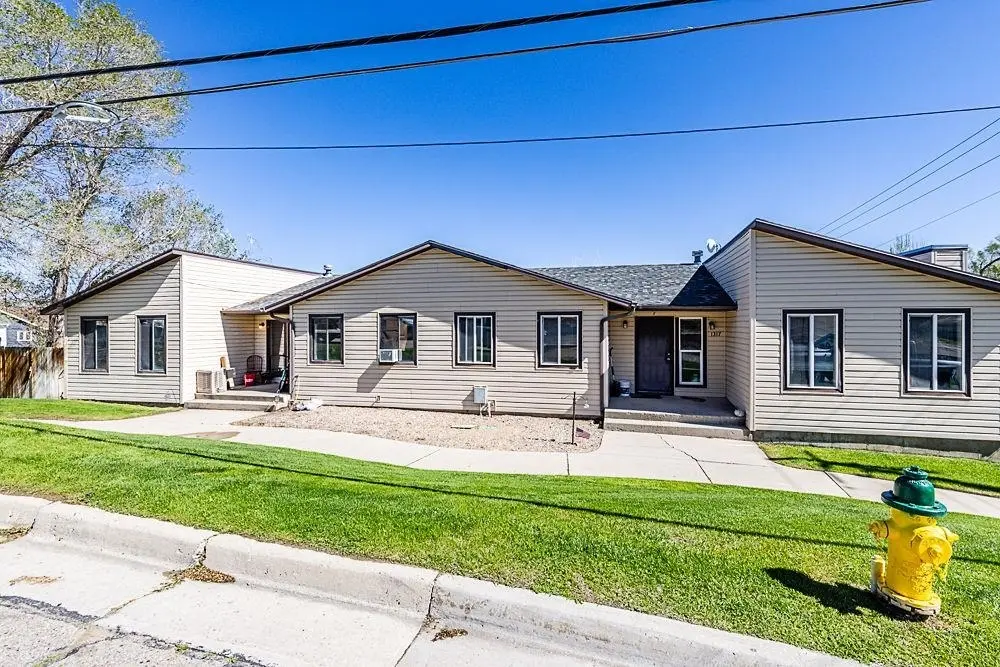
1317A Mccabe St · Rock Springs, WY
Flood risk 4/10 · Minor
- FEMA flood zone
- X
- Chance of flooding over 30 yrs
- 0.24%
- Est. flood insurance / yr
- $473 – $860
Fire risk 5/10 · Moderate
- Est. fire insurance / yr
- $564 – $1,046
Heat risk 2/10 · Minimal
- Hot days now (above 87°F)
- 6 days/yr
- Hot days in 30 yrs
- 16 days/yr
Wind risk 1/10 · Minimal
- Chance of severe wind over 30 yrs
- —
Air-quality risk 1/10 · Minimal
- Unhealthy air days now
- 0 days/yr
- Unhealthy air days in 30 yrs
- 0 days/yr
Risk factors via First Street. Map © Google.
Why this score? — see what drove the C grade
The composite is a weighted blend of 9 inputs, each scored 0–100. Each bar is that input's sub-score; the figure is the points it added to the 100-point composite (weight × sub-score).
- Cash flow +25.1/30.0
- DSCR +8.2/10.0
- ARV discount +7.5/15.0
- 1% rule +5.7/10.0
- Schools +4.2/10.0
- Livability +3.5/5.0
- Condition / age +2.5/5.0
- Rent growth +2.0/5.0
- Appreciation +0.0/10.0
$315,000
🖨 Deal sheet 📄 Offer letter ✓ Due diligence
Multi-family units
County records classify this as Multi-Family (2-4 Unit). Listing-text estimate: 1 unit. estimate disagrees with records
Key facts
- Large deck
- Private bath
- Gas fireplace
Tags
Property features AI
Exterior
- Parking: Off-street parking; Has garage
- Utilities: Public water; Public sewer; Natural gas available
- Home design: Duplex (residential income property)
- Construction: Vinyl siding
- Exterior features: Deck
Interior
- Kitchen: Dishwasher; Refrigerator; Range; Oven
- Interior features: Dishwasher; Refrigerator; Range; Oven
Neighborhood map
What this means for you Summary
Snapshot
- This is a 6-bed/4.0-bath multifamily listed at $315k.
Deal economics
- At list price, monthly cash flow is $692 ($8k/yr) — positive.
- The deal already cash-flows at list — no discount required.
- Meets the 1% rule at list price ($3k rent vs $315k).
- Cap rate 8.9% vs local median 2.9% in Rock Springs — top-decile yield for the area; either an underpriced asset or a hidden risk that comps aren't pricing in. Stress-test before assuming the spread holds.
Location & tenants
- Location reads 70/100 on livability (#35 in WY) — a middle-class / working-renter tenant base. Strengths: cost of living A+, housing A+, crime A; Watch: schools C-, amenities F, commute F.
- Sweetwater County School District #1 (town): math 44% / reading 49% proficiency, ranked #31 of 41 in WY (top 76%) — families likely to look elsewhere, expect single-tenant / working-renter base with shorter leases.
- Market conditions: Rents soft (-2.1%/yr); 177 active listings in the ZIP; 47 units permitted in Sweetwater County in 2024 (0 in 5+ unit buildings).
- At $3,378/mo this rent would consume 58% of the median local household income ($70k/yr) (locally 609% of renters already pay >50% of income on rent) — very limited rent-growth headroom before tenants either downsize or default.
Forward outlook
- Local home prices are declining (-3.0%/yr); year-one equity from $2k of loan paydown is wiped out by about $9k of value loss. Plan a longer hold.
- Sweetwater County population projected at +12% by 2050 — modest demand growth; plan on rents tracking national, not racing it.
Negotiation context
- Only 2 days on market — expect competitive offers; lowballing is unlikely to land.
Risks & watch-outs
- Climate carrying-cost: moderate wildfire risk — expect insurance premiums to compound above CPI over the hold.
Questions for the listing agent
- Is there a deadline driving the sale (1031 exchange, divorce, estate, relocation)? That informs how much negotiation room exists.
- What's the average days-on-market for RENTAL listings here right now (not sales)? A rising rental-DOM trend means longer vacancies and softer asking-rent achievability than the comps imply.
- What's the recent tenant-quality profile in this submarket — average credit score on applications, eviction rate, late-payment / NSF rate, and stable-employment percentage? A property-management company in the area should have these aggregated.
- How much new apartment / multifamily construction is in the pipeline within 1–3 miles? Heavy new supply (>2% of stock underway) typically softens rents 12–24 months out; light construction supports rent growth.
Investment metrics
- 1% rule
- 1.07% ✓
- Cap rate
- 8.93%
- Cash-on-cash
- 9.42%
- DSCR
- 1.42
- GRM
- 7.8
CMA / ARV
No comps found within radius.
Projected returns pro-forma
-3.0% appreciation · 0.0% rent growth · sell at horizon
- IRR
- -5.3%
- Equity multiple
- 0.81×
- Total profit
- $-16,917
- Equity at exit
- $46,968
- IRR
- 0.6%
- Equity multiple
- 1.04×
- Total profit
- $3,500
- Equity at exit
- $27,235
Cash invested: $88,200 (down + closing). Projections, not guarantees.
Landlord ↔ Tenant lean methodology
- Overall (STATE)
- 90 Strongly Landlord-Friendly
- State Wyoming
- 90 Strongly Landlord-Friendly · R+25
- County
- — inherits STATE
- City
- — inherits STATE
ZIP-level market 82901
- Rents YoY
- -2.1%
- Active inventory
- 177
- Price-to-rent
- 23.3×
Monthly cashflow live
- Estimated rent
- $3,378 medium interval (Pro) →
- Mortgage (P&I)
- −$1,652
- Tax from tax record
- −$193 /mo · $2,317/yr
- Insurance
- −$131
- HOA
- −$0
- Vacancy / Maint / Mgmt
- −$709
- Net cashflow
- $692
Break-even live
3-unit breakdown (identical units grouped — click to expand)
| Units | Beds | Baths | Est. rent |
|---|---|---|---|
| 3× units | 2 | 1 | $3,378 |
| #1 | 2 | 1 | $1,126 |
| #2 | 2 | 1 | $1,126 |
| #3 | 2 | 1 | $1,126 |
| Total (3 units) | $3,378 | ||
UW: 25.0% down · 7.5% · 30yr · 1.5% tax · 5.0% vac · 8.0% maint · 8.0% mgmt
Financing live
Cash to close
- Down payment
- $78,750
- Closing costs
- $9,450
- Reserves months
- —
- Total cash needed
- —
Loan-product check · same deal, 3 products live
Conventional
25% down · 7.5% · 30yr
- Down + closing
- —
- Monthly P&I
- —
- Monthly cashflow
- —
- DSCR
- —
- Eligible?
- —
Personal DTI + credit; lowest rate.
DSCR
20% down · 8.5% · 30yr
- Down + closing
- —
- Monthly P&I
- —
- Monthly cashflow
- —
- DSCR
- —
- Eligible?
- —
No personal income docs; deal must DSCR.
Hard money
10% down · 12.0% · 12mo
- Down + closing
- —
- Monthly P&I
- —
- Monthly cashflow
- —
- DSCR
- —
- Eligible?
- —
Short-term bridge; refi at stabilization.
Listing history 2 events
-
2026-06-05days on market $315,000 Active 2 DOM
-
2026-06-03$315,000 Active 1 DOM
ⓘ Source: listings_history table (triggers on properties + properties_extension) + one-shot
backfill from property_details.listing_events for pre-trigger history.
Tax reassessment forecast WY · Resets to sale price
- Current annual tax
- $2,317 · $193/mo
- Projected year-2 tax
- $2,317 · $193/mo
- Expected delta
- $0/yr ($0/mo · 0.0%)
ⓘ Screening estimate from a state-policy table — verify with the county assessor before closing.
Climate risk First Street
- Flood 4/10 Moderate FEMA zone X · 24% chance over 30 yrs
- Wildfire 5/10 Major
- Heat 2/10 Low 6 d/yr ≥87°F today · 16 d/yr by 30 yrs out
- Wind 1/10 Low
- Air quality 1/10 Low 0 unhealthy d/yr today · 0 by 30 yrs out
Nearby sold comps map
Loading sold comps map…
Walkable amenities ~0.75 mi
Loading nearby amenities…
Taxation est. · year 1
- Rental income
- $40,536
- − Mortgage interest
- −$17,645
- − Property taxes
- −$2,317
- − Insurance
- −$1,575
- − Repairs & maintenance
- −$3,243
- − Management
- −$3,243
- − Depreciation
- −$9,164
- Taxable income
- $3,350
- Est. tax owed @ 24.0%
- −$804
- After-tax cash flow
- $7,505/yr
For passive investors: Depreciation is non-cash, so a rental often shows a tax loss while cash-flowing — sheltering income. Rental losses are passive: they offset passive income freely, and up to $25,000/yr can offset ordinary (W-2) income if you actively participate and your MAGI is under $100k (phasing out to $0 by $150k); unused losses carry forward. On sale, claimed depreciation is recaptured at up to 25%, and gains may owe capital-gains tax (a 1031 exchange can defer both). Figures are a year-1 estimate at your 24.0% rate — not tax advice; consult a CPA.
Schools (NCES district)
- District
- Sweetwater County School District #1
- NCES district ID
- 5605302
- Math proficiency
- 44% ▼ -4.00%
- Reading proficiency
- 49% ▼ -3.00%
- Median HH income
- $68,679
- Composite
- 41.66/100
- National rank
- #3422
- State rank
- #31 of 41 in WY
Livability — Rock Springs
- Score
- 70/100
- State rank
- #35
- US rank
- #8016
Category grades
Schools grade is shown separately in the Schools card above.
Census & demographics
- Census place
- Rock Springs, WY
- County
- Sweetwater County · 27,198 people
- City population
- 27,198
- Metro
- Rock Springs, WY
- Population (ZIP)
- 27,198
- Household income
- $69,954
- Rent vs Own
- Severe rent burden
- 609.0
Population outlook (Sweetwater County) Hauer SSP2
- Today (2025)
- 48,212 people
- By 2030
- 49,664 · +3.0%
- By 2040
- 51,984 · +7.8%
- By 2050
- 54,005 · +12.0%
- By 2075
- 57,684 · +19.6%
- By 2100
- 57,857 · +20.0%
Race, ethnicity, and origin ACS 2023
- Neighborhood character
- Predominantly White (74%)
- Race & ethnicity
- White 74% Hispanic / Latino 19% Two or more races 9% Black 2% Native American 1%
- Hispanic origin (detail)
- Mexican 15%
- Common ancestry
- Italian 5% Lithuanian 2% Portuguese 2%
- Foreign-born
- 7% · Canada, Vietnam, Jamaica
- Languages at home
- 90% English-only · Spanish 9% Vietnamese 1%
Political lean MEDSL · Sweetwater
- 2024 margin
- Solid R (+53.2) · D 22.5% · R 75.7% · Other 1.8%
- 2008→2024 swing
- -25.7pp toward R · 2008: -27.5pp · 2024: -53.2pp
- All cycles
- 2024: R+53.2 2020: R+50.6 2016: R+53.5 2012: R+39.7 2008: R+27.5
Not yet ingested
- Civics
- —
Market trends
- HPI YoY
- ▼ -270.69%
- Current HPI
- 146.2451
- Rent YoY
- ▼ -2.15%
- Metro
- Rock Springs, WY
- State GDP YoY
- —
- F500 in state
- 0
Price history
1 event — show timeline
- 2026-06-01 Listed $315,000 WMLS
Property tax history
+3.2%/yrLatest (2025): $2,317 · +0.8% YoY. Source: county tax records.
Cash-flow waterfall
monthlySold comps — $/sqft
last 12 mo · ≤1 miLoading sold comps…