2115 6th #60 · Clarkston Heights-Vineland, WA
Flood risk 1/10 · Minimal
- FEMA flood zone
- X
- Chance of flooding over 30 yrs
- 0.0%
- Est. flood insurance / yr
- $507 – $1,088
Fire risk 3/10 · Minor
- Est. fire insurance / yr
- $604 – $1,122
Heat risk 4/10 · Minor
- Hot days now (above 100°F)
- 6 days/yr
- Hot days in 30 yrs
- 13 days/yr
Wind risk 1/10 · Minimal
- Chance of severe wind over 30 yrs
- —
Air-quality risk 8/10 · Major
- Unhealthy air days now
- 12 days/yr
- Unhealthy air days in 30 yrs
- 17 days/yr
Risk factors via First Street. Map © Google.
Why this score? — see what drove the B grade
The composite is a weighted blend of 9 inputs, each scored 0–100. Each bar is that input's sub-score; the figure is the points it added to the 100-point composite (weight × sub-score).
- Cash flow +30.0/30.0
- ARV discount +12.0/15.0
- DSCR +10.0/10.0
- 1% rule +8.9/10.0
- Schools +4.2/10.0
- Rent growth +2.5/5.0
- Livability +2.5/5.0
- Condition / age +2.5/5.0
- Appreciation +0.0/10.0
$99,000
🖨 Deal sheet (PDF) 📄 Offer letter ✓ Due diligence
Listing remarks
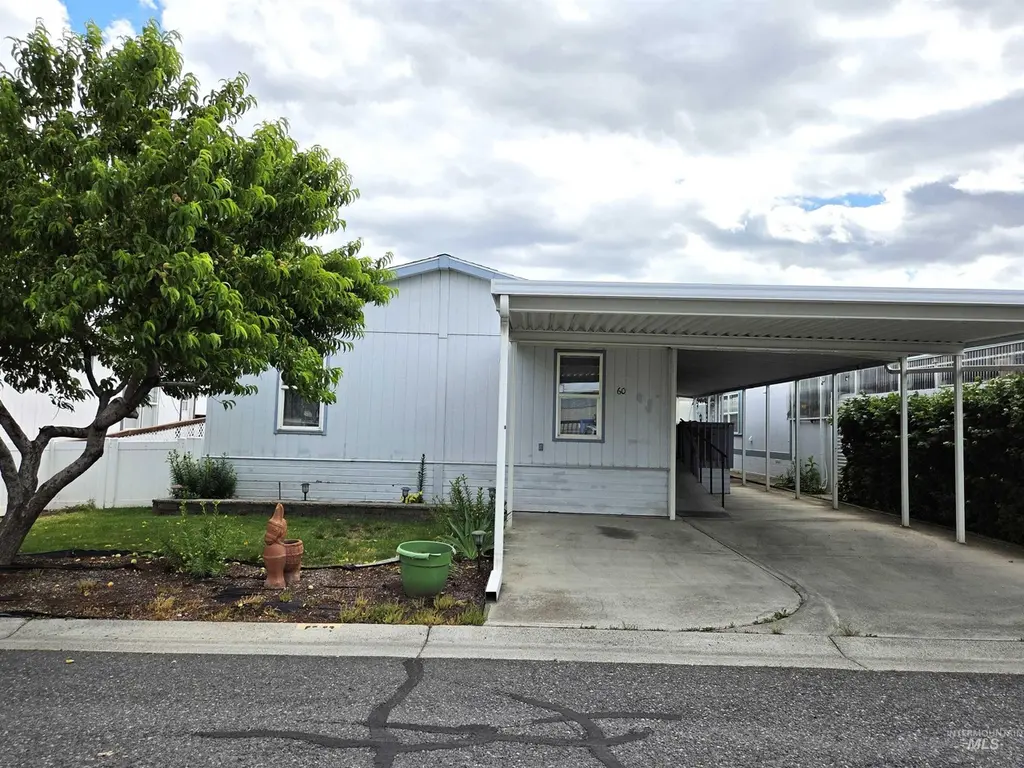
Choose easy living in this 55+ Community in Sunset Heights! This home features an updated kitchen with newer appliances, including a gas range. Enjoy sitting on your covered deck or use the large shed for all of your hobbies. Short distance to the community pool and club house where you can meet friends. Call today for your showing! Lot rent is $782, but $682 with auto pay. All buyers must be pre-approved by park management. Apply online at cres. quickapp. pro. Search for Sunset Heights.
Key facts
- Covered deck
- Community pool
- Updated kitchen
Tags
Property features AI
Finance
- HOA & community: Community pool; Located in a mobile home park; Senior (55+) community
Exterior
- Parking: Covered carport (1 space)
- Utilities: City water service; Sewer connected
- Home design: Mobile/manufactured home on a rented lot; Located in an over-55 community
- Construction: Built in 1998; Composition roof; Accessible approach with ramp; Bathroom grab bars
- Exterior features: Covered patio/deck; Garden; Automatic sprinkler system; Community pool
Interior
- Kitchen: Dishwasher; Gas range; Refrigerator
- Bedrooms: 3 bedrooms — all on the main level
- Bathrooms: 2 bathrooms
- Heating & cooling: Electric forced-air heating; Central air conditioning
- Interior features: Breakfast bar; Pantry; Skylight(s)
- Laundry & utility: Electric water heater
Neighborhood map
What this means for you Summary
Snapshot
- This is a 3-bed/2.0-bath manufactured listed at $99k.
Deal economics
- At list price, monthly cash flow is $453 ($5k/yr) — positive.
- The deal already cash-flows at list — no discount required.
- Meets the 1% rule at list price ($1k rent vs $99k).
- Cap rate 11.8% vs local median 1.5% in Clarkston Heights-Vineland — top-decile yield for the area; either an underpriced asset or a hidden risk that comps aren't pricing in. Stress-test before assuming the spread holds.
Location & tenants
- Location reads: area grade B — affects rentability + tenant quality, not the cash-flow math above.
- Clarkston School District (suburban): math 38% / reading 57% proficiency, ranked #172 of 291 in WA (top 59%) — families likely to look elsewhere, expect single-tenant / working-renter base with shorter leases.
- Zoned schools: Heights Elementary (361 students, 45% FRL); Lincoln Middle School (318 students, 60% FRL); Charles Francis Adams High School (753 students, 49% FRL) — zoned schools at 52% FRL track the district average.
- Market conditions: 250 active listings in the ZIP; 101 units permitted in Asotin County in 2024 (72 in 5+ unit buildings).
Forward outlook
- Local home prices are declining (-3.0%/yr); year-one equity from $684 of loan paydown is wiped out by about $3k of value loss. Plan a longer hold.
- Asotin County population projected to shrink 3% by 2050 — rents likely to lag national; underwrite the cash flow, not the appreciation.
- At projected returns (-3.0% appreciation + 3.0% rent growth), your $28k cash investment doubles in ~7 years — after that, you're playing with house money.
Negotiation context
- Only 13 days on market — expect competitive offers; lowballing is unlikely to land.
- 4 sale attempts since 9y ago with the ask held roughly flat each time — persistent listings suggest the price (not the market) is what's stuck; bring a comps-based counter.
Questions for the listing agent
- Is there a deadline driving the sale (1031 exchange, divorce, estate, relocation)? That informs how much negotiation room exists.
- What's the average days-on-market for RENTAL listings here right now (not sales)? A rising rental-DOM trend means longer vacancies and softer asking-rent achievability than the comps imply.
- What's the recent tenant-quality profile in this submarket — average credit score on applications, eviction rate, late-payment / NSF rate, and stable-employment percentage? A property-management company in the area should have these aggregated.
- How much new for-sale + rental construction is in the pipeline within 1–3 miles? Heavy new supply typically softens prices + rents 12–24 months out; constrained supply supports both.
Investment metrics
- 1% rule
- 1.39% ✓
- Cap rate
- 11.79%
- Cash-on-cash
- 19.62%
- DSCR
- 1.87
- GRM
- 6.0
CMA / ARV
- ARV (on-the-fly)
- $110,058
- Comps found
- 12
Show comp detail 12 sales within ~0.75 mi
| Address | Dist | Beds/Ba | Sqft | Sold | Price | $/sf | Match |
|---|---|---|---|---|---|---|---|
| 2115 6th Ave #7 | 0.00mi | 2/2.0 (-1) | 1,440 (+9%) | 2mo | $119,999 | $83 | 79 |
| 2115 6th Ave #51 | 0.00mi | 3/2.0 | 1,144 (-14%) | 1mo | $134,000 | $117 | 77 |
| 2115 6th Ave Unit #45 Ave | 0.00mi | 2/2.0 (-1) | 1,344 (+1%) | 21mo | $79,000 | $59 | 75 |
| 2115 6th Avenue #97 Ave | 0.00mi | 3/2.0 | 1,248 (-6%) | 21mo | $149,900 | $120 | 73 |
| 2015 6th Ave Unit 131A | 0.11mi | 3/2.0 | 1,150 (-13%) | 1mo | $75,000 | $65 | 72 |
| 2015 6th Ave Unit 161A | 0.11mi | 3/2.0 | 1,456 (+10%) | 10mo | $75,000 | $52 | 70 |
| 2115 6th Ave #18 | 0.00mi | 3/2.0 | 1,512 (+14%) | 11mo | $145,000 | $96 | 68 |
| 2015 6th Ave Unit 142 A | 0.11mi | 3/2.0 | 1,179 (-11%) | 11mo | $145,000 | $123 | 67 |
| 2115 6th Ave #14 | 0.00mi | 3/2.0 | 1,152 (-13%) | 16mo | $89,900 | $78 | 65 |
| 2015 6th Ave #308 | 0.10mi | 2/2.0 (-1) | 1,512 (+14%) | 3mo | $99,500 | $66 | 64 |
| 2015 6th Ave #11 | 0.11mi | 2/2.0 (-1) | 1,456 (+10%) | 13mo | $81,400 | $56 | 63 |
| 2127 Westwind Ct | 0.71mi | 3/2.0 | 1,248 (-6%) | 20mo | $304,900 | $244 | 40 |
Match score weights: distance 35% · size 25% · config 20% · recency 20%. Top-matched comps best support the ARV.
Projected returns pro-forma
-3.0% appreciation · 3.0% rent growth · sell at horizon
- IRR
- 11.6%
- Equity multiple
- 1.46×
- Total profit
- $12,808
- Equity at exit
- $14,761
- IRR
- 20.6%
- Equity multiple
- 2.74×
- Total profit
- $48,276
- Equity at exit
- $8,560
Cash invested: $27,720 (down + closing). Projections, not guarantees.
Landlord ↔ Tenant lean methodology
- Overall (STATE)
- 28 Tenant-Leaning
- State Washington
- 28 Tenant-Leaning · D+8
- County
- — inherits STATE
- City
- — inherits STATE
ZIP-level market 99403
- Active inventory
- 250
- Price-to-rent
- 6.0×
Monthly cashflow live
- Estimated rent
- $1,377 medium interval (Pro) →
- Mortgage (P&I)
- −$519
- Tax from tax record
- −$74 /mo · $888/yr
- Insurance
- −$41
- HOA
- −$0
- Vacancy / Maint / Mgmt
- −$289
- Net cashflow
- $453
Break-even live
Sensitivity live
| Price | -10% $509 | -5% $481 | +0% $453 | +5% $425 | +10% $397 |
|---|---|---|---|---|---|
| Rent | -10% $344 | -5% $399 | +0% $453 | +5% $508 | +10% $562 |
| Rate | -1.0pp $503 | -0.5pp $478 | base $453 | +0.5pp $427 | +1.0pp $401 |
UW: 25.0% down · 7.5% · 30yr · 1.5% tax · 5.0% vac · 8.0% maint · 8.0% mgmt
Financing live
Cash to close
- Down payment
- $24,750
- Closing costs
- $2,970
- Reserves months
- —
- Total cash needed
- —
Loan-product check · same deal, 3 products live
Conventional
25% down · 7.5% · 30yr
- Down + closing
- —
- Monthly P&I
- —
- Monthly cashflow
- —
- DSCR
- —
- Eligible?
- —
Personal DTI + credit; lowest rate.
DSCR
20% down · 8.5% · 30yr
- Down + closing
- —
- Monthly P&I
- —
- Monthly cashflow
- —
- DSCR
- —
- Eligible?
- —
No personal income docs; deal must DSCR.
Hard money
10% down · 12.0% · 12mo
- Down + closing
- —
- Monthly P&I
- —
- Monthly cashflow
- —
- DSCR
- —
- Eligible?
- —
Short-term bridge; refi at stabilization.
Listing history 10 events
-
2026-06-17status $99,000 Pending 13 DOM
-
2026-06-17days on market $99,000 Active 13 DOM
-
2026-06-16days on market $99,000 Active 12 DOM
-
2026-06-15days on market $99,000 Active 11 DOM
-
2026-06-14days on market $99,000 Active 9 DOM
-
2026-06-12days on market $99,000 Active 8 DOM
-
2026-06-09days on market $99,000 Active 5 DOM
-
2026-06-08days on market $99,000 Active 4 DOM
-
2026-06-07remarks 492-char remark
-
2026-06-07$99,000 Active 3 DOM
ⓘ Source: listings_history table (triggers on properties + properties_extension) + one-shot
backfill from property_details.listing_events for pre-trigger history.
Tax reassessment forecast WA · Resets to sale price
- Current annual tax
- $888 · $74/mo
- Projected year-2 tax
- $970 · $81/mo
- Expected delta
- +$82/yr (+$7/mo · 9.2%)
ⓘ Screening estimate from a state-policy table — verify with the county assessor before closing.
Climate risk First Street
- Flood 1/10 Low FEMA zone X · 0% chance over 30 yrs
- Wildfire 3/10 Moderate
- Heat 4/10 Moderate 6 d/yr ≥100°F today · 13 d/yr by 30 yrs out
- Wind 1/10 Low
- Air quality 8/10 Severe 12 unhealthy d/yr today · 17 by 30 yrs out
Nearby sold comps map
Loading sold comps map…
Walkable amenities ~0.75 mi
Loading nearby amenities…
Taxation est. · year 1
- Rental income
- $16,520
- − Mortgage interest
- −$5,546
- − Property taxes
- −$888
- − Insurance
- −$495
- − Repairs & maintenance
- −$1,322
- − Management
- −$1,322
- − Depreciation
- −$2,880
- Taxable income
- $4,068
- Est. tax owed @ 24.0%
- −$976
- After-tax cash flow
- $4,461/yr
For passive investors: Depreciation is non-cash, so a rental often shows a tax loss while cash-flowing — sheltering income. Rental losses are passive: they offset passive income freely, and up to $25,000/yr can offset ordinary (W-2) income if you actively participate and your MAGI is under $100k (phasing out to $0 by $150k); unused losses carry forward. On sale, claimed depreciation is recaptured at up to 25%, and gains may owe capital-gains tax (a 1031 exchange can defer both). Figures are a year-1 estimate at your 24.0% rate — not tax advice; consult a CPA.
Schools (NCES district)
- District
- Clarkston School District
- NCES district ID
- 5301320
- Math proficiency
- 38% ▼ -4.00%
- Reading proficiency
- 57% ▲ 1.00%
- Median HH income
- $42,030
- Composite
- 42.03/100
- National rank
- #7065
- State rank
- #172 of 291 in WA
Livability — Clarkston Heights-Vineland
No livability data for this city. (Only ~50 U.S. cities are tracked.)
Census & demographics
- Census place
- Clarkston Heights-Vineland, WA
- Population (ZIP)
- 20,483
Population outlook (Asotin County) Hauer SSP2
- Today (2025)
- 22,623 people
- By 2030
- 22,746 · +0.5%
- By 2040
- 22,597 · -0.1%
- By 2050
- 21,947 · -3.0%
- By 2075
- 19,478 · -13.9%
- By 2100
- 16,206 · -28.4%
Race, ethnicity, and origin ACS 2023
- Neighborhood character
- Predominantly White (87%)
- Race & ethnicity
- White 87% Two or more races 6% Hispanic / Latino 5% Native American 1% Asian 1%
- Common ancestry
- Portuguese 3% Lithuanian 2% Slovak 2%
- Foreign-born
- 2% · Canada
- Languages at home
- 97% English-only · Spanish 2% Tagalog/Filipino 1%
Political lean MEDSL · Asotin
- 2024 margin
- Strong R (+25.6) · D 35.8% · R 61.5% · Other 2.7%
- 2008→2024 swing
- -12.2pp toward R · 2008: -13.4pp · 2024: -25.6pp
- All cycles
- 2024: R+25.6 2020: R+25.7 2016: R+26.8 2012: R+16.7 2008: R+13.4
Not yet ingested
- Civics
- —
Market trends
- HPI YoY
- ▼ -346.91%
- Current HPI
- 173.3027
- Rent YoY
- —
- Metro
- —
- State GDP YoY
- ▲ 4.65%
- F500 in state
- 22
Industry mix (Fortune 500 HQ in WA)
| Industry | F500 HQs | Revenue |
|---|---|---|
| Retail | 2 | $269B |
|
||
| Technology / Retail | 1 | $638B |
|
||
| Technology | 1 | $245B |
|
||
| Telecommunications | 1 | $38B |
|
||
| Food / Beverage | 1 | $36B |
|
||
| Automotive / Trucks | 1 | $34B |
|
||
Price history
+66.4% since first listed7 events — show timeline
- 2026-06-04 Listed $99,000 IMLS
- 2020-07-17 Sold (MLS) — IMLS
- 2020-06-12 Listed $74,900 IMLS
- 2018-11-13 Sold (MLS) — IMLS
- 2018-10-10 Listed $63,500 IMLS
- 2017-10-13 Sold (MLS) — IMLS
- 2017-08-07 Listed $59,500 IMLS
Property tax history
+7.3%/yrLatest (2025): $888 · +60.6% YoY. Source: county tax records.
Cash-flow waterfall
monthlySold comps — $/sqft
last 12 mo · ≤1 miLoading sold comps…