 🌊 Lakefront
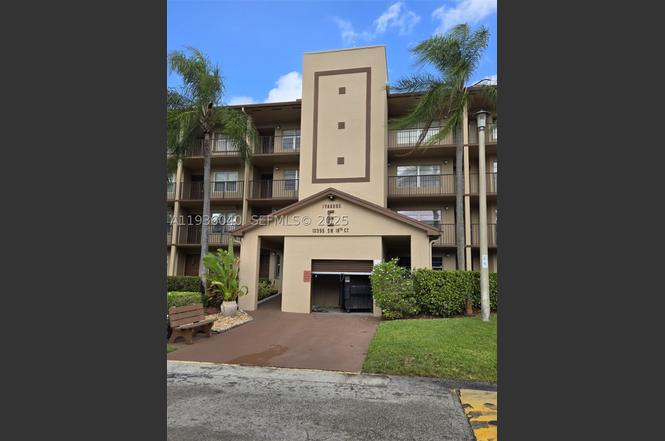
13355 SW 16th Ct Unit 406E · Pembroke Pines, FL
Flood risk 7/10 · Major
- FEMA flood zone
- X (shaded)
- Chance of flooding over 30 yrs
- 0.76%
- Est. flood insurance / yr
- $507 – $1,088
Fire risk 1/10 · Minimal
- Est. fire insurance / yr
- $947 – $1,759
Heat risk 10/10 · Severe
- Hot days now (above 106°F)
- 7 days/yr
- Hot days in 30 yrs
- 29 days/yr
Wind risk 10/10 · Severe
- Chance of severe wind over 30 yrs
- 99.0%
Air-quality risk 2/10 · Minimal
- Unhealthy air days now
- 2 days/yr
- Unhealthy air days in 30 yrs
- 2 days/yr
Risk factors via First Street. Map © Google.
Why this score? — see what drove the D grade
The composite is a weighted blend of 9 inputs, each scored 0–100. Each bar is that input's sub-score; the figure is the points it added to the 100-point composite (weight × sub-score).
- Cash flow +9.1/30.0
- ARV discount +7.5/15.0
- 1% rule +7.3/10.0
- Livability +4.2/5.0
- Schools +4.1/10.0
- Appreciation +4.0/10.0
- DSCR +2.5/10.0
- Rent growth +2.5/5.0
- Condition / age +2.5/5.0
$179,999
🖨 Deal sheet (PDF) 📄 Offer letter ✓ Due diligence
Listing remarks
This is a top floor (4th floor) 2 bedroom 2 bath 55+ community lakefront condo with amazing community amenities. Unit is completely tiled and features white cabinetry with washer and dryer in unit. Unit has amazing views of the lake. Open your slider to a screen enclosed patio enjoying the breeze off the lake. Master bedroom also faces lake and has a huge master closet. Unit is protected with hurricane folding shutters for hurricane protection. NEW A/C IN 2025! Pets are excluded except for service and emotional support designations. No rentals for the first 2 years. Application to Condo Association can take up to 30 days. Easy to show on lockbox. Info on application in the attachments. Ass
Key facts
- Community amenities
- Washer and dryer
- Completely tiled
Tags
Property features AI
Finance
- Financial info: Pets allowed with restrictions
- HOA & community: Monthly association fee; Association fee covers management, amenities, common areas, insurance, legal/accounting, grounds and structure maintenance, pool(s), recreation facilities, reserve fund, security, and trash; Community amenities include fitness center, barbecue/picnic area, pool, tennis courts, trails, transportation service, and elevators; Senior community
Exterior
- Parking: Assigned parking (one space)
- Security: Complex fenced; Key card entry; Security guard; Fire sprinkler system
- Utilities: Cable available
- Home design: Attached property; 4-story building; Entry on level 4
- Construction: Block construction; Effective year built
- Exterior features: Balcony (open and screened); Storm/security shutters; Heated pool; Lakefront; Has a view
Interior
- Kitchen: Electric range; Microwave; Dishwasher; Refrigerator
- Bedrooms: Bedroom on main level
- Flooring: Ceramic tile
- Bathrooms: 2 full bathrooms
- Heating & cooling: Central heating (electric); Central air conditioning (electric); Ceiling fan(s)
- Interior features: Breakfast bar; Eat-in kitchen; Living/dining room; Pantry; Custom mirrors; Split bedroom floorplan; Elevator access; Blinds; Sliding windows
- Laundry & utility: Washer; Dryer; Electric water heater
Neighborhood map
What this means for you Summary
Snapshot
- This is a 2-bed/2.0-bath condo listed at $180k.
Deal economics
- At list price, monthly cash flow is $-203 ($-2k/yr) — negative.
- To cash-flow at today's rent, offer at most $144k (20.0% below list).
- Meets the 1% rule at list price ($2k rent vs $180k).
- Recommended offer: $144k (20.0% below list) — sets the bar for cash-flow.
- Cap rate 5.4% vs local median 4.0% in Pembroke Pines — top-decile yield for the area; either an underpriced asset or a hidden risk that comps aren't pricing in. Stress-test before assuming the spread holds.
Location & tenants
- Location reads 83/100 on livability (#54 in FL, #933 nationally) — a professional / high-income tenant draw. Strengths: housing A+, health & safety A+, crime A-; Watch: amenities D+, cost of living D+.
- Broward (suburban): math 42% / reading 53% proficiency, ranked #46 of 73 in FL (top 63%) — families likely to look elsewhere, expect single-tenant / working-renter base with shorter leases.
- Zoned schools: Nova Blanche Forman Elementary (math 35% / reading 55%, grade D-, #1,271 of 2,144 statewide, top 60%, 769 students, 72% FRL); Nova Middle School (math 44% / reading 53%, grade C-, #274 of 571 statewide, top 50%, 1,284 students, 68% FRL); Charles W Flanagan High School (math 29% / reading 50%, grade F, #304 of 667 statewide, top 47%, 2,475 students, 57% FRL).
- Market conditions: Rents soft (-0.2%/yr); 549 active listings in the ZIP; 40 comparable units currently listed for rent nearby; rentals at typical pace (median 24d on market — plan ~3-4 weeks tenant-placement turnaround); solid renter incomes; 2,111 units permitted in Broward County in 2024 (1,265 in 5+ unit buildings).
- This rent runs 35% of the median local income ($77k/yr) — at the standard rent-burdened threshold; future hikes will face affordability resistance.
Forward outlook
- Local home prices are declining (-2.0%/yr); year-one equity from $1k of loan paydown is wiped out by about $4k of value loss. Plan a longer hold.
- Broward County population projected at +34% by 2050 — long-run rental-demand tailwind backs the buy-and-hold thesis.
Negotiation context
- It's been on market 174 days — a 12% lower offer ($158k) is reasonable based on typical stale-listing flexibility.
Risks & watch-outs
- Watch-outs: flood insurance adds $66/mo; HOA is 23% of rent.
- Climate carrying-cost: major flood risk; severe wind risk, 99% chance of damaging wind over 30y; extreme-heat days projected 7→29/yr by 2055 (HVAC capex compounding) — expect insurance premiums to compound above CPI over the hold.
Questions for the listing agent
- What do current leases actually rent for vs. the listed asking? Can we see a recent rent roll and the last 12 months of T-12 income?
- It's been on market 174 days. Have you received any prior offers? Is the seller open to a 20% concession, seller financing, or rate buy-down credit?
- What's the actual annual flood-insurance premium (NFIP or private), and is the property in a SFHA with mandatory coverage?
- What does the HOA fee cover, when was the last increase, and are there any pending special assessments or reserve-fund shortfalls?
- Any open or pending special assessments — roof, HVAC, plumbing, elevator, façade? What's the per-unit balance and payoff schedule, and is the seller paying it off at close or rolling it to the buyer?
- Why hasn't it sold? Are there any deal-killer items the seller is aware of (foundation, flood, title, zoning, code violations)?
- Is there a deadline driving the sale (1031 exchange, divorce, estate, relocation)? That informs how much negotiation room exists.
- Schools are A-rated — typically a magnet for longer-tenancy family renters. What's the average tenant stay here, and is there a school-zone premium baked into asking?
- The area grade is low — what's the realistic commute time and amenity access for the typical tenant pool here? Any planned neighborhood developments (good or bad) we should know about?
- This sits on a lake — are riparian / water-frontage rights deeded with the parcel? Any dock permits, shoreline easements, or HOA water-use restrictions?
- What's the documented flood / surge / shoreline-erosion history here (FEMA AND non-FEMA — e.g., storm surge, creek backup, septic-field saturation)?
- Any water-quality or seasonal algae-bloom issues that affect tenant satisfaction or short-term-rental demand?
- What's the average days-on-market for RENTAL listings here right now (not sales)? A rising rental-DOM trend means longer vacancies and softer asking-rent achievability than the comps imply.
- What's the recent tenant-quality profile in this submarket — average credit score on applications, eviction rate, late-payment / NSF rate, and stable-employment percentage? A property-management company in the area should have these aggregated.
- How much new apartment / multifamily construction is in the pipeline within 1–3 miles? Heavy new supply (>2% of stock underway) typically softens rents 12–24 months out; light construction supports rent growth.
Investment metrics
- 1% rule
- 1.23% ✓
- Cap rate
- 5.38%
- Cash-on-cash
- -3.26%
- DSCR
- 0.85
- GRM
- 6.8
CMA / ARV
No comps found within radius.
Projected returns pro-forma
-2.01% appreciation · 0.0% rent growth · sell at horizon
- IRR
- -21.9%
- Equity multiple
- 0.19×
- Total profit
- $-40,599
- Equity at exit
- $34,855
- IRR
- -24.2%
- Equity multiple
- -0.36×
- Total profit
- $-68,467
- Equity at exit
- $29,688
Cash invested: $50,400 (down + closing). Projections, not guarantees.
Landlord ↔ Tenant lean methodology
- Overall (STATE)
- 87 Strongly Landlord-Friendly
- State Florida
- 87 Strongly Landlord-Friendly · R+3
- County
- — inherits STATE
- City
- — inherits STATE
ZIP-level market 33027
- Home prices YoY
- -0.6%
- Rents YoY
- -0.2%
- Active inventory
- 549
- Price-to-rent
- 6.8×
Monthly cashflow live
- Estimated rent
- $2,212 high interval (Pro) →
- Mortgage (P&I)
- −$944
- Tax from tax record
- −$366 /mo · $4,398/yr
- Insurance
- −$75
- Flood insurance flood zone
- −$66 /mo · $798/yr
- HOA
- −$499
- Vacancy / Maint / Mgmt
- −$465
- Net cashflow
- $-203
Break-even live
Sensitivity live
| Price | -10% $-101 | -5% $-152 | +0% $-203 | +5% $-254 | +10% $-305 |
|---|---|---|---|---|---|
| Rent | -10% $-378 | -5% $-291 | +0% $-203 | +5% $-116 | +10% $-29 |
| Rate | -1.0pp $-113 | -0.5pp $-158 | base $-203 | +0.5pp $-250 | +1.0pp $-297 |
UW: 25.0% down · 7.5% · 30yr · 1.5% tax · 5.0% vac · 8.0% maint · 8.0% mgmt
Financing live
Cash to close
- Down payment
- $45,000
- Closing costs
- $5,400
- Reserves months
- —
- Total cash needed
- —
Loan-product check · same deal, 3 products live
Conventional
25% down · 7.5% · 30yr
- Down + closing
- —
- Monthly P&I
- —
- Monthly cashflow
- —
- DSCR
- —
- Eligible?
- —
Personal DTI + credit; lowest rate.
DSCR
20% down · 8.5% · 30yr
- Down + closing
- —
- Monthly P&I
- —
- Monthly cashflow
- —
- DSCR
- —
- Eligible?
- —
No personal income docs; deal must DSCR.
Hard money
10% down · 12.0% · 12mo
- Down + closing
- —
- Monthly P&I
- —
- Monthly cashflow
- —
- DSCR
- —
- Eligible?
- —
Short-term bridge; refi at stabilization.
Rent comps 40 comps
| Address | Beds | Baths | Sqft | Rent | $/sqft | DOM | Units | Dist |
|---|---|---|---|---|---|---|---|---|
| 1501 SW 134th Way Unit D304 Pembroke Pines, FL | 2.0 | 2.0 | 1192 | $2,395 | $2.01 | 26d | 1 | 0.06mi |
| 13455 SW 16th Ct Unit 306-F Pembroke Pines, FL | 2.0 | 1.5 | 936 | $2,000 | $2.14 | 20d | 1 | 0.11mi |
| 1401 SW 134th Way Unit C314 Pembroke Pines, FL | 2.0 | 2.0 | 1044 | $2,700 | $2.59 | 26d | 1 | 0.12mi |
| 1551 SW 135th Ter Pembroke Pines, FL | 1.0–2.0 | 1.5 | 752 | $1,900 | $2.53 | 15d | 2 | 0.14mi |
| 13055 SW 15th Ct Pembroke Pines, FL | 1.0–2.0 | 1.5–2.0 | 1011 | $2,000 | $1.98 | 7d | 2 | 0.29mi |
| 13055 SW 15th Ct Pembroke Pines, FL | 1.0–2.0 | 1.5–2.0 | 1011 | $2,000 | $1.98 | 26d | 2 | 0.29mi |
| 13701 SW 12th St Apt 103A Pembroke Pines, FL | 2.0 | 2.0 | 1207 | $2,500 | $2.07 | 4d | 1 | 0.34mi |
| 13455 SW 9th Ct Pembroke Pines, FL | 1.0 | 1.5 | 811 | $1,685 | $2.08 | 23d | 2 | 0.39mi |
| 13355 SW 9th Ct Unit 317H Pembroke Pines, FL | 2.0 | 2.0 | 1044 | $1,975 | $1.89 | 7d | 1 | 0.41mi |
| 13255 SW 9th Ct Unit 402G Pembroke Pines, FL | 2.0 | 2.0 | 1044 | $1,800 | $1.72 | 26d | 1 | 0.44mi |
| 1300 SW 130th Ave Pembroke Pines, FL | 1.0–2.0 | 1.0–2.0 | 885 | $1,975 | $2.23 | 26d | 2 | 0.44mi |
| 13255 SW 9th Ct Unit 202G Pembroke Pines, FL | 2.0 | 2.0 | 1044 | $1,790 | $1.71 | 19d | 1 | 0.44mi |
| 1351 SW 141st Ave Unit 213G Pembroke Pines, FL | 2.0 | 2.0 | 1207 | $1,800 | $1.49 | 19d | 1 | 0.44mi |
| 801 SW 133rd Ter Unit 401K Pembroke Pines, FL | 1.0 | 1.0 | 960 | $1,850 | $1.93 | 26d | 1 | 0.45mi |
| 850 SW 133rd Ter Pembroke Pines, FL | 2.0 | 1.5 | 953 | $1,938 | $2.03 | 22d | 2 | 0.46mi |
| 850 SW 133rd Ter Pembroke Pines, FL | 2.0 | 1.5 | 953 | $1,938 | $2.03 | 3d | 2 | 0.46mi |
| 850 SW 133rd Ter Unit B406 Pembroke Pines, FL | 2.0 | 1.5 | 953 | $1,900 | $1.99 | 26d | 1 | 0.46mi |
| 850 SW 133rd Ter Unit 106B Pembroke Pines, FL | 2.0 | 1.5 | 953 | $1,975 | $2.07 | 23d | 1 | 0.46mi |
| 800 SW 131st Ave Unit 311F Pembroke Pines, FL | 1.0 | 1.5 | 811 | $1,800 | $2.22 | 26d | 1 | 0.49mi |
| 1401 SW 128th Ter Unit H309 Pembroke Pines, FL | 2.0 | 2.0 | 1100 | $2,200 | $2.00 | 13d | 1 | 0.49mi |
| 13250 SW 7th Ct Unit 402L Pembroke Pines, FL | 2.0 | 2.0 | 1044 | $1,750 | $1.68 | 16d | 1 | 0.51mi |
| 13250 SW 7th Ct Unit 402L Pembroke Pines, FL | 2.0 | 2.0 | 1044 | $1,750 | $1.68 | 4d | 1 | 0.51mi |
| 1151 SW 128th Ter Unit 210D Pembroke Pines, FL | 2.0 | 2.0 | 1192 | $2,200 | $1.85 | 26d | 1 | 0.52mi |
| 1001 SW 141st Ave Unit 311K Pembroke Pines, FL | 1.0 | 1.5 | 1056 | $1,900 | $1.80 | 5d | 1 | 0.52mi |
| 13255 SW 7th Ct Pembroke Pines, FL | 2.0 | 1.5 | 953 | $1,825 | $1.92 | 0d | 2 | 0.54mi |
| 13255 SW 7th Ct Unit 305D Pembroke Pines, FL | 2.0 | 1.5 | 953 | $1,850 | $1.94 | 26d | 1 | 0.55mi |
| 13255 SW 7th Ct Unit 406D Pembroke Pines, FL | 2.0 | 1.5 | 953 | $1,850 | $1.94 | 9d | 1 | 0.55mi |
| 13155 SW 7th Ct Unit 402E Pembroke Pines, FL | 2.0 | 2.0 | 1044 | $2,000 | $1.92 | 26d | 1 | 0.55mi |
| 12701 SW 13th St Unit 202F Pembroke Pines, FL | 2.0 | 2.0 | 1100 | $1,900 | $1.73 | 9d | 1 | 0.57mi |
| 12701 SW 13th St Unit 202F Pembroke Pines, FL | 2.0 | 2.0 | 1100 | $2,000 | $1.82 | 26d | 1 | 0.57mi |
| 900 SW 142nd Ave Pembroke Pines, FL | 2.0 | 2.0 | 1207 | $2,200 | $1.82 | 3d | 2 | 0.57mi |
| 301 SW 135th Ave Unit 415C Pembroke Pines, FL | 1.0 | 1.5 | 811 | $1,650 | $2.03 | 0d | 1 | 0.57mi |
| 301 SW 135th Ave Unit 415C Pembroke Pines, FL | 1.0 | 1.5 | 811 | $1,650 | $2.03 | 23d | 1 | 0.57mi |
| 900 SW 142nd Ave Unit 202L Pembroke Pines, FL | 2.0 | 2.0 | 1207 | $2,300 | $1.91 | 9d | 1 | 0.58mi |
| 850 SW 138th Ave Pembroke Pines, FL | 1.0–2.0 | 1.5–2.0 | 1120 | $2,250 | $2.01 | 23d | 2 | 0.58mi |
| 1651 SW 127th Ave Apt 305A Pembroke Pines, FL | 2.0 | 2.0 | 1207 | $2,650 | $2.20 | 26d | 1 | 0.59mi |
| 12601 SW 13th St Unit 303G Pembroke Pines, FL | 2.0 | 2.0 | 1192 | $2,150 | $1.80 | 26d | 1 | 0.63mi |
| 551 SW 135th Ave Unit 405B Pembroke Pines, FL | 2.0 | 1.5 | 953 | $1,700 | $1.78 | 26d | 1 | 0.64mi |
| 12650 SW 15th St Unit F304 Pembroke Pines, FL | 2.0 | 1.5 | 1032 | $1,900 | $1.84 | 26d | 1 | 0.64mi |
| 12651 SW 16th Ct Unit B304 Pembroke Pines, FL | 2.0 | 1.5 | 1032 | $2,200 | $2.13 | 26d | 1 | 0.64mi |
HOA detail condo
- Monthly dues
- $499 · $5,988/yr
- Assessments
- None detected in remarks — confirm with the listing agent.
Listing history 21 events
-
2026-06-21days on market $179,999 Active 174 DOM
-
2026-06-18days on market $179,999 Active 171 DOM
-
2026-06-17days on market $179,999 Active 170 DOM
-
2026-06-16days on market $179,999 Active 169 DOM
-
2026-06-15price $179,999 Active 168 DOM
-
2026-06-15days on market $189,999 Active 168 DOM
-
2026-06-13days on market $189,999 Active 166 DOM
-
2026-06-09days on market $189,999 Active 162 DOM
-
2026-06-08status $189,999 Active 160 DOM
-
2026-06-07days on market $189,999 Active Under Contract 160 DOM
-
2026-06-04days on market $189,999 Active Under Contract 157 DOM
-
2026-06-03days on market $189,999 Active Under Contract 156 DOM
-
2026-06-02days on market $189,999 Active Under Contract 155 DOM
-
2026-06-01days on market $189,999 Active Under Contract 154 DOM
-
2026-05-31days on market $189,999 Active Under Contract 153 DOM
-
2026-03-28historical Active Under Contract
-
2026-02-14price $189,999
-
2025-12-29$200,000 Active
-
2005-04-19soldstatus $175,500
-
1997-04-11soldstatus $75,000
-
1993-04-30soldstatus $80,400
ⓘ Source: listings_history table (triggers on properties + properties_extension) + one-shot
backfill from property_details.listing_events for pre-trigger history.
Tax reassessment forecast FL · Resets to sale price
- Current annual tax
- $4,398 · $366/mo
- Projected year-2 tax
- $4,398 · $366/mo
- Expected delta
- $0/yr ($0/mo · 0.0%)
ⓘ Screening estimate from a state-policy table — verify with the county assessor before closing.
Climate risk First Street
- Flood 7/10 Severe FEMA zone X (shaded) · 76% chance over 30 yrs
- Wildfire 1/10 Low
- Heat 10/10 Extreme 7 d/yr ≥106°F today · 29 d/yr by 30 yrs out
- Wind 10/10 Extreme 99% chance of damaging wind over 30 yrs
- Air quality 2/10 Low 2 unhealthy d/yr today · 2 by 30 yrs out
Nearby sold comps map
Loading sold comps map…
Walkable amenities ~0.75 mi
Loading nearby amenities…
Taxation est. · year 1
- Rental income
- $26,545
- − Mortgage interest
- −$10,083
- − Property taxes
- −$4,398
- − Insurance
- −$1,697
- − Repairs & maintenance
- −$2,124
- − Management
- −$2,124
- − HOA
- −$5,988
- − Depreciation
- −$5,236
- Taxable loss
- −$5,105
- Est. tax savings @ 24.0%
- +$1,225
- After-tax cash flow
- $-1,215/yr
For passive investors: Depreciation is non-cash, so a rental often shows a tax loss while cash-flowing — sheltering income. Rental losses are passive: they offset passive income freely, and up to $25,000/yr can offset ordinary (W-2) income if you actively participate and your MAGI is under $100k (phasing out to $0 by $150k); unused losses carry forward. On sale, claimed depreciation is recaptured at up to 25%, and gains may owe capital-gains tax (a 1031 exchange can defer both). Figures are a year-1 estimate at your 24.0% rate — not tax advice; consult a CPA.
Schools (NCES district)
- District
- Broward
- NCES district ID
- 1200180
- Math proficiency
- 42% ▼ -18.00%
- Reading proficiency
- 53% ▼ -5.00%
- Median HH income
- $52,139
- Composite
- 40.88/100
- National rank
- #3621
- State rank
- #46 of 73 in FL
Livability — Pembroke Pines
- Score
- 83/100
- State rank
- #54
- US rank
- #933
Category grades
Schools grade is shown separately in the Schools card above.
Census & demographics
- Census place
- Pembroke Pines, FL
- County
- Broward County · 1,963,430 people
- City population
- 180,224
- Metro
- Miami-Fort Lauderdale-Pompano Beach, FL
- Population (ZIP)
- 65,116
- Household income
- $76,561
- Rent vs Own
- Severe rent burden
- 1728.0
Population outlook (Broward County) Hauer SSP2
- Today (2025)
- 2,207,033 people
- By 2030
- 2,360,704 · +7.0%
- By 2040
- 2,661,208 · +20.6%
- By 2050
- 2,946,698 · +33.5%
- By 2075
- 3,602,273 · +63.2%
- By 2100
- 3,970,984 · +79.9%
Race, ethnicity, and origin ACS 2023
- Neighborhood character
- Diverse neighborhood (Simpson 0.65)
- Race & ethnicity
- Hispanic / Latino 52% Two or more races 23% Black 22% White 16% Asian 6%
- Hispanic origin (detail)
- Puerto Rican 6% Cuban 19% Dominican 3%
- Common ancestry
- Hispanic 6% Romanian 1% Scotch-Irish 1%
- Foreign-born
- 47% · Canada, Jamaica, Vietnam
- Languages at home
- 40% English-only · Spanish 47% French/Haitian/Cajun 5% Other Indo-European 2%
Political lean MEDSL · Broward
- 2024 margin
- D (+17.0) · D 58.0% · R 41.0%
- 2008→2024 swing
- -17.8pp toward R · 2008: 34.7pp · 2024: 17.0pp
- All cycles
- 2024: D+17.0 2020: D+29.8 2016: D+35.0 2012: D+34.9 2008: D+34.7
Not yet ingested
- Civics
- —
Market trends
- HPI YoY
- ▼ -2.01%
- Current HPI
- 359.5973
- Rent YoY
- ▼ -0.20%
- Metro
- Miami-Fort Lauderdale-Pompano Beach, FL
- State GDP YoY
- ▲ 3.28%
- F500 in state
- 36
Industry mix (Fortune 500 HQ in FL)
| Industry | F500 HQs | Revenue |
|---|---|---|
| Industrial Technology | 2 | $29B |
|
||
| Insurance | 2 | $17B |
|
||
| Retail | 1 | $60B |
|
||
| Technology Distribution | 1 | $58B |
|
||
| Homebuilding | 1 | $35B |
|
||
| Technology Manufacturing | 1 | $35B |
|
||
Price history
+136.3% since first listed6 events — show timeline
- 2026-03-28 Contingent — MARMLS
- 2026-02-14 Price Changed $189,999 MARMLS
- 2025-12-29 Listed $200,000 MARMLS
- 2005-04-19 Sold (Public Records) $175,500 Public Records
- 1997-04-11 Sold (Public Records) $75,000 Public Records
- 1993-04-30 Sold (Public Records) $80,400 Public Records
Property tax history
+7.2%/yrLatest (2025): $4,398 · +3.7% YoY. Source: county tax records.
Cash-flow waterfall
monthlySold comps — $/sqft
last 12 mo · ≤1 miLoading sold comps…