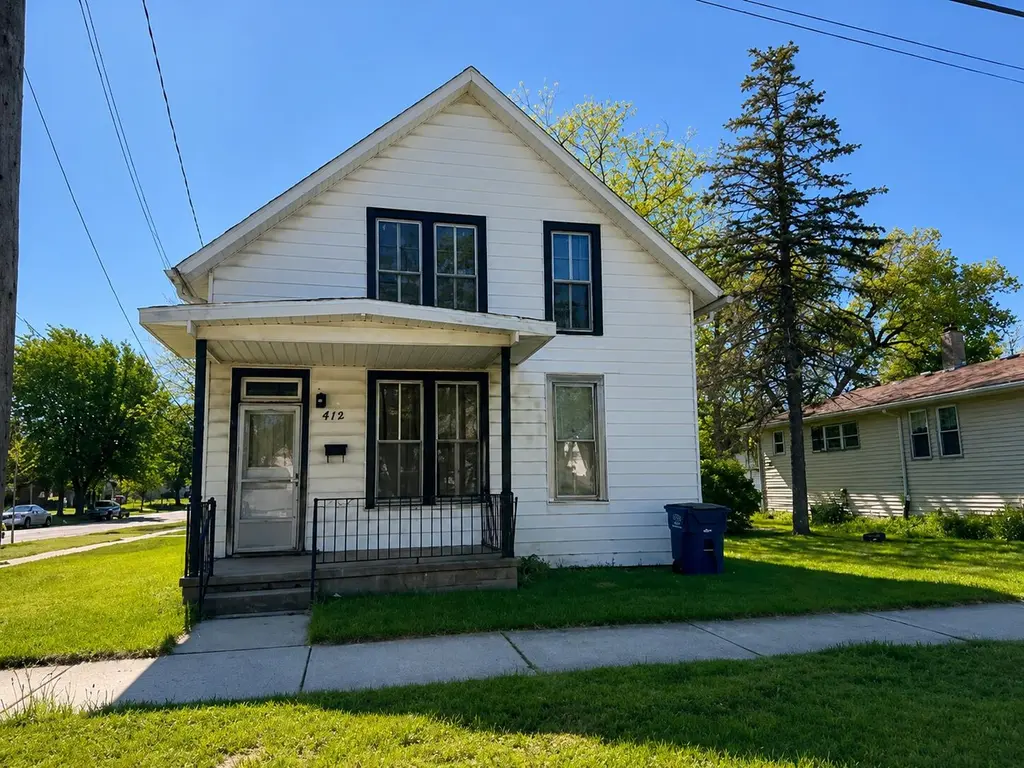
415 Cleveland Ave · Michigan City, IN
Flood risk 8/10 · Major
- FEMA flood zone
- X (unshaded)
- Chance of flooding over 30 yrs
- 0.97%
- Est. flood insurance / yr
- $473 – $860
Fire risk 2/10 · Minimal
- Est. fire insurance / yr
- $717 – $1,331
Heat risk 2/10 · Minimal
- Hot days now (above 100°F)
- 7 days/yr
- Hot days in 30 yrs
- 14 days/yr
Wind risk 2/10 · Minimal
- Chance of severe wind over 30 yrs
- —
Air-quality risk 3/10 · Minor
- Unhealthy air days now
- 2 days/yr
- Unhealthy air days in 30 yrs
- 3 days/yr
Risk factors via First Street. Map © Google.
Why this score? — see what drove the B grade
The composite is a weighted blend of 9 inputs, each scored 0–100. Each bar is that input's sub-score; the figure is the points it added to the 100-point composite (weight × sub-score).
- Cash flow +30.0/30.0
- 1% rule +10.0/10.0
- DSCR +10.0/10.0
- ARV discount +7.5/15.0
- Rent growth +4.9/5.0
- Livability +4.0/5.0
- Condition / age +2.5/5.0
- Schools +2.2/10.0
- Appreciation +0.0/10.0
$80,000
🖨 Deal sheet 📄 Offer letter ✓ Due diligence
Listing remarks
4 bedroom, 1 bath two-story home located in Michigan City offering strong potential for investors, flippers, or buyers looking for a value-add opportunity. Property needs rehab and updates throughout but provides a great opportunity to customize and create your vision. Spacious layout with plenty of room to reconfigure or improve to maximize value. With strong rental demand in the area, this could make an excellent long-term rental, flip, or renovation project. Bring your ideas and imagination -- the possibilities are endless with this open canvas opportunity.
Key facts
- 6,032 sq ft lot
- Built 1900
- Listed 35 days
Property features AI
Finance
- Other: Vacant occupancy
- Financial info: No investor or income/expense details provided
- HOA & community: No HOA information provided
Exterior
- Parking: Driveway parking; On-street parking
- Security: No security features listed
- Utilities: Public water; Public sewer
- Home design: Two-story residence; Built in 1900; Listed in fixer condition
- Construction: Asphalt roof (repeated from exterior features)
- Exterior features: Neighborhood view; Views of trees/woods; Asphalt roof
Interior
- Kitchen: No appliances listed
- Bedrooms: No bedroom details provided
- Flooring: No flooring information provided
- Bathrooms: 1 full bathroom
- Heating & cooling: Central heating; Central air conditioning
- Interior features: No interior-specific features listed; Unfinished basement
- Laundry & utility: No laundry or utility appliances listed
Neighborhood map
What this means for you Summary
Snapshot
- This is a 4-bed/1.0-bath single-family listed at $80k.
Deal economics
- At list price, monthly cash flow is $625 ($7k/yr) — positive.
- The deal already cash-flows at list — no discount required.
- Meets the 1% rule at list price ($2k rent vs $80k).
- Recommended offer: $78k (3.0% below list) — sets the bar for market timing.
- Cap rate 16.5% vs local median 2.7% in Michigan City — top-decile yield for the area; either an underpriced asset or a hidden risk that comps aren't pricing in. Stress-test before assuming the spread holds.
Location & tenants
- Location reads 81/100 on livability (#15 in IN, #1,317 nationally) — a professional / high-income tenant draw. Strengths: commute A+, cost of living A+, housing A+; Watch: employment D, schools D-, amenities D-.
- Michigan City Area Schools (urban): math 23% / reading 28% proficiency, ranked #262 of 301 in IN (top 87%) — low school quality limits family demand, transient renter base, plan for 1-2y turnover; 68% free/reduced lunch — lower-income household profile, screen leases tightly.
- Market conditions: Rents rising fast (+9.7%/yr); 371 active listings in the ZIP; 3 comparable units currently listed for rent nearby; rentals lingering (median 44d on market — plan ~5-8 weeks vacancy on turnover, expect pricing pressure); 100% of comp listings sitting > 30 days — soft ceiling on asking rent; 216 units permitted in LaPorte County in 2024 (75 in 5+ unit buildings).
- This rent runs 32% of the median local income ($59k/yr) — at the standard rent-burdened threshold; future hikes will face affordability resistance.
Forward outlook
- Local home prices are declining (-3.0%/yr); year-one equity from $553 of loan paydown is wiped out by about $2k of value loss. Plan a longer hold.
- LaPorte County population projected to shrink 7% by 2050 — rents likely to lag national; underwrite the cash flow, not the appreciation.
- At projected returns (-3.0% appreciation + 8.0% rent growth), your $22k cash investment doubles in ~4 years — after that, you're playing with house money.
Negotiation context
- It's been on market 36 days — a 3% lower offer ($78k) is reasonable based on typical stale-listing flexibility.
Risks & watch-outs
- Watch-outs: flood insurance adds $56/mo; built in 1900 — expect roof / HVAC / electrical / plumbing capex.
- Climate carrying-cost: severe flood risk — expect insurance premiums to compound above CPI over the hold.
Questions for the listing agent
- It's been on market 36 days. Have you received any prior offers? Is the seller open to a 3% concession, seller financing, or rate buy-down credit?
- Built in 1900 — when were the roof, HVAC, electrical panel, plumbing, and water heater last replaced?
- What's the actual annual flood-insurance premium (NFIP or private), and is the property in a SFHA with mandatory coverage?
- Is there a deadline driving the sale (1031 exchange, divorce, estate, relocation)? That informs how much negotiation room exists.
- Schools are D-rated, which usually means shorter tenancies and higher turnover. Who's the typical renter profile here, and what's been the actual vacancy rate?
- What's the average days-on-market for RENTAL listings here right now (not sales)? A rising rental-DOM trend means longer vacancies and softer asking-rent achievability than the comps imply.
- What's the recent tenant-quality profile in this submarket — average credit score on applications, eviction rate, late-payment / NSF rate, and stable-employment percentage? A property-management company in the area should have these aggregated.
- How much new for-sale + rental construction is in the pipeline within 1–3 miles? Heavy new supply typically softens prices + rents 12–24 months out; constrained supply supports both.
Investment metrics
- 1% rule
- 2.00% ✓
- Cap rate
- 16.49%
- Cash-on-cash
- 36.43%
- DSCR
- 2.62
- GRM
- 4.2
CMA / ARV
- ARV (median comp)
- $162,032
- List price
- $80,000
- Delta
- -50.63%
- Verdict
- UNDERPRICED
- Comps
- 20 within 1.0 mi
Show comp detail 12 sales within ~0.75 mi
| Address | Dist | Beds/Ba | Sqft | Sold | Price | $/sf | Match |
|---|---|---|---|---|---|---|---|
| 714 Pearl St | 0.11mi | 3/1.0 (-1) | 1,995 (-1%) | 2mo | $151,000 | $76 | 87 |
| 105 Belden St | 0.51mi | 4/2.0 | 1,968 (-2%) | 2mo | $210,000 | $107 | 67 |
| 211 E Fulton St | 0.50mi | 4/2.5 | 2,051 (+2%) | 3mo | $310,000 | $151 | 65 |
| 227 Short St | 0.45mi | 4/2.0 | 1,950 (-3%) | 9mo | $169,900 | $87 | 62 |
| 534 Holliday St | 0.31mi | 3/2.0 (-1) | 1,808 (-10%) | 6mo | $165,000 | $91 | 55 |
| 616 Hobart St | 0.51mi | 4/3.0 | 2,112 (+5%) | 7mo | $240,000 | $114 | 54 |
| 1621 E Michigan Blvd | 0.38mi | 3/1.5 (-1) | 2,220 (+10%) | 6mo | $110,000 | $50 | 53 |
| 1402 Greenwood Ave | 0.58mi | 3/2.0 (-1) | 2,128 (+6%) | 3mo | $150,000 | $70 | 52 |
| 1604-1608 Franklin St | 0.63mi | 3/2.5 (-1) | 2,000 (-0%) | 10mo | $180,000 | $90 | 51 |
| 516 Ridgeland Ave | 0.73mi | 5/2.0 (+1) | 1,946 (-3%) | 4mo | $77,000 | $40 | 48 |
| 225 Detroit St | 0.57mi | 4/2.0 | 1,795 (-11%) | 9mo | $219,000 | $122 | 44 |
| 623 Esther St | 0.72mi | 3/2.5 (-1) | 2,280 (+13%) | 8mo | $225,000 | $99 | 27 |
Match score weights: distance 35% · size 25% · config 20% · recency 20%. Top-matched comps best support the ARV.
Projected returns pro-forma
-3.0% appreciation · 8.0% rent growth · sell at horizon
- IRR
- 34.7%
- Equity multiple
- 2.58×
- Total profit
- $35,371
- Equity at exit
- $11,928
- IRR
- 44.3%
- Equity multiple
- 6.40×
- Total profit
- $120,920
- Equity at exit
- $6,917
Cash invested: $22,400 (down + closing). Projections, not guarantees.
Landlord ↔ Tenant lean methodology
- Overall (STATE)
- 90 Strongly Landlord-Friendly
- State Indiana
- 90 Strongly Landlord-Friendly · R+11
- County
- — inherits STATE
- City
- — inherits STATE
ZIP-level market 46360
- Rents YoY
- 9.7%
- Active inventory
- 371
- Price-to-rent
- 4.2×
Monthly cashflow live
- Estimated rent
- $1,604 medium interval (Pro) →
- Mortgage (P&I)
- −$420
- Tax from tax record
- −$134 /mo · $1,608/yr
- Insurance
- −$33
- Flood insurance flood zone
- −$56 /mo · $666/yr
- HOA
- −$0
- Vacancy / Maint / Mgmt
- −$337
- Net cashflow
- $625
Break-even live
UW: 25.0% down · 7.5% · 30yr · 1.5% tax · 5.0% vac · 8.0% maint · 8.0% mgmt
Financing live
Cash to close
- Down payment
- $20,000
- Closing costs
- $2,400
- Reserves months
- —
- Total cash needed
- —
Loan-product check · same deal, 3 products live
Conventional
25% down · 7.5% · 30yr
- Down + closing
- —
- Monthly P&I
- —
- Monthly cashflow
- —
- DSCR
- —
- Eligible?
- —
Personal DTI + credit; lowest rate.
DSCR
20% down · 8.5% · 30yr
- Down + closing
- —
- Monthly P&I
- —
- Monthly cashflow
- —
- DSCR
- —
- Eligible?
- —
No personal income docs; deal must DSCR.
Hard money
10% down · 12.0% · 12mo
- Down + closing
- —
- Monthly P&I
- —
- Monthly cashflow
- —
- DSCR
- —
- Eligible?
- —
Short-term bridge; refi at stabilization.
Rent comps 3 comps
| Address | Beds | Baths | Sqft | Rent | $/sqft | DOM | Units | Dist |
|---|---|---|---|---|---|---|---|---|
| 416 E 9th St Unit 2 Michigan City, IN | 3.0 | 2.0 | 1400 | $1,325 | $0.95 | 44d | 1 | 0.62mi |
| 1303 Buffalo St Unit 1 Michigan City, IN | 3.0 | 1.0 | 1700 | $1,700 | $1.00 | 44d | 1 | 0.92mi |
| 910 S Carroll Ave Michigan City, IN | 2.0–3.0 | 2.0 | 1187 | $1,600 | $1.35 | 44d | 3 | 1.09mi |
Listing history 18 events
-
2026-06-19days on market $80,000 Active 36 DOM
-
2026-06-18days on market $80,000 Active 35 DOM
-
2026-06-17days on market $80,000 Active 34 DOM
-
2026-06-16days on market $80,000 Active 33 DOM
-
2026-06-15days on market $80,000 Active 32 DOM
-
2026-06-14days on market $80,000 Active 30 DOM
-
2026-06-13pricedays on market $80,000 Active 29 DOM
-
2026-06-10days on market $85,000 Active 27 DOM
-
2026-06-09days on market $85,000 Active 26 DOM
-
2026-06-08days on market $85,000 Active 25 DOM
-
2026-06-07pricedays on market $85,000 Active 24 DOM
-
2026-06-03days on market $90,000 Active 20 DOM
-
2026-06-03price $90,000 Active 19 DOM
-
2026-06-02days on market $100,000 Active 19 DOM
-
2026-06-01days on market $100,000 Active 18 DOM
-
2026-05-31days on market $100,000 Active 17 DOM
-
2026-05-30days on market $100,000 Active 16 DOM
-
2026-05-14$100,000 Active 566-char remark
ⓘ Source: listings_history table (triggers on properties + properties_extension) + one-shot
backfill from property_details.listing_events for pre-trigger history.
Tax reassessment forecast IN · Partial reset (capped growth)
- Current annual tax
- $1,608 · $134/mo
- Projected year-2 tax
- $1,608 · $134/mo
- Expected delta
- $0/yr ($0/mo · 0.0%)
ⓘ Screening estimate from a state-policy table — verify with the county assessor before closing.
Climate risk First Street
- Flood 8/10 Severe FEMA zone X (unshaded) · 97% chance over 30 yrs
- Wildfire 2/10 Low
- Heat 2/10 Low 7 d/yr ≥100°F today · 14 d/yr by 30 yrs out
- Wind 2/10 Low
- Air quality 3/10 Moderate 2 unhealthy d/yr today · 3 by 30 yrs out
Nearby sold comps map
Loading sold comps map…
Walkable amenities ~0.75 mi
Loading nearby amenities…
Taxation est. · year 1
- Rental income
- $19,245
- − Mortgage interest
- −$4,481
- − Property taxes
- −$1,608
- − Insurance
- −$1,066
- − Repairs & maintenance
- −$1,540
- − Management
- −$1,540
- − Depreciation
- −$2,327
- Taxable income
- $6,683
- Est. tax owed @ 24.0%
- −$1,604
- After-tax cash flow
- $5,891/yr
For passive investors: Depreciation is non-cash, so a rental often shows a tax loss while cash-flowing — sheltering income. Rental losses are passive: they offset passive income freely, and up to $25,000/yr can offset ordinary (W-2) income if you actively participate and your MAGI is under $100k (phasing out to $0 by $150k); unused losses carry forward. On sale, claimed depreciation is recaptured at up to 25%, and gains may owe capital-gains tax (a 1031 exchange can defer both). Figures are a year-1 estimate at your 24.0% rate — not tax advice; consult a CPA.
Schools (NCES district)
- District
- Michigan City Area Schools
- NCES district ID
- 1806570
- Math proficiency
- 23% ▼ -16.00%
- Reading proficiency
- 28% ▼ -10.00%
- Median HH income
- $42,629
- Composite
- 21.76/100
- National rank
- #8257
- State rank
- #262 of 301 in IN
Livability — Michigan City
- Score
- 81/100
- State rank
- #15
- US rank
- #1317
Category grades
Schools grade is shown separately in the Schools card above.
Census & demographics
- Census place
- Michigan City, IN
- County
- La Porte County · 88,580 people
- City population
- 43,817
- Metro
- Michigan City-La Porte, IN
- Population (ZIP)
- 43,817
- Household income
- $59,266
- Rent vs Own
- Severe rent burden
- 1152.0
Population outlook (LaPorte County) Hauer SSP2
- Today (2025)
- 109,757 people
- By 2030
- 108,288 · -1.3%
- By 2040
- 105,070 · -4.3%
- By 2050
- 102,330 · -6.8%
- By 2075
- 97,009 · -11.6%
- By 2100
- 86,459 · -21.2%
Race, ethnicity, and origin ACS 2023
- Neighborhood character
- Predominantly White (67%)
- Race & ethnicity
- White 67% Black 20% Hispanic / Latino 8% Two or more races 7%
- Hispanic origin (detail)
- Mexican 5%
- Common ancestry
- Romanian 11% Lithuanian 2% Iranian 1%
- Foreign-born
- 3% · Canada
- Languages at home
- 95% English-only · Spanish 3%
Political lean MEDSL · LaPorte
- 2024 margin
- R (+14.1) · D 42.1% · R 56.2% · Other 1.7%
- 2008→2024 swing
- -19.1pp toward R · 2008: 5.0pp · 2024: -14.1pp
- All cycles
- 2024: R+14.1 2020: R+7.2 2016: R+6.4 2012: D+12.6 2008: D+5.0
Not yet ingested
- Civics
- —
Market trends
- HPI YoY
- ▼ -210.27%
- Current HPI
- 206.0882
- Rent YoY
- ▲ 9.72%
- Metro
- Michigan City-La Porte, IN
- State GDP YoY
- ▲ 2.90%
- F500 in state
- 18
Industry mix (Fortune 500 HQ in IN)
| Industry | F500 HQs | Revenue |
|---|---|---|
| Industrial Machinery | 2 | $37B |
|
||
| Healthcare | 1 | $177B |
|
||
| Pharmaceuticals | 1 | $45B |
|
||
| Metals / Steel | 1 | $18B |
|
||
| Agriculture | 1 | $17B |
|
||
| Packaging | 1 | $12B |
|
||
Price history
-20.0% since first listed4 events — show timeline
- 2026-06-12 Price Changed $80,000 NIRA MLS as Distributed by MLS Grid
- 2026-06-03 Price Changed $85,000 NIRA MLS as Distributed by MLS Grid
- 2026-06-02 Price Changed $90,000 NIRA MLS as Distributed by MLS Grid
- 2026-05-14 Listed $100,000 NIRA MLS as Distributed by MLS Grid
Property tax history
+6.7%/yrLatest (2024): $1,608 · +14.7% YoY. Source: county tax records.
Cash-flow waterfall
monthlySold comps — $/sqft
last 12 mo · ≤1 miLoading sold comps…